Database proxy monitoring details
This topic describes the details of database proxy monitoring.
View database proxy monitoring data
Go to the OceanBase Management Console .
In the navigation pane on the left, click Instance List.
In the instance list, find the target instance and click the instance name to go to the Instance Workbench.
In the navigation pane on the left of the workbench page, click Performance Monitoring.
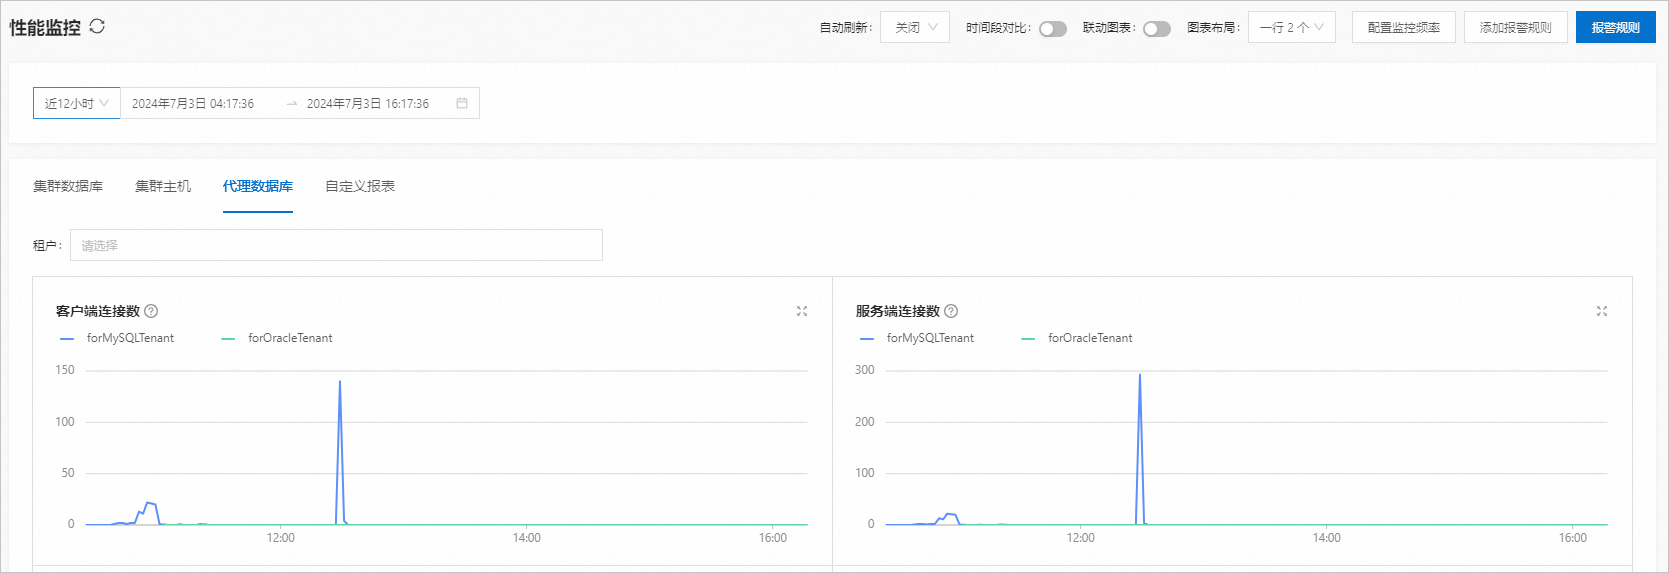
Click the Database Proxy tab.
The database proxy monitoring page displays the monitoring data for all tenants in the last hour by default.
In the tenant selection box, select a tenant to view its monitoring data. If you select multiple tenants, you can click a tenant name in the chart to filter the data.
Filter by a custom time range to view data for that period.
You can view the following monitoring metrics:
Metric Item
Metric Name
Unit
Description
Client connections
client_connections
Unit
The number of client connections.
Server-side connections
server_connections
Count
The number of server-side connections.
QPS
qps
μs
Queries Per Second (QPS).
Average SQL statement processing time
qps_rt
μs
The average processing time for an SQL statement.
TPS
tps
times/s
Transactions Per Second (TPS)
NoteThe metric names in the preceding table are also supported values for the `Metrics` request parameter of the DescribeMetricsDataV2 - Query monitoring metric data OpenAPI operation.