Multi-dimensional cluster metric details
The multi-dimensional cluster metrics page lets you view monitoring data from different dimensions, such as cluster, tenant, replica, and node.
View multi-dimensional cluster monitoring data
Log on to the OceanBase Management Console .
In the navigation pane on the left, click Instance List.
In the instance list, find the target instance and click the instance name to open the Instance Workbench.
In the navigation pane on the left of the workbench page, click Performance Monitoring.
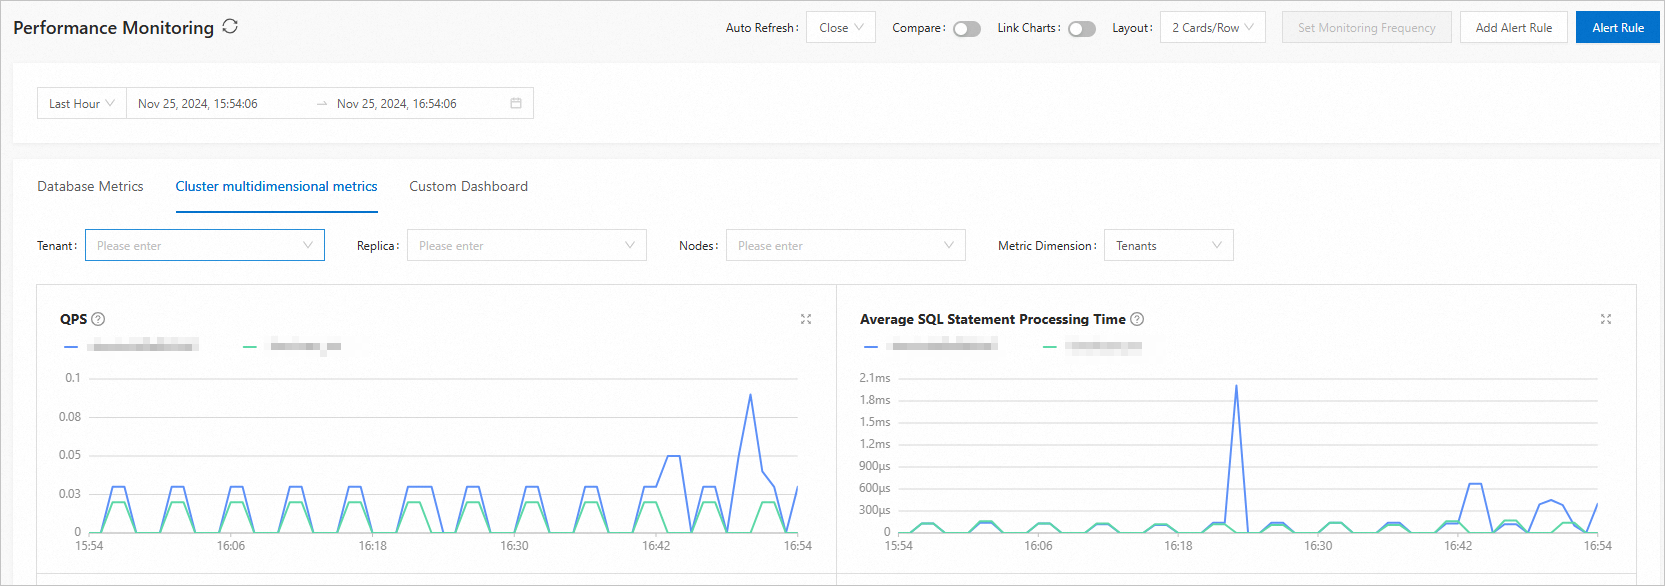
Click the Multi-dimensional Cluster Metrics tab.
By default, the multi-dimensional cluster metrics monitoring page displays the monitoring data for all tenants for the past hour.
From the Metric Dimension drop-down list, select a dimension to view its monitoring data. The available dimensions are cluster, tenant, replica, and node.
You can filter by a custom time range to view data for that period.
The following monitoring metrics are available:
Metric Item
Metric Name
Description
QPS
sql_all_count
The number of SQL statements processed per second by the tenant database. Unit: times/s.
Average SQL statement processing time
sql_all_rt
The average processing time of an SQL statement. Unit: ms.
TPS
transaction_count
The number of transactions requested per second from the tenant database. Unit: times/s.
This metric is the sum of the following request types:
Insert
Replace
Update
Delete
Average server-side transaction processing time
transaction_rt
The average processing time of a transaction. Unit: μs.
Number of sessions
all_session
The current number of sessions in the tenant database.
Request queue wait time
request_queue_time
The time an SQL statement waits in the queue. Unit: μs.
Number of transaction logs committed per second
trans_commit_log_count
The number of transaction logs committed per second by the tenant database. Unit: times/s.
Size of transaction logs committed per second
clog_trans_log_total_size
The size of transaction logs committed per second by the tenant database. Unit: MB.
Average I/O operations per second
io_count
The number of I/O operations per second for SSStore. Unit: times/s.
I/O time
io_rt
The average time for each SSStore read/write operation. Unit: μs.
I/O throughput
io_size
The data volume processed per second by SSStore. Unit: byte.
Number of transactions
transaction_partition_count
The number of transactions per second. Unit: times/s.
Available time
uptime(s):
The available time. Unit: s.
Average network synchronization time per transaction log
trans_commit_log_sync_rt
The average network synchronization time for each transaction log. Unit: ms.
Number of wait events for the database in a specific state
ob_waiteven_count
The number of wait events for the database in a specific state.
Number of execution events for the database in a specific state
ob_sql_event
The number of execution events for the database in a specific state.
Total log disk size
ob_tenant_log_disk_total_bytes
The total size of the log disk. Unit: GB.
Used log disk size
ob_tenant_log_disk_used_bytes
The used size of the log disk. Unit: GB.
Data usage
ob_tenant_server_required_size
The data usage. Unit: GB.
Data volume
ob_tenant_server_data_size
The data volume. Unit: GB.
Binlog disk usage
ob_tenant_binlog_disk_used
The disk usage of binlogs. Unit: GB.