1. Overview
Analyze your application's performance with a quantitative score. You can customize the score by selecting specific metrics. You can set your own thresholds for these metrics or use common industry standards. This lets you create a user experience benchmark and track your application's performance trends over time.
Different application types, such as Android, iOS, Mini Program, and Web, use different metrics for scoring. You must configure the scoring rules separately for each application. Scoring rules cannot be shared between applications.
2. Feature introduction
You can find the Performance Score feature in the top navigation bar under Digital Experience.
2.1 Scoring logic
The score is calculated as follows. In the Performance Score settings, you can configure the metrics, weights, experience thresholds, and scores for each range.
Step 1: Check which metrics are included in the score. For example, Crash Rate and Stuttering Rate.
Step 2: Check the weight of each metric. For example, Crash Rate (40%) and Stuttering Rate (60%).
Step 3: Review the data for the calculation period. For example, a crash rate of 1% and a stuttering rate of 4%.
Step 4: Determine the experience range for each metric. For example, a 1% crash rate is in the Unbearable range, and a 4% stuttering rate is in the Excellent range.
Step 5: Find the score for each user experience range. For example, Unbearable is 0 points, Excellent is 100 points, Good is 90 points, and Tolerable is 70 points.
The application's score for that day would be: 0 × 40% + 100 × 60% = 60 points.
2.2 Score trend
The top of the page displays today's overall score, a spider chart showing the score distribution, and the score trend graph.
If you change the scoring rules, the score and trend graph will be recalculated. Refresh the page to see the updated results. This process may take a few minutes if the data volume is large.
2.3 Score settings
Click the Edit button to configure the experience score. If you do not configure the settings, default metrics and weights are used. The default experience thresholds are based on common industry standards, but you can change them.
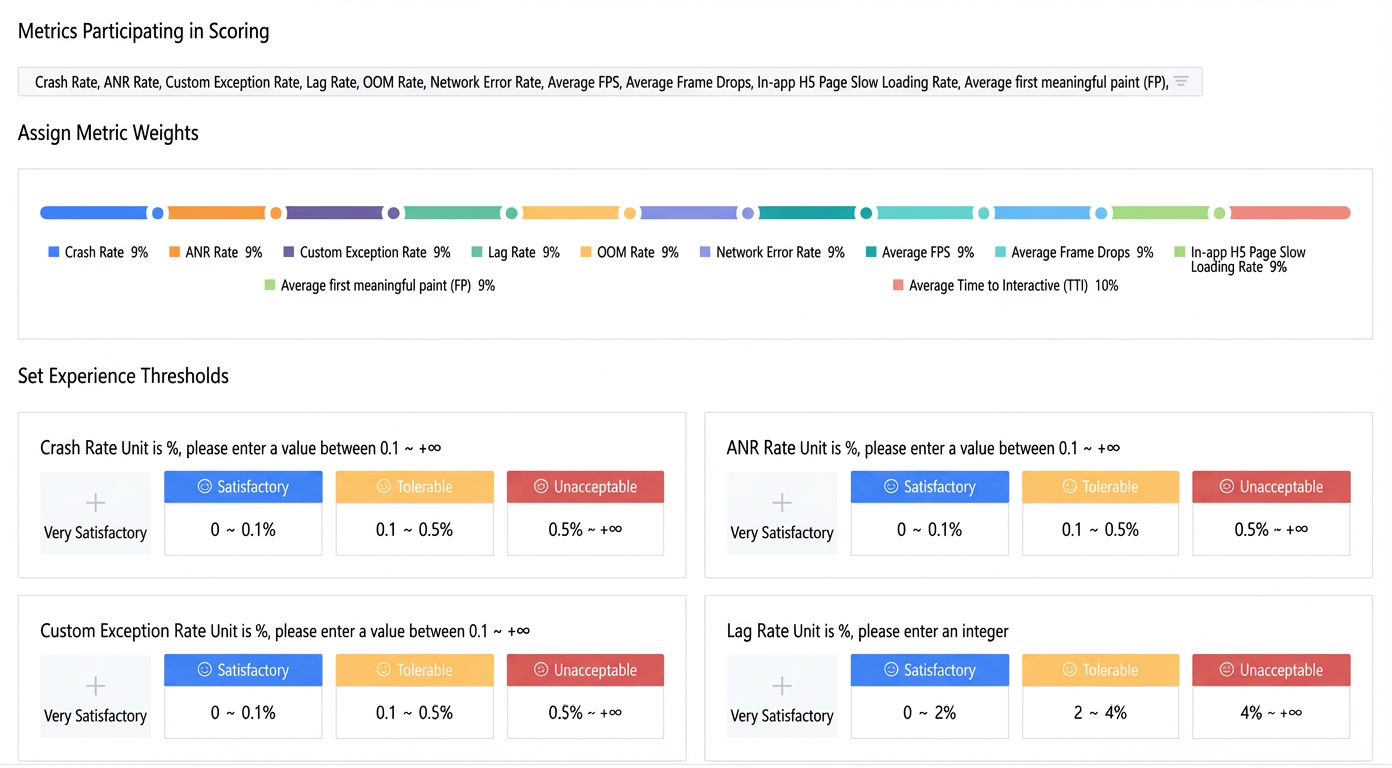

Select the metrics to include in the score. The following list shows the available metrics for mobile apps:
Platform |
Metric |
Android |
Crash Rate |
ANR Rate |
|
Custom Exception Rate |
|
Stuttering Rate |
|
Slow Start Rate |
|
OOM Rate |
|
Network Error Rate |
|
Page Crash Rate |
|
Average FPS |
|
Average Dropped Frames |
|
In-app H5 Page Slow Loading Rate |
|
Average First Paint (FP) |
|
Average Time to Interactive (TTI) |
|
iOS |
Crash Rate |
Custom Exception Rate |
|
Stuttering Rate |
|
Slow Start Rate |
|
OOM Rate |
|
Network Error Rate |
|
Page Crash Rate |
|
Average FPS |
|
Average Dropped Frames |
|
In-app H5 Page Slow Loading Rate |
|
Average First Paint (FP) |
|
Average Time to Interactive (TTI) |
Assign a weight to each metric. The weight determines the percentage that the metric contributes to the final score. The minimum weight for any metric is 1%.
Set experience thresholds. For each selected metric, you can configure user experience ranges. You can define thresholds for the Excellent, Good, Tolerable, and Unbearable ranges. The range in which a metric's value falls determines its score.
Set the score for each experience range. These scores apply to all metrics. For example, you can assign 100 points for the Excellent range, 70 points for the Good range, 50 points for the Tolerable range, and 0 points for the Unbearable range.