SDK Function Introduction
Welcome to the Performance Experience SDK integration guide. This document explains how to integrate the Performance Experience SDK into your mobile app to enable full-scope data collection and performance monitoring.
Preparation
Before using or validating the SDK, confirm that you have integrated the Performance Experience SDK correctly according to the Basic Integration document. To help validate features, enable SDK logging. For details, see the log printing section in the Basic Integration document.
1. Basic Usage
1.1 Crash and Exception Collection
After integrating both the Statistics SDK and the Performance Experience SDK, you can use automatic collection for Java exceptions, native crashes, and ANR exceptions.
If you use our SDK to capture native crashes, other crash-capture tools will no longer receive them. To let other SDKs also capture native crashes, set the following after initializing the SDK:
import com.uc.crashsdk.export.CrashApi
...
final Bundle customInfo = new Bundle();
customInfo.putBoolean("mCallNativeDefaultHandler",true);
CrashApi.getInstance().updateCustomInfo(customInfo);
1.2 Crash Callback (Custom Fields)
Register the callback only after the SDK is initialized. Otherwise, registration fails.
When a crash occurs, this callback method returns a string of custom business data. The data is written to the crash file and uploaded to the server for display. Note: The returned string must be no longer than 256 characters.
Interface example:
import com.umeng.umcrash.UMCrash
...

UMCrash.registerUMCrashCallback(new UMCrashCallback(){

     @Override
     public String onCallback(){
         return"Custom string registered at crash time";
    }
});
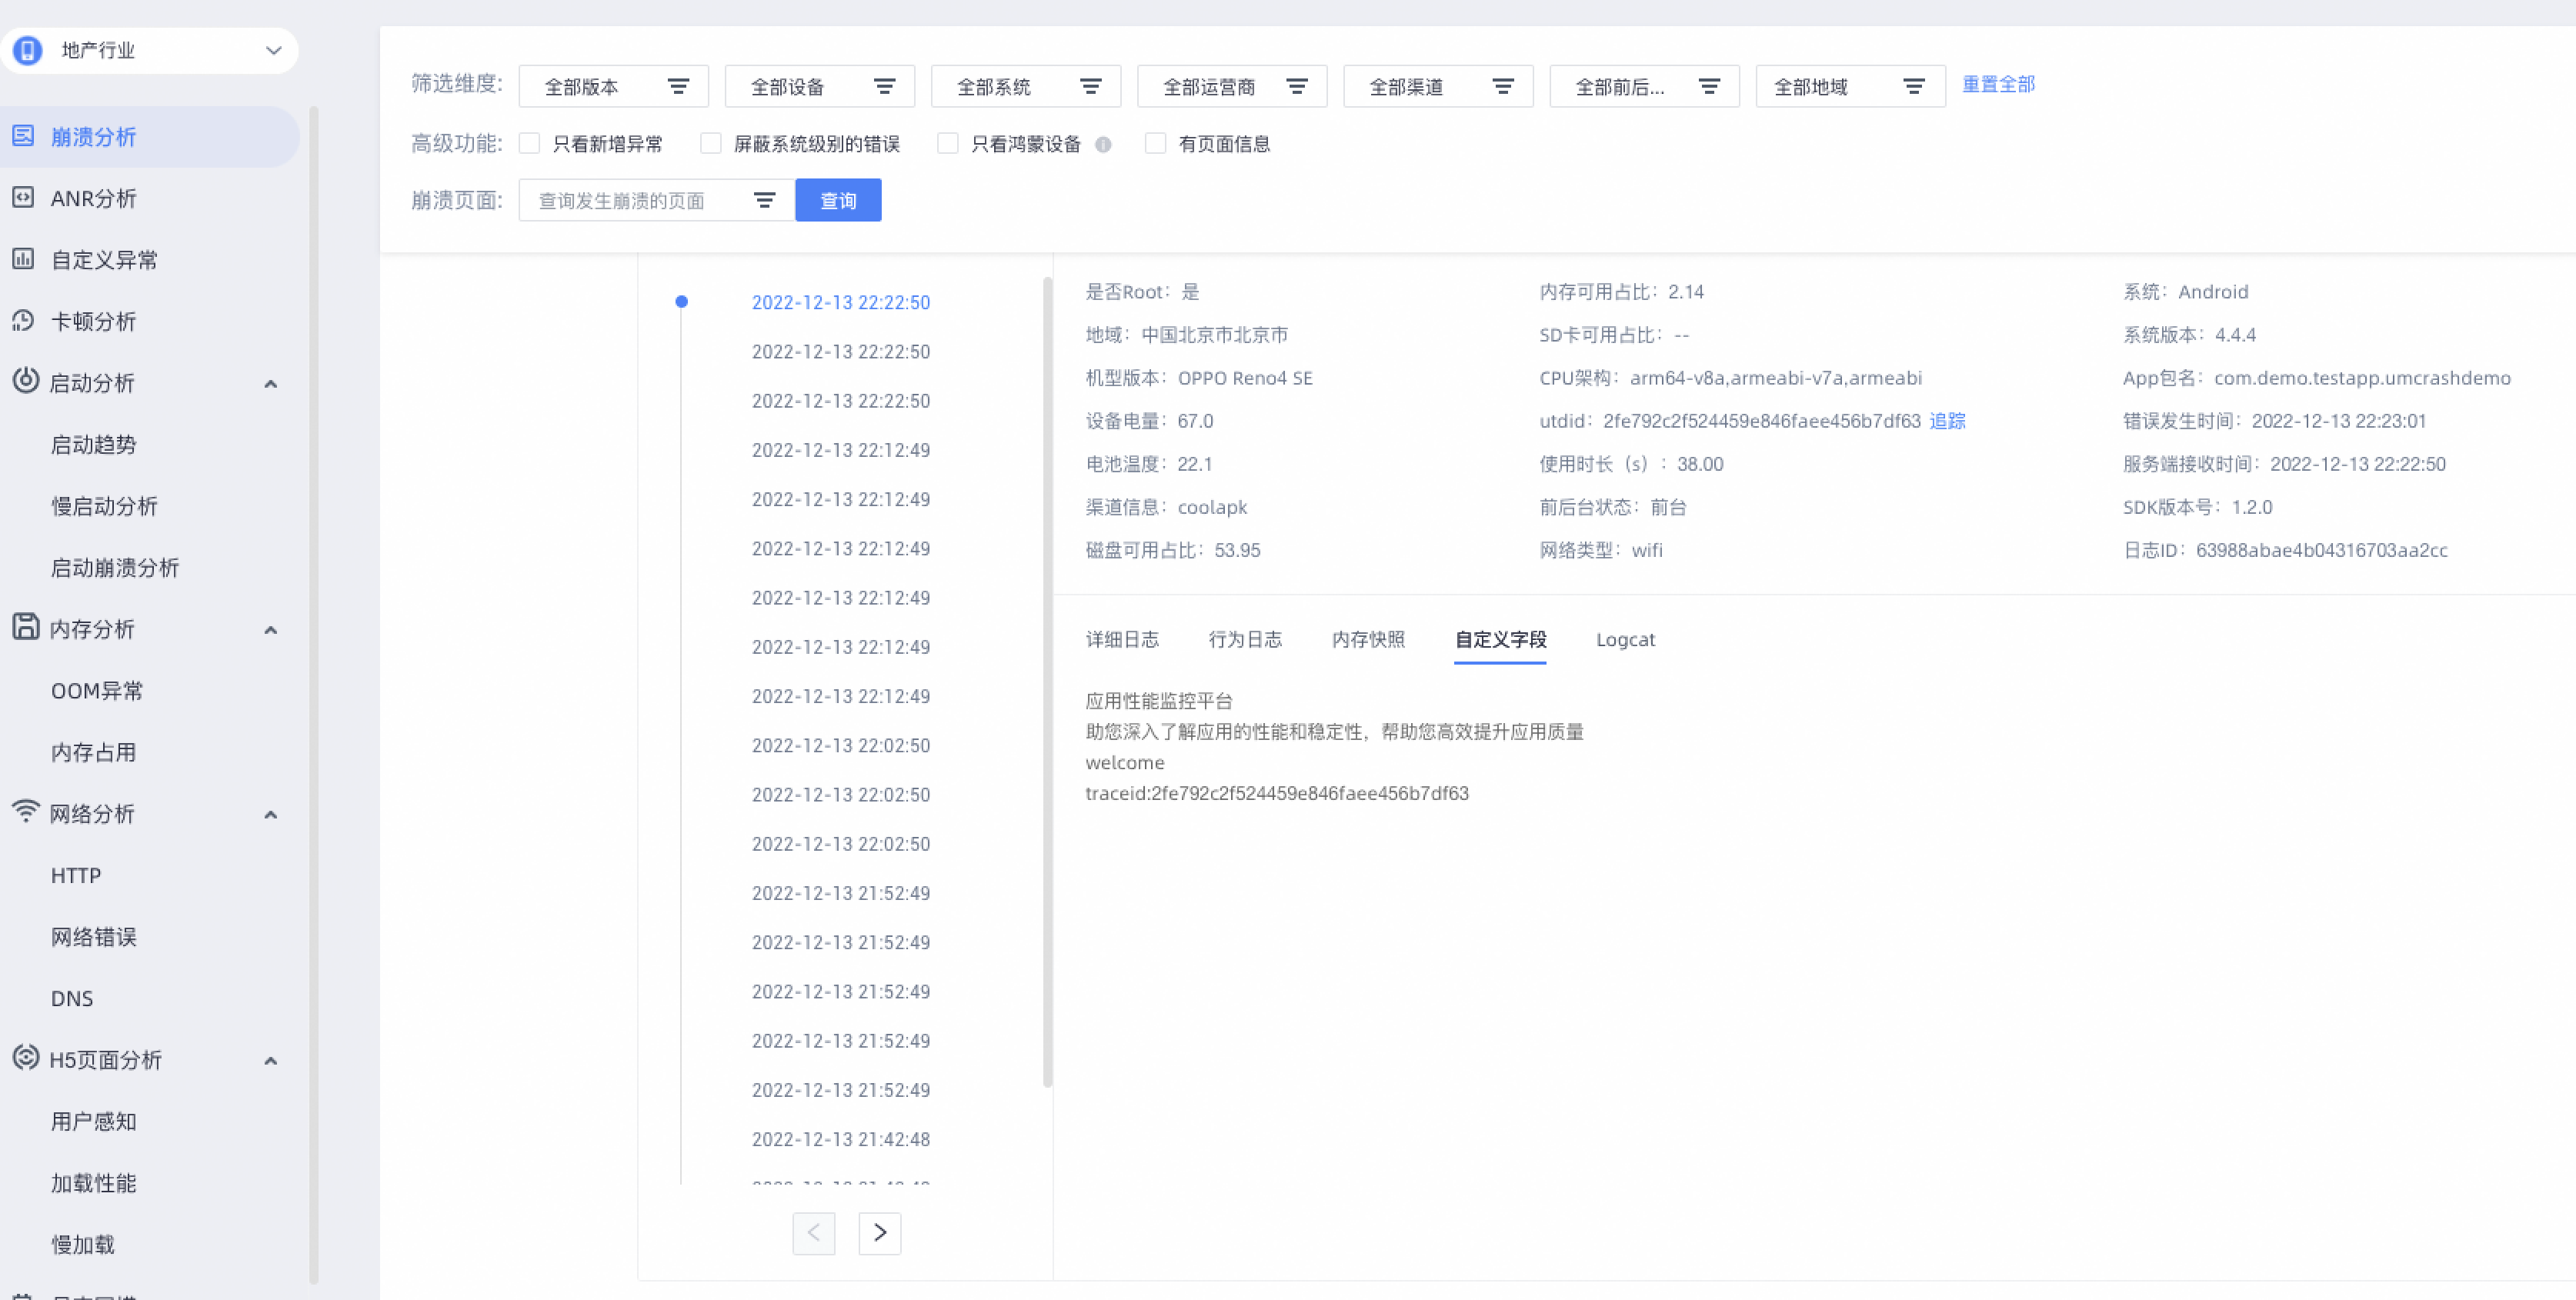
After upload, view the callback data in the management console under Performance Monitoring > Crash Analytics > Error Details > Custom Fields.
1.2 Custom Exceptions
If you catch errors manually, upload them to the QuickTracking server for analysis using one of these two methods:
Method 1:
public static void UMCrash.generateCustomLog(Throwable e,String type)
Parameter | Description |
e | Faults and Abnormalities |
type | Custom error type |
Example:
try{
 // Code that throws an exception
}  catch(Exception e){
   UMCrash.generateCustomLog(e,"Custom Exception");
}
Method 2:
public static void UMCrash.generateCustomLog(String e,String type)
Parameter | Description |
e | Faults and Anomalies |
type | Custom error type |
Example:
String e ="Custom exception message";
UMCrash.generateCustomLog(e,"Custom Exception");
To view custom exceptions, select Custom Exception in the error list page.
1.3 Lag Collection
Lag collection requires no extra configuration. It is enabled by default. To disable it, see the Toggle and Sampling Configuration document.
By default, Android lag detection triggers when a frame takes more than 2 seconds. To change this threshold, use the API below. Examples follow:
import com.umeng.umefs.UMEfs
...
/** Set the lag threshold using UMEfs.initConfig(Bundle bundle).
 * Pass the key UMEfs.KEY_PA_TIMEOUT_TIME in the bundle.
 * Set its value to your desired lag threshold in milliseconds.
 **/
Bundle bundle = new Bundle();
bundle.putLong(UMEfs.KEY_PA_TIMEOUT_TIME, 2000L);//Set lag threshold to 2000 ms
UMEfs.initConfig(bundle);Set this before SDK initialization. The threshold must be greater than 0 and less than or equal to 4 seconds. If you pass an invalid value (negative or over 4), the SDK defaults to 2 seconds.
1.4 Memory Exception Collection
Memory collection supports Out-of-Memory (OOM) exceptions and memory usage metrics.
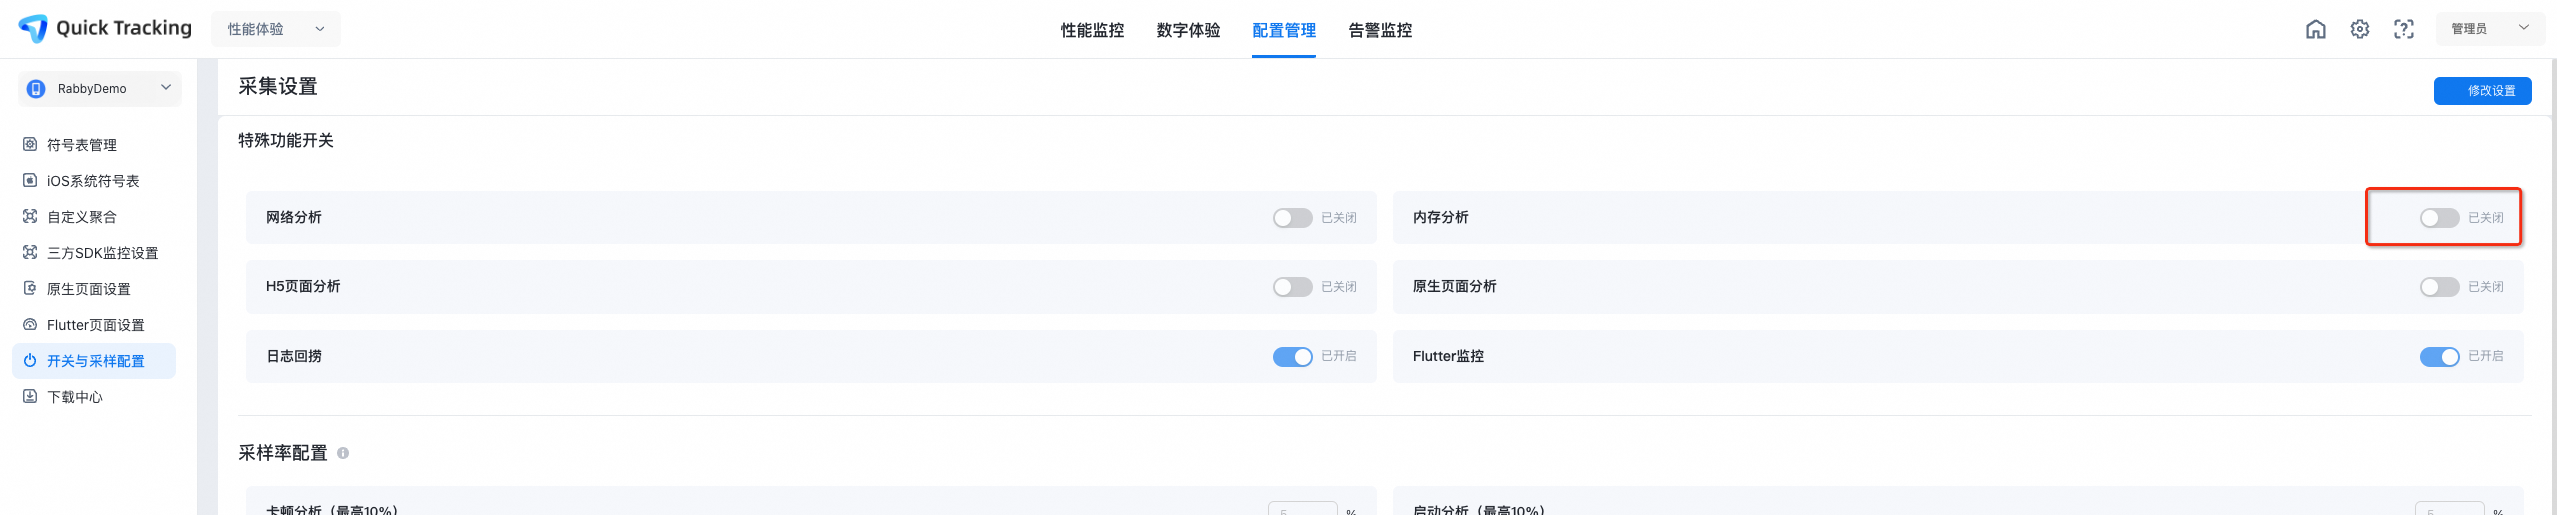
OOM exceptions are part of Crash Analytics. They share the same toggle as crash collection. To disable OOM collection, go to the management console: Performance Experience > Configuration Management > Toggle and Sampling Configuration.
To monitor memory usage, you need to integrate APM SDK 1.6.0.001.210_guomi or a later version. We also recommend that you integrate the latest version of the Statistical Analysis SDK. If you do not want to collect memory usage metrics, you can disable this feature by adjusting the configuration. The following figure shows the details.
1.5 Network Monitoring
This section applies only to manual network monitoring integration.
Network monitoring currently supports only OkHttp requests. You must manually set the eventListenerFactory and NetworkInterceptor.
The minimum supported OkHttp version is 3.11.0.
1.5.1 Integration Method
To integrate network monitoring, manually embed the network monitoring SDK APIs into your project's OkHttp client.
Set the eventListenerFactory and NetworkInterceptor.
When building your OkHttpClient, use OkHttp's eventListenerFactory and addNetworkInterceptor methods to set the listener and interceptor. Example:
OkHttpClient okHttpClient = new OkHttpClient.Builder()
// Set the event listener. OkHttpListener.get() is an SDK API.
.eventListenerFactory(OkHttpListener.get())
// Set the interceptor. new OkHttpInterceptor() is an SDK API.
.addNetworkInterceptor(new OkHttpInterceptor())
.build();
1.5.2 End-to-End Tracing
The following features require integration with APM Crash SDK 2.0.1 or later, and APM EFS SDK 2.1.0 or later.
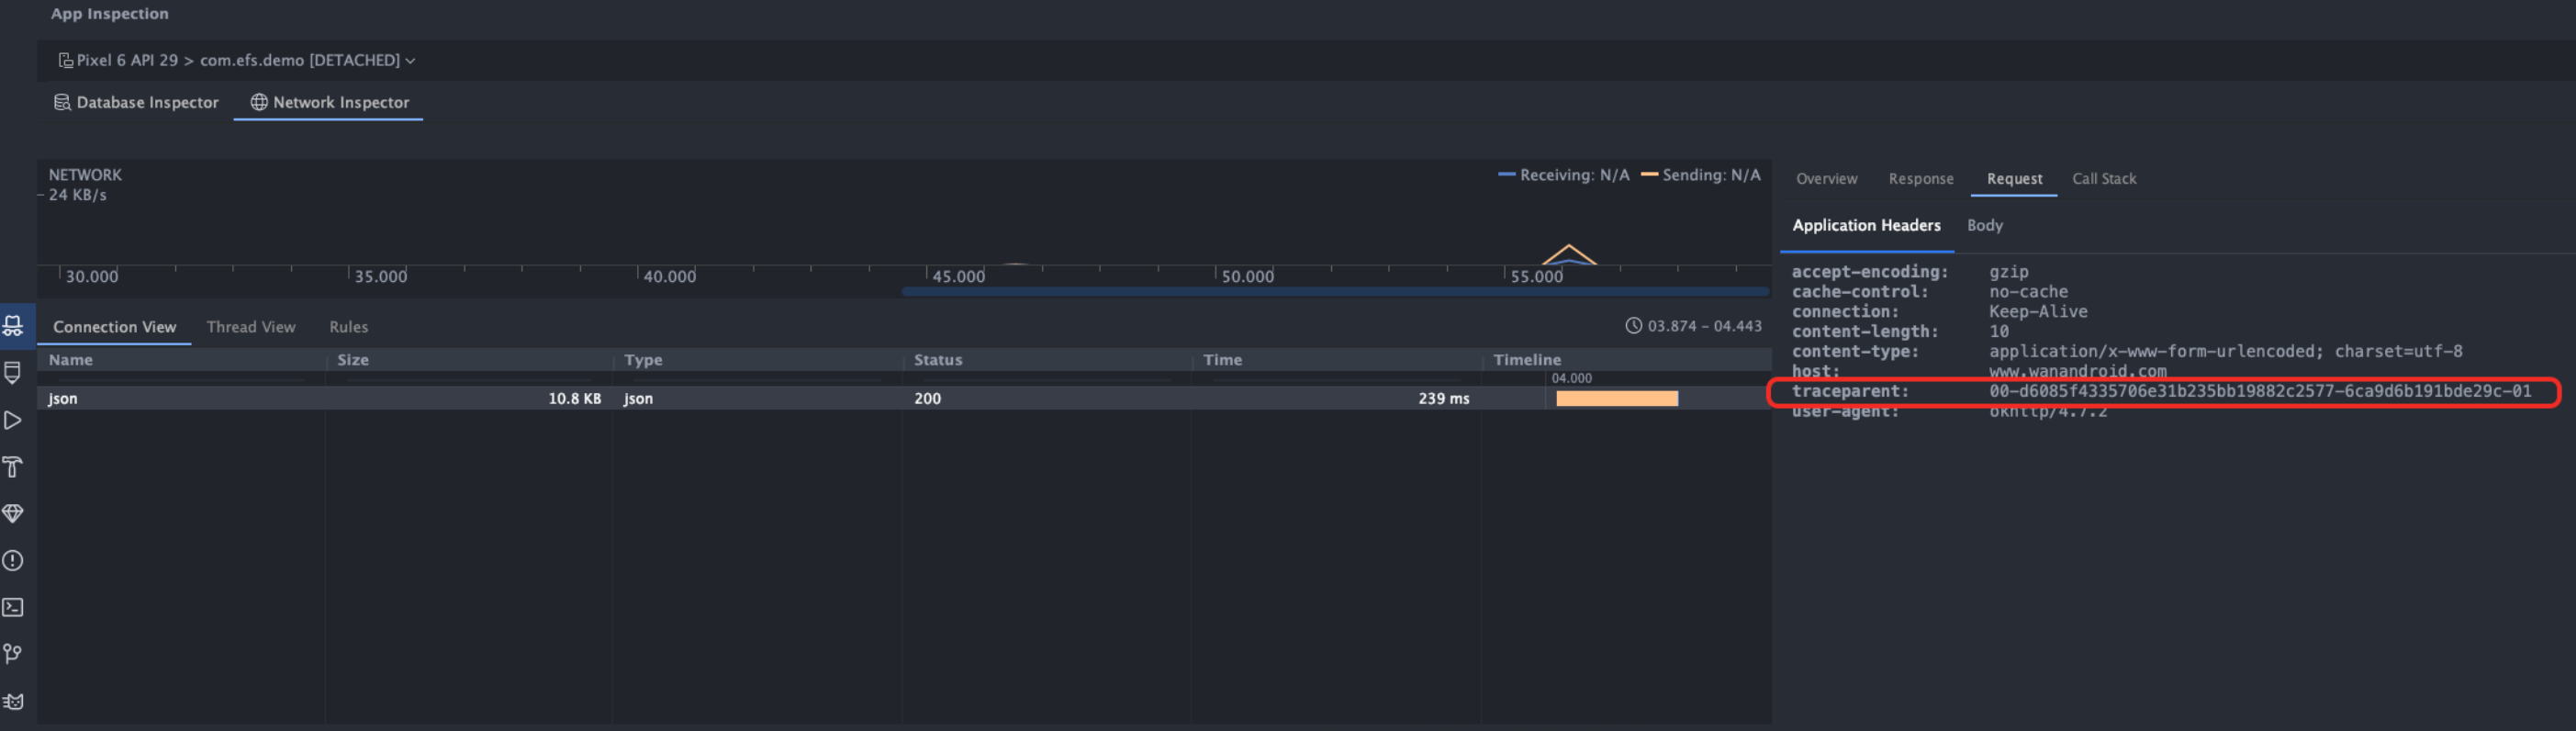
Assume an endpoint https://aliyuque.antfin.com/config. This endpoint uses full end-to-end tracing. It needs specific request headers injected. See the image below:
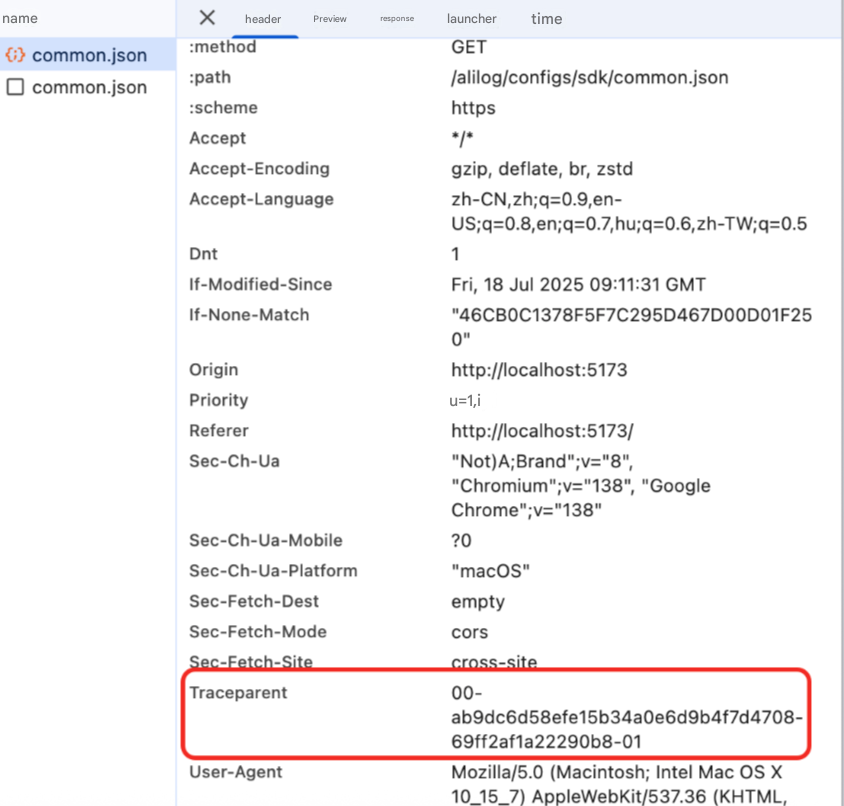
You can use the RUMInterceptor provided by Application Performance Monitoring (APM) to inject requests.
When you build an OkHttpClient, you can set the event interceptor using the addInterceptor method. The following is an example:
import com.efs.sdk.net.inject.RUMNetworkConfig;

OkHttpClient okHttpClient = new OkHttpClient.Builder()
// Set the event listener. OkHttpListener.get() is an SDK API.
.eventListenerFactory(OkHttpListener.get())
// Set the RUM interceptor. new RUMInterceptor() is an SDK API.
.addInterceptor(new RUMInterceptor())
// Set the network interceptor. new OkHttpInterceptor() is an SDK API.
.addNetworkInterceptor(new OkHttpInterceptor())
.build();
To enable this feature, add extra config during initialization.
1.5.2.1 Initial Configuration
Property | Description | Default | Type |
RUMNetworkConfig | Full-trace header injection config | - | object |
Use the code below to configure header injection.
RUMNetworkConfig rumConfig = RUMNetworkConfig.builder()
                .injectTraceHeader(RUMNetworkConfig.W3C_TRACE_HEADER)
                .injectTraceIgnoreUrls(ignoreUrls)
                .injectTraceUrls(injectUrls)
                .build();
1.5.2.2 Configuration Reference
Method | Parameter and Type | Meaning | Default |
RUMNetworkConfig.injectTraceHeader(String s) | Enum values
| The SDK injects the specified trace header into OkHttp requests and auto-generates related protocol fields. | undefined |
RUMNetworkConfig.injectTraceUrls(String[] s) | String[] supports endWith and regex pattern matching | URL allowlist for full-trace injection. Default is null. | null. An empty allowlist means no URLs get headers injected. If set, only matching URLs get headers. |
RUMNetworkConfig.injectTraceIgnoreUrls(String[] s) | String[] supports endWith and regex pattern matching | URL blocklist for full-trace injection. Default is null. | null, which indicates that the blacklist is empty. If you set this value, only request URLs that match the rules are excluded from request header injection. |
APMConfig.enableRumNetwork(boolean s) | boolean | Whether to inject headers into internal SDK requests. Default is false. | false. Internal SDK requests do not get headers injected. |
The injectTraceHeader config tells APM to inject trace headers into monitored network requests and auto-generate related protocol fields. Supported protocols are traceparent, b3, sw8, and sentry-trace. Choose the protocol used by your app.
key | Protocol | Description |
RUMNetworkConfig.W3C_TRACE_HEADER | traceparent | OpenTelemetry trace field (recommended) |
RUMNetworkConfig.SW8_TRACE_HEADER | sw8 | The SkyWalking protocol field |
RUMNetworkConfig.B3_TRACE_HEADER | b3 | Zipkin trace field |
RUMNetworkConfig.SENTRY_TRACE_HEADER | sentry-trace | Sentry trace field |
Initialization supports two modes: Bundle and APMConfig. Full examples:
import com.efs.sdk.net.inject.RUMNetworkConfig;
import com.quick.qt.commonsdk.QtConfigure;
import com.umeng.umefs.APMConfig;
import com.umeng.umefs.UMEfs;


public class MyApplication extends Application {
    ...
    @Override
    public void onCreate() {
        super.onCreate();
        QtConfigure.setCustomDomain("your ingest domain", "your alternative domain name");
        QtConfigure.preInit(this, "your APPKey", "zjh");
        /**
         * Config method 1: Bundle mode
         */
        Bundle bundle = new Bundle();
        ...
        // Configure RUM network tracing
        bundle.putBoolean(UMEfs.KEY_ENABLE_RUM_NETWORK, true); // Enable to activate the following configs. Defaults to W3C trace format.
        bundle.putString(UMEfs.KEY_RUM_TRACE_HEADER, RUMNetworkConfig.W3C_TRACE_HEADER); // Trace protocol type
        String[] injectUrls = new String[]{"/v1/trace", "/v1/trace/report"}; // APIs to inject. Supports endWith and regex.
        String[] ignoreUrls = new String[]{"/v2/trace", "/v2/trace/report"}; // APIs to skip. Supports endWith and regex.
        bundle.putStringArray(UMEfs.KEY_RUM_INJECT_URLS, injectUrls);
        bundle.putStringArray(UMEfs.KEY_RUM_TRACE_IGNORE_URLS, ignoreUrls);
        UMEfs.initConfig(bundle);

        /**
         * Config method 2: RUMNetworkConfig mode
         */
        RUMNetworkConfig rumConfig = RUMNetworkConfig.builder()
                .injectTraceHeader(RUMNetworkConfig.W3C_TRACE_HEADER)
                .injectTraceIgnoreUrls(ignoreUrls)
                .build();

        APMConfig config = APMConfig.builder()
                .enablePaLog(false)
                .enableLaunchLog(false)
                .enableNetLog(true)
                .enableMemLog(false)
                .enableCodeLog(false, "android0813")
                .enableInitSendPV(false)
                .enableFlutterLog(false)
                .enableH5PageLog(false)
                .setPaTimeoutTime(2000)
                .enablePageLog(false)
                .enableRumNetwork(false)
                .setRumNetWorkConfig(rumConfig)
                .build();
        UMEfs.initConfig(config);
      ...
    }
    ...

}
1.5.2.3 Verify Injection
Use App Inspection to check if network requests include injected headers.
1.6 Launch Monitoring
Launch monitoring tracks and reconstructs real user launch experiences. Types:
Launch Type | Launch scenarios | Breakdown | Metrics |
First Launch | First launch after app install | Init time, build time, page load time | From Application.attachBaseContext() to first Activity.onResume() |
Cold Start | App process killed (manually or by system), then relaunched | Init time, build time, page load time | From Application.attachBaseContext() to first Activity.onResume() |
Warm Start | App process alive, then relaunched (e.g., background to foreground, back button then re-enter) | Launch time | If last Activity exists: from Activity.onRestart() to onResume(). If not: from Activity.onCreate() to onResume(). |
1.6.1 Integration Methods
Integration includes manual and automatic (Gradle plugin) methods.
How It Works:
Launch monitoring triggers as shown in the diagram 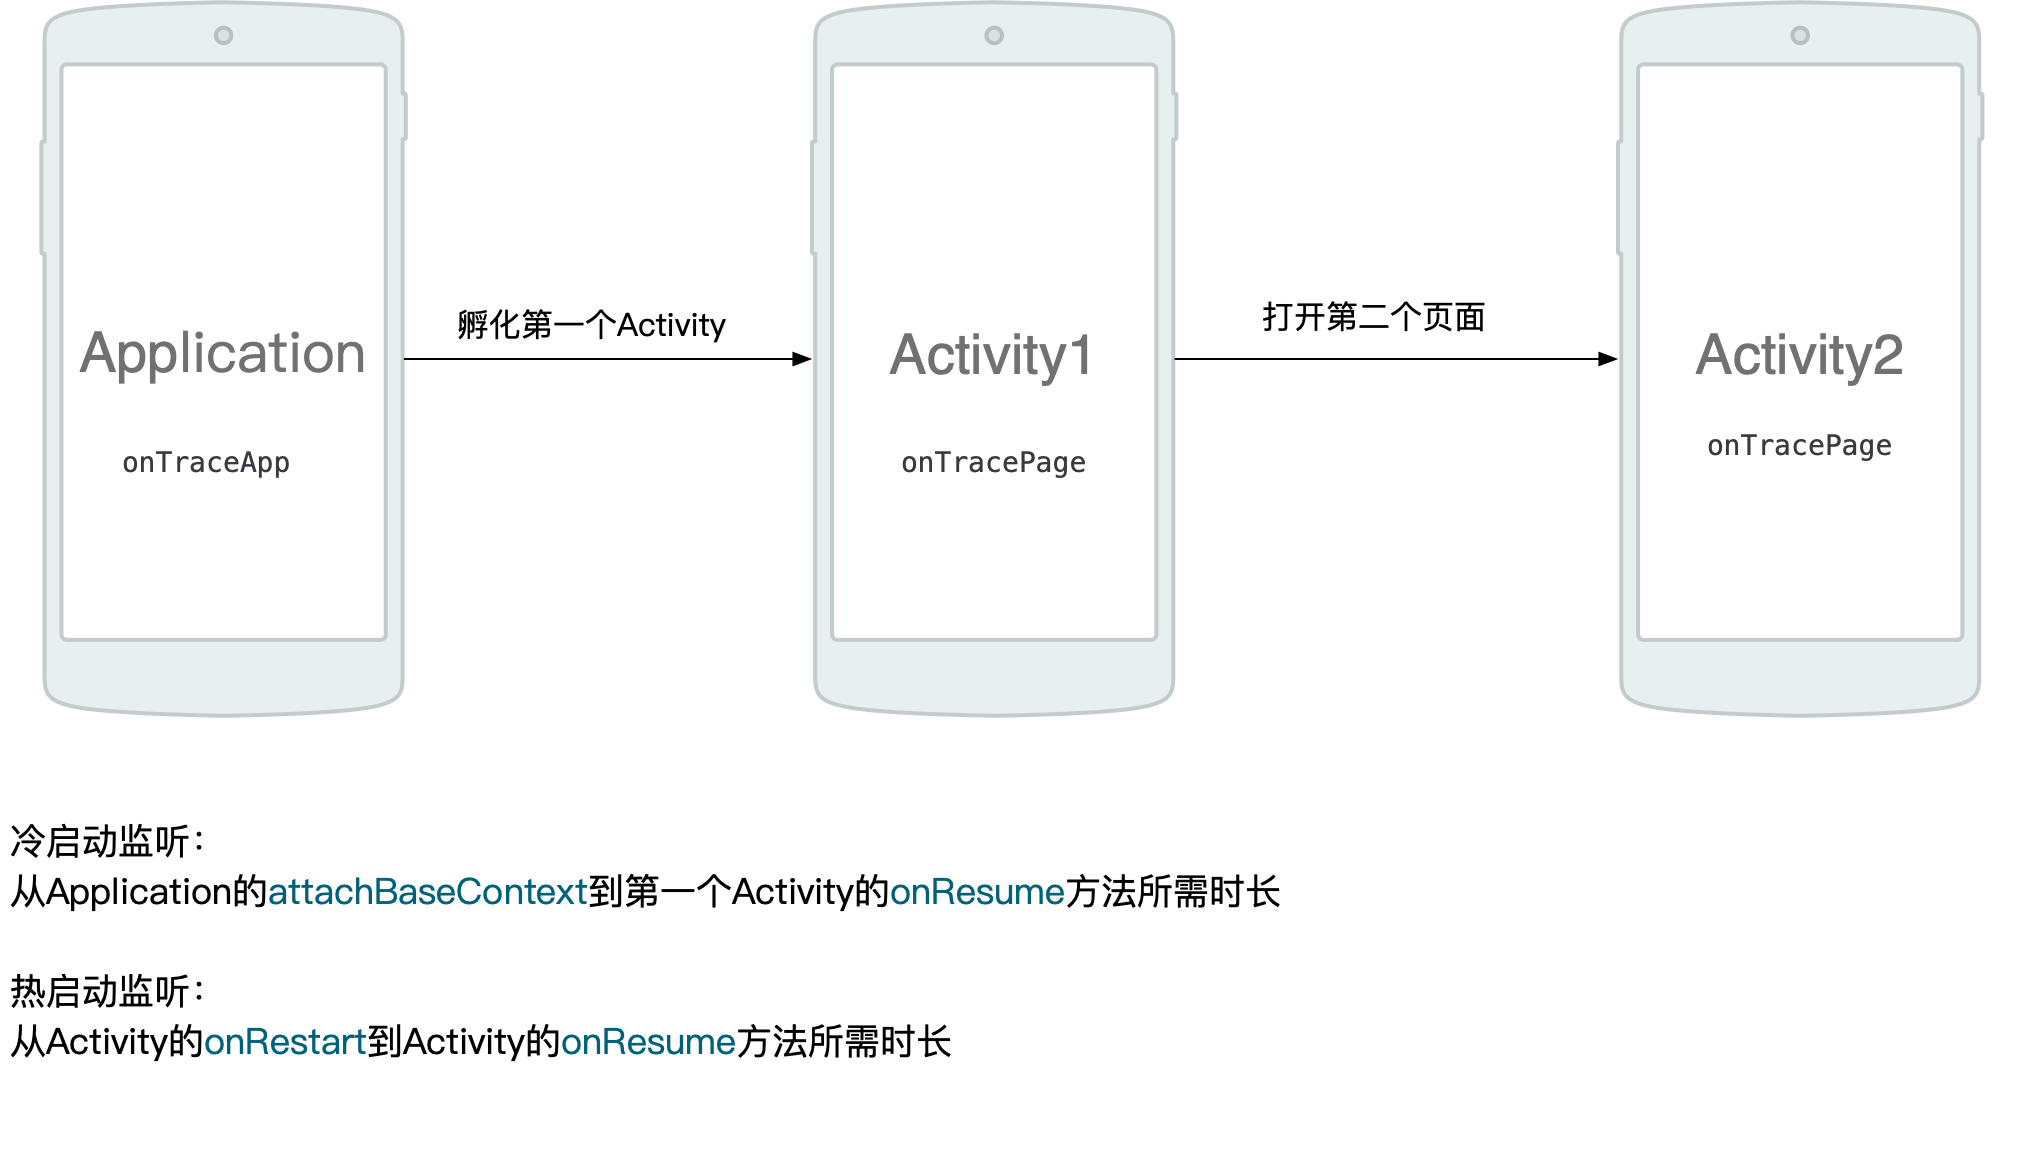
Manual Integration
For manual integration, embed launch monitoring APIs into your project.
How to Use
Add Application lifecycle calls to LaunchManager.onTraceApp(this, "param2", param3); and Activity lifecycle calls to LaunchManager.onTracePage(this, "param2", param3);.
Where:
Parameter | Name | Type | Description |
param1 | context | Context | ApplicationContext or ActivityContext |
param2 | methodName | String | Specify the current parameters. |
param3 | isBegin | boolean | Start Timing |
The following rules apply:
Add Location | Enter parameter 2. | Enter parameter 3. | Timing |
Application | LaunchManager.APP_ATTACH_BASE_CONTEXT | true | At start of Application.attachBaseContext() |
LaunchManager.APP_ATTACH_BASE_CONTEXT | false | At end of Application.attachBaseContext() | |
LaunchManager.APP_ON_CREATE | false | At end of Application.onCreate() | |
Activity | LaunchManager.PAGE_ON_CREATE | true | At start of Activity.onCreate() |
LaunchManager.PAGE_ON_RE_START | true | At start of Activity.onRestart() | |
LaunchManager.PAGE_ON_START | true | At start of Activity.onStart() | |
LaunchManager.PAGE_ON_RESUME | false | At end of Activity.onResume() | |
LaunchManager.PAGE_ON_STOP | true | At start of Activity.onStop() |
Code example:
import com.efs.sdk.launch.LaunchManager
...

// In Application
public class TestApplication extends Application {
    @Override
    protected void attachBaseContext(Context base) {
        LaunchManager.onTraceApp(this, LaunchManager.APP_ATTACH_BASE_CONTEXT, true);
        super.attachBaseContext(base);
        ...
        LaunchManager.onTraceApp(this, LaunchManager.APP_ATTACH_BASE_CONTEXT, false);
    }

    @Override
    public void onCreate() {
        super.onCreate();
        ...
        LaunchManager.onTraceApp(this, LaunchManager.APP_ON_CREATE, false);
    }
}

// In Activity
public class TestActivity extends Activity {
    @Override
    protected void onCreate(@Nullable Bundle savedInstanceState) {
        super.onCreate(savedInstanceState);
        ...
        LaunchManager.onTracePage(this, LaunchManager.PAGE_ON_CREATE, true);
    }

    @Override
    protected void onRestart() {
        LaunchManager.onTracePage(this, LaunchManager.PAGE_ON_RE_START, true);
        super.onRestart();
    }

    @Override
    protected void onStart() {
        LaunchManager.onTracePage(this, LaunchManager.PAGE_ON_START, true);
        super.onStart();
        ...
    }

    @Override
    protected void onResume() {
        super.onResume();
        ...
        LaunchManager.onTracePage(this, LaunchManager.PAGE_ON_RESUME, false);
    }

    @Override
    protected void onStop() {
        LaunchManager.onTracePage(this, LaunchManager.PAGE_ON_STOP, true);
        super.onStop();
    }
}
Automatic Integration
You can also use the APM Gradle plugin to auto-instrument launch monitoring.
Dependency plugins
Open your project root build.gradle. Add this to dependencies:
classpath "com.lydaas.qtsdk:apm-plugin:2.0.1"Note: Ensure you added the Maven URL in your project root build.gradle.
Example:
buildscript {
  repositories {
    // Configure Alibaba Cloud Maven mirror
    maven { setUrl("https://maven.aliyun.com/repository/central") }
    google()
    jcenter()
  }

  dependencies {
      // Add APM performance analysis plugin
      classpath 'com.lydaas.qtsdk:apm-plugin:2.0.1'
  }
}

...

allprojects {
  repositories {
    // Configure Alibaba Cloud Maven mirror
    maven { setUrl("https://maven.aliyun.com/repository/central") }
    google()
    jcenter()
  }
}
Configure the Plugin
Open your app's build.gradle. Add the plugin at the top:
apply plugin: 'com.efs.sdk.plugin'Add plugin config:
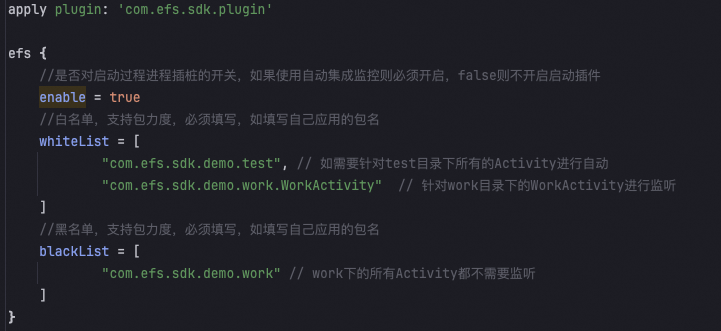
efs {
    // Enable launch instrumentation. Must be true for auto-monitoring. False disables it.
    enable = true
    // Whitelist. Required. Supports package-level filtering. Example: your app package name.
    whiteList = [
            "com.efs.sdk.demo.test", // Auto-instrument all Activities in test/
            "com.efs.sdk.demo.work.WorkActivity"  // Instrument WorkActivity in work/
    ]
    // Blacklist. Required. Supports package-level filtering. Example: your app package name.
    blackList = [
            "com.efs.sdk.demo.work" // Skip all Activities in work/
    ]
}Note: Whitelist priority is higher than blacklist. If a whitelisted Activity is in a blacklisted package, it still gets instrumented.
Full example:
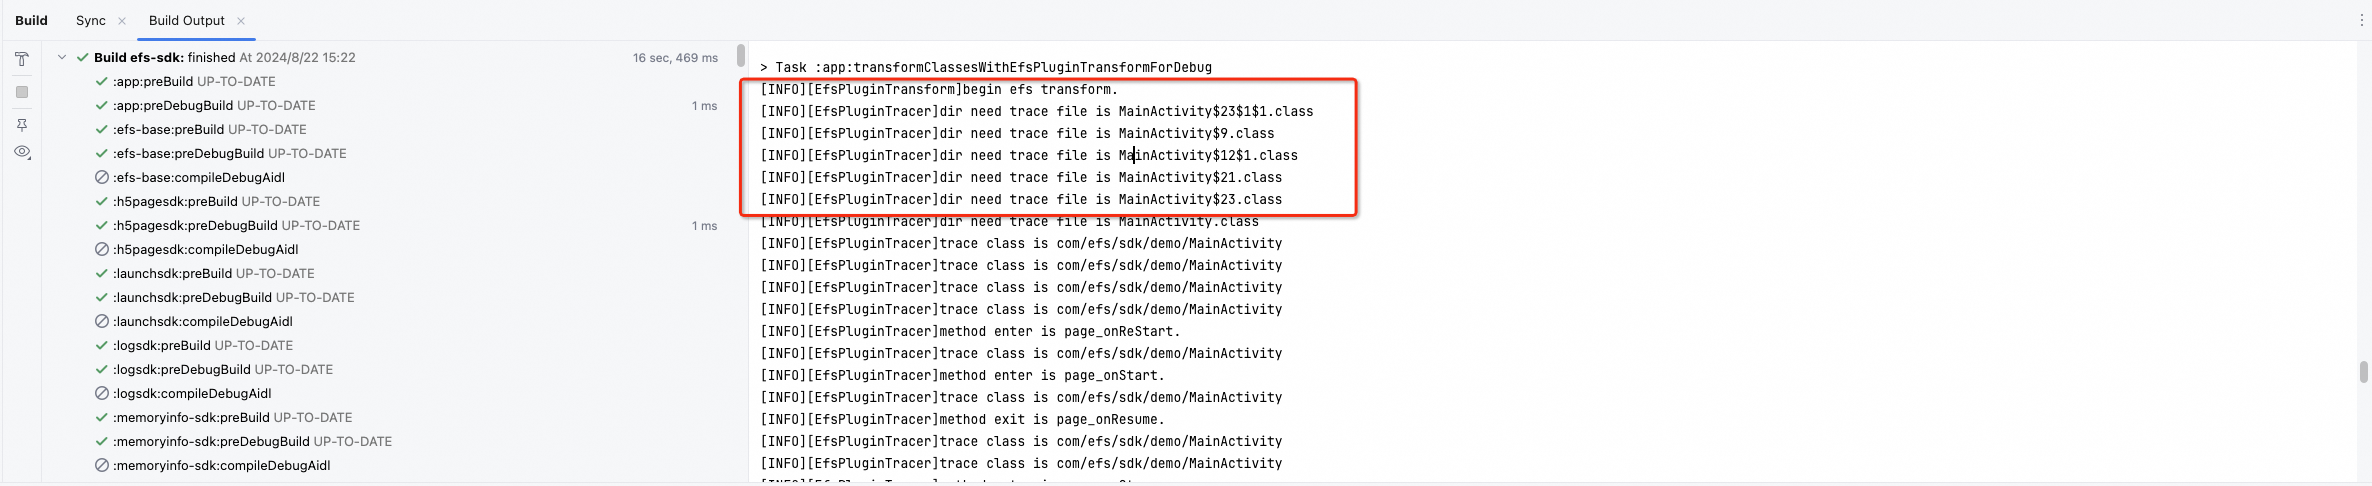
Verify plugin integration:
During build, search logs for EfsPluginTracer. If you see these lines, integration succeeded:
[INFO][EfsPluginTransform]begin efs transform.
[INFO][EfsPluginTracer]dir need trace file is
See image below:
1.6.2 Custom Launch Stage Data
To add custom stages to launch monitoring—such as initializing business data (initData) or UI components (initView)—use the custom launch stage API.
1. Custom stages support cold starts only. Warm starts are not supported.
2. If a custom stage ends after the SDK-defined launch end time (Activity.onResume()), the SDK discards it.
You can report custom launch stages by adding LaunchManager.onTraceBegin before the launch and LaunchManager.onTraceEnd after the launch.
Note: LaunchManager.onTraceBegin and LaunchManager.onTraceEnd must be paired. Unpaired calls get discarded.
Method
Add LaunchManager.onTraceBegin at the start of your custom stage:
Note: Custom stage keys must be no longer than 10 characters.
/**
* Param 1: Context
* Param 2: Custom stage key. Must match onTraceEnd.
* Param 3: Timestamp
*/
LaunchManager.onTraceBegin(context, "custom_key_1", System.currentTimeMillis());
Add LaunchManager.onTraceEnd at the end:
Note: Custom stage keys must be no longer than 10 characters.
/**
* Param 1: Context
* Param 2: Custom stage key. Must match onTraceBegin.
* Param 3: Timestamp
*/
LaunchManager.onTraceEnd(context, "custom_key_1", System.currentTimeMillis());
Code example:
// Track initData() duration during launch
 LaunchManager.onTraceBegin(MainActivity.this, "initData", System.currentTimeMillis());
 initData();
 LaunchManager.onTraceEnd(MainActivity.this, "initData", System.currentTimeMillis());
Verify Results
After launching the app, filter logs for efs.px.api. If you see successful launch data uploads, reporting works.

1.7 APM for In-App H5 Pages
When a webpage with the QuickTracking JS SDK is embedded in your app, the JS SDK data uploads via the app. This feature is disabled by default. To enable it, call the method below before every WebView.loadUrl():
import com.efs.sdk.h5pagesdk.H5Manager
...
// This method requires APM SDK Android 1.6.0.001 or later
H5Manager.enableJavaScriptBridge(webView);
webView.loadUrl("https://www.demo.com");Injecting JavaScript has security risks on API 16 and earlier. Use with caution.
Embedded H5 pages need an app package name whitelist. In bridge scenarios, H5 pages do not need an ingest domain.
For details, see Performance Experience Web SDK Integration.
1.8 Native Pages
1.8.1 Automatic Integration
Native page auto-integration matches launch monitoring auto-integration. Add the plugin dependency as described in the Launch Monitoring > Add Plugin section.
1.8.2 Custom Page Stage Data
To add custom stages to page monitoring—such as initializing business data (initData) or UI components (initView)—use the custom page stage API.
Add this at the start of your custom stage: Note:
1. Custom stage keys must be no longer than 10 characters.
2. Keys must not start with "UM_".
3. Max 6 custom stages per page. Extra stages get filtered.
import com.umeng.pagesdk.PageManger


Add at the start of your custom stage:
/**
* Param 1: Current activity
* Param 2: Custom stage key. Must match onTracePageEnd.
*/
PageManger.onTracePageBegin(MainActivity.this, "initView");


Add at the end of your custom stage:
/**
* Param 1: Current activity
* Param 2: Custom stage key. Must match onTracePageBegin.
*/
PageManger.onTracePageEnd(MainActivity.this, "initView");
Code example:
import com.umeng.pagesdk.PageManger

public class TestActivity extends Activity {
    ...
    @Override
    protected void onCreate(@Nullable Bundle savedInstanceState) {
        super.onCreate(savedInstanceState);
        // Track initView() duration during page load
        PageManger.onTracePageBegin(MainActivity.this, "initView");
        initView(); // Business logic
        PageManger.onTracePageEnd(MainActivity.this, "initView");
    }

    ...
}
2. Advanced Features
2.1 Collection Toggles
Note: The toggles and sample rate that you configure in the Management Platform Toggle and Sampling Configuration section take precedence over those configured in the SDK, and the SDK checks for updates to toggles and sampling configuration every 8 hours.
Use these toggles to control which APM modules collect data. If you need all features, leave toggles off. To disable a module, use the Bundle keys below.
Call this API before initializing the SDK.
import com.umeng.umcrash.UMCrash
import com.umeng.umefs.UMEfs
...

/**
* Control APM modules by setting Bundle keys to boolean values.
*/
UMCrash.initConfig(Bundle args)
 // Controls UMCrash.KEY_ENABLE_CRASH_JAVA
 // UMCrash.KEY_ENABLE_CRASH_NATIVE
 // UMCrash.KEY_ENABLE_ANR
UMEfs.initConfig(Bundle args)
 // Controls UMEfs.KEY_ENABLE_PA
 // UMEfs.KEY_ENABLE_LAUNCH
 // UMEfs.KEY_ENABLE_MEM
 // UMEfs.KEY_ENABLE_NET
 // UMEfs.KEY_ENABLE_H5PAGE
 // UMEfs.KEY_ENABLE_PAGE
Bundle control overview:
Key | Description | Switch Level |
UMCrash.KEY_ENABLE_CRASH_JAVA | Disable Java crash capture. Default true. Set false to disable. | Secondary |
UMCrash.KEY_ENABLE_CRASH_NATIVE | Disable native crash capture. Default true. Set false to disable. | Secondary |
UMCrash.KEY_ENABLE_ANR | Disable ANR capture. Default true. Set false to disable. | Primary |
UMEfs.KEY_ENABLE_PA | Disable lag capture. Default true. Set false to disable. | Primary |
UMEfs.KEY_ENABLE_LAUNCH | Disable launch capture. Default true. Set false to disable. | Primary |
UMEfs.KEY_ENABLE_MEM | Disable memory usage capture. Default true. Set false to disable. | Primary |
UMEfs.KEY_ENABLE_NET | Disable network analysis capture. Default true. Set false to disable. | Primary |
UMEfs.KEY_ENABLE_H5PAGE | Disable App-H5 integration. Default true. Set false to disable. | Primary |
UMEfs.KEY_ENABLE_PAGE | Disable page monitoring. Default true. Set false to disable. | Primary |
UMEfs.KEY_ENABLE_CODE_LOG | Disable log retrieval. Default true. Set false to disable. | Primary |
UMEfs.KEY_ENABLE_INIT_SEND_PV | Enable cold-start PV reporting. Default false. Set true to enable. | Primary |
Code example:
 QtConfigure.setLogEnabled(true);
 Bundle bundle = new Bundle();
 bundle.putBoolean(UMCrash.KEY_ENABLE_CRASH_JAVA, true);
 bundle.putBoolean(UMCrash.KEY_ENABLE_CRASH_NATIVE, true);
 bundle.putBoolean(UMCrash.KEY_ENABLE_ANR, false);
 bundle.putBoolean(UMEfs.KEY_ENABLE_PA, false);
 bundle.putBoolean(UMEfs.KEY_ENABLE_LAUNCH, false);
 bundle.putBoolean(UMEfs.KEY_ENABLE_MEM, false);
 bundle.putBoolean(UMEfs.KEY_ENABLE_H5PAGE, false);
 bundle.putBoolean(UMEfs.KEY_ENABLE_CODE_LOG, false);
 bundle.putBoolean(UMEfs.KEY_ENABLE_INIT_SEND_PV, true); // Supported in v2.0.2+
 UMCrash.initConfig(bundle);
 UMEfs.initConfig(bundle)
QtConfigure.init(this,"your appkey","app store name",QtConfigure.DEVICE_TYPE_PHONE, "");1. Launch monitoring starts before SDK init. To fully disable it, turn off the plugin or remove manual API calls.
2. When lag collection is off, the lag module does not initialize. Logs show: enablePaLog is false.
3. When launch collection is off, the launch module does not initialize. Logs show: enableLaunchLog is false.
4. When memory collection is off, the memory module does not initialize. Logs show: enableMemLog is false.
5. When log retrieval is off, the log retrieval module does not initialize. Logs show: enable codeLog is false.
2.2 Symbol Tables
2.2.1 What Is a Symbol Table?
A symbol table maps memory addresses to function names, file names, and line numbers. Its elements look like this:
<start address> <end address> <function> [<filename:line number>]
To quickly and accurately locate the code position where a user app crashes, we use a symbol table to parse and revert the crash stack. So, upload the symbol table before using the APM SDK to revert crashes!
2.2.2 Why Upload a Symbol Table?
To quickly and accurately locate the code position where a user app crashes, use a symbol table to parse and revert the crash stack.
Example:

After parsing:

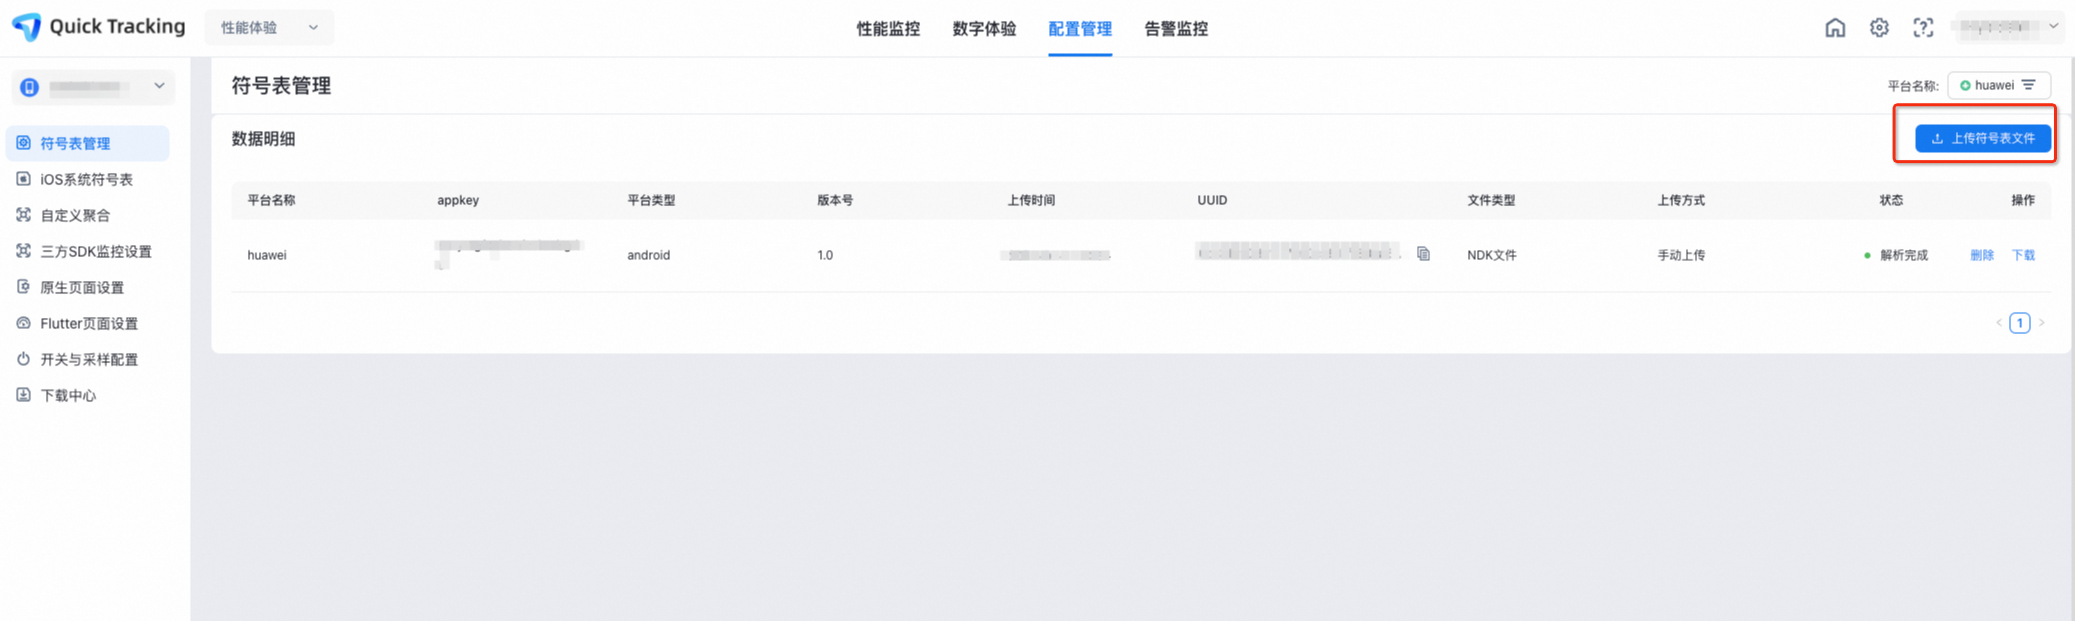
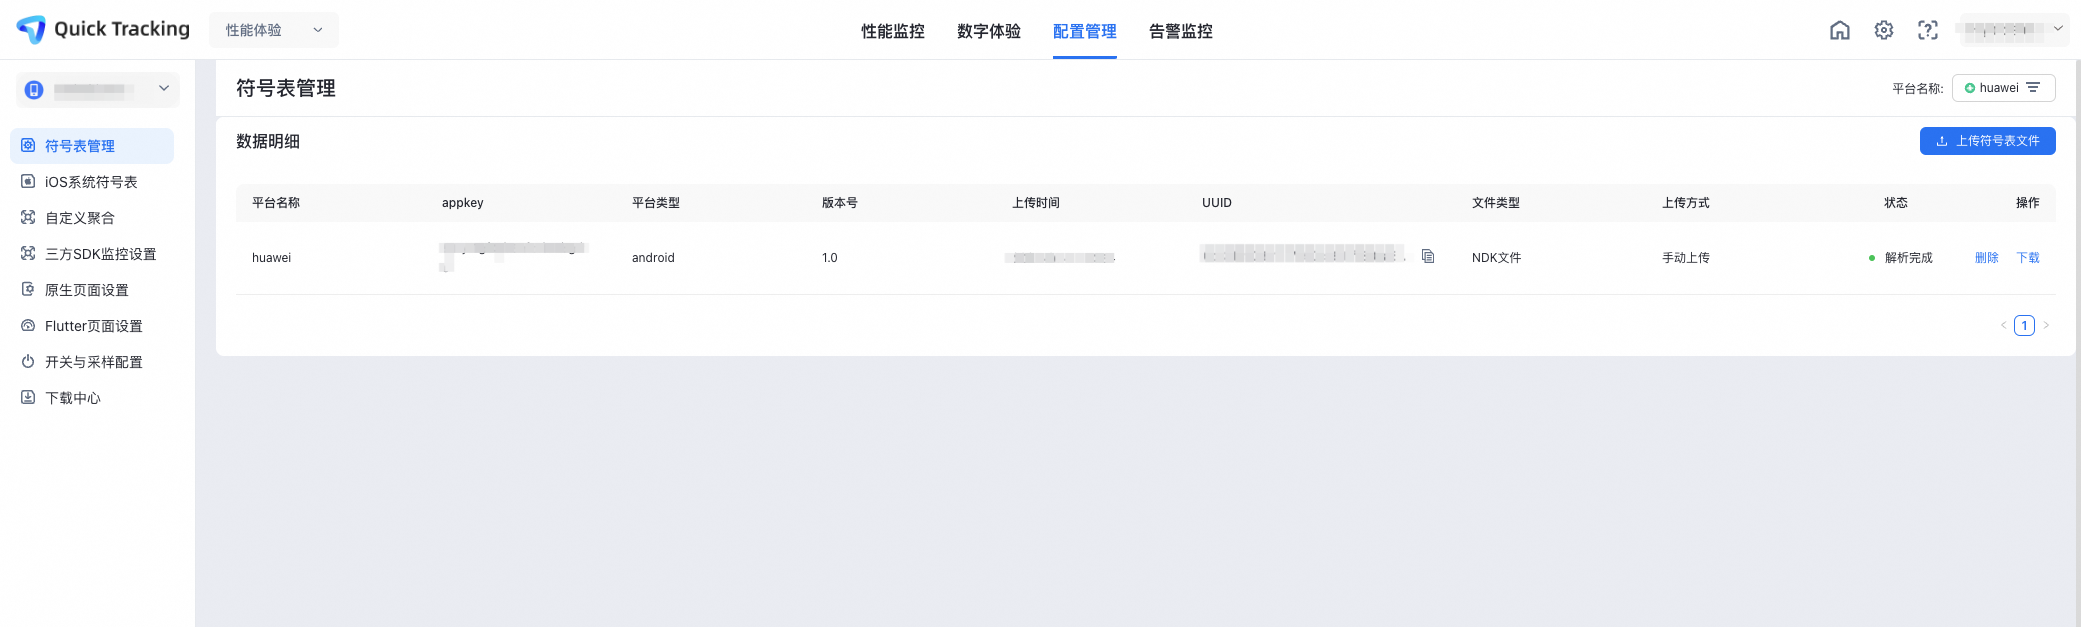
The management console offers manual symbol table upload at Performance Experience > Configuration Management. See image below:
2.2.3 How to Generate Symbol Tables for Android
Java Symbol Tables
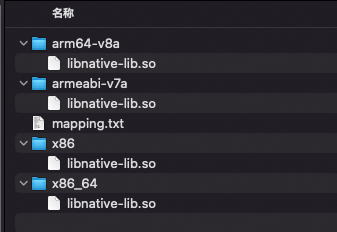
Combine multiple mapping files into one file named mapping.txt. Compress it into a zip file. Include .so files if needed. (See the symbol file example for structure.)
Android .so Libraries
Ensure symbol table .so files match release .so file names. Max size before compression: 400 MB. If one app version has same-named .so files for different CPU architectures, compress them into separate folders. During de-symbolization, use build IDs to link them. Compile with -g to include debug info so crash stacks resolve to line level. Strip debug info before release. Without debug info, resolution stops at function level. Build IDs are required in these cases:
Same-named .so files for different CPU architectures, placed in different paths.
One app version has multiple .so versions using dynamic loading. To generate .so files with build IDs, check compile flags. Ensure --build-id=none is not set. If no build ID, add ld_flags += -Wl,--build-id=sha1. Use the file command to verify build IDs and debug info.
Symbol File Example:
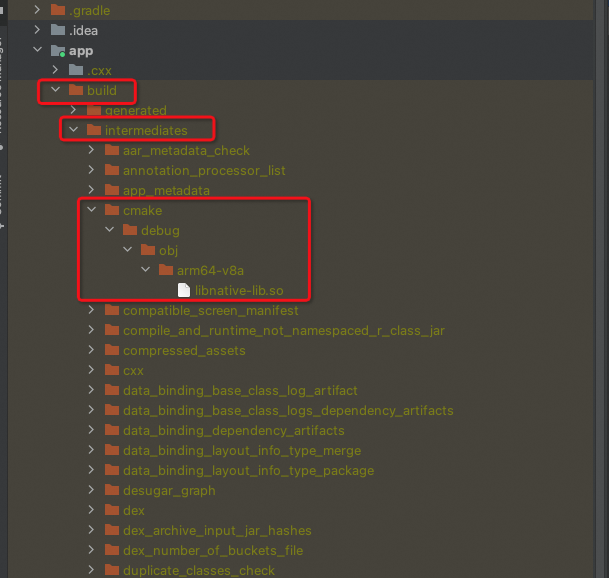
For CMake projects, .so files are at:
<project folder>/<Module>/build/intermediates/cmake/debug/obj/local<architecture>/<so file>
Mapping file location:
<project folder><Module>/build/outputs/mapping/<build-type>/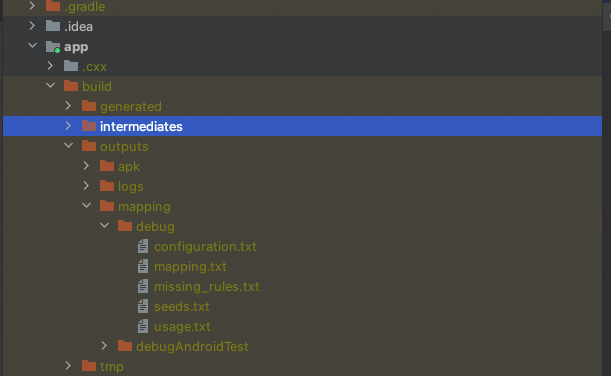
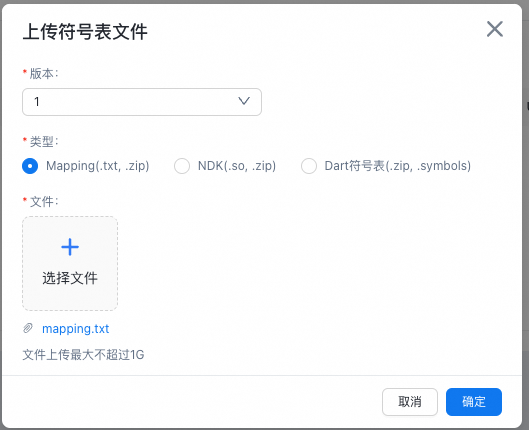
Version Selection
You can pick from existing versions or enter a new one:
If errors already reported to APM, select the version from the dropdown.
For upcoming releases, manually enter the exact version number and click Add Version Number.
2.2.4 Manual Upload
Compress symbol files as described in the symbol file example.
Log in to the console. Go to
Performance Experience > Configuration ManagementClick Symbol Table Management. Click
Upload Symbol Table. Upload the compressed file.View uploaded symbol tables on the Symbol Table Management page.

Supported upload: manual upload via console (max 400 MB).
2.3 HTTP Interface API
Call UMEfs.setRequestProtocol to set the HTTP interface.
 // isHttpsProtocol defaults to true. Set false to send HTTP requests locally.
 UMEfs.setRequestProtocol(boolean isHttpsProtocol);
API notes:
This affects only UAPM performance request sending. UMCrash is not affected.
Set this before SDK initialization.
This controls whether the SDK sends HTTP or HTTPS requests locally. Default is HTTPS. Cloud control can override this setting dynamically.
Domains passed via setCustomDomainEfs automatically drop any HTTP or HTTPS prefix. The final protocol uses the SDK default (HTTPS), setRequestProtocol, or cloud control.
2.4 Log Retrieval
2.4.1 Set Retrieval ID
Set the retrieval ID using this API:
Bundle bundle = new Bundle();
// Set retrieval ID to android0911
bundle.putString(UMEfs.KEY_LOG_USER_ID, "android0911");
UMEfs.initConfig(bundle);Set this before SDK initialization. Cannot change at runtime.
Retrieval ID cannot be empty and must be no longer than 128 characters.
If not set, the SDK uses UMID as the default ID.
Log IDs must not contain underscores (_) or other special characters.
2.4.2 Log Recording
Record logs using this API:
import com.umeng.logsdk.ULog;
...
ULog.v("log tag", "log message");
ULog.d("log tag", "log message");
ULog.i("log tag", "log message");
ULog.w("log tag", "log message");
ULog.e("log tag", "log message");
Note:
Five log levels: v/d/i/w/e.
Param 1 (tag) cannot be empty or longer than 64 characters. Param 2 (message) cannot be empty or longer than 1024 characters.
You must use methods such as ULog.v from the com.umeng.logsdk.ULog class, and you must call them after initializing the SDK. If you use com.umeng.commonsdk.statistics.common.ULog, they will not take effect.
2.4.3 Log Policy
Max persistent log storage: 5 MB. When full, keep only the last 7 days. If those logs fill the limit, stop storing new logs.
Trigger persistent log storage:
2.1. App moves between foreground and background.
2.2. Persistent log storage when the cached data limit is reached.
When a retrieval task loads locally, the SDK matches it with local logs. Matched logs upload. Logs generated during the current session upload on next app start.
2.4.4 Log Troubleshooting
When log retrieval is enabled, this log appears:
enable codeLog is true
When the log task loads correctly, these logs appear:
09-13 14:56:28.988 15994-15994/com.efs.demo I/ULogConfigManager: [log register] begin. 09-13 14:56:29.704 15994-15994/com.efs.demo I/ULogConfigManager: [log register] call back config. 09-13 14:56:29.709 15994-15994/com.efs.demo I/ULogConfigManager: [log register] save did is 9560fe0f75e7c92fff351d537633a91cia 09-13 14:56:29.709 15994-15994/com.efs.demo I/ULogConfigManager: [log register] save uid is android0911 09-13 14:56:29.710 15994-15994/com.efs.demo I/ULogConfigManager: [log register] save task id is 1660130437264, task is {"task_etime":1663257599000,"target_type":0,"task_id":"1660130437264","task_btime":1662307200000,"task_type":0} 09-13 14:56:29.710 15994-15994/com.efs.demo I/ULogConfigManager: [log register] add mem task id is 1660130437264 09-13 14:56:29.710 15994-15994/com.efs.demo I/ULogConfigManager: [log register] save task id is 1660130437265, task is {"task_etime":1663257599000,"target_type":1,"task_id":"1660130437265","task_btime":1662307200000,"task_type":0} 09-13 14:56:29.710 15994-15994/com.efs.demo I/ULogConfigManager: [log register] add mem task id is 1660130437265 09-13 14:56:29.710 15994-15994/com.efs.demo I/ULogConfigManager: [log register] save task id set is 1660130437264_1660130437265
When logs persist (e.g., app moves to background), these logs appear:
09-13 15:06:23.445 15994-16722/com.efs.demo I/efs.base: {"fr":"android","sdk":23,"others_OS":"Android","stime":1663052188738,"dsp_h":1920,"rom":"6.0.1","sdk_ver":"1.3.11.umeng","w_tm":1663052783,"um_access":"wifi","lang":"zh","um_umid_header":"aid03bc207717fd2238c5d8bf93ed4fffb","pkg":"com.efs.demo","type":"codelogperf","dsp_w":1080,"um_network_type":0,"wid":"54d8e67e-0a4e-4e11-9517-08ac993aa670","log_uid":"android0911","pid":15994,"ps":"com.efs.demo","build_model":"MI 4LTE","appid":"ez2cookeijezdgu3nxmci6zt","um_app_carrier":"","ctime":1663052783,"net":"wifi","um_crash_sdk_version":"efs.1.6.0.001.200","um_os":"android","vcode":"1","tzone":"Asia\/Shanghai","um_app_channel":"Umeng","brand":"xiaomi","log_did":"9560fe0f75e7c92fff351d537633a91cia","codelog":{"taskid":"","status":0,"time_start":1663052782368,"time_end":1663052783439,"uid":"android0911","did":"9560fe0f75e7c92fff351d537633a91cia","body":[{"tag":"walle","msg":"button 1 --->>> ","level":0,"time":1663052782367,"process":"com.efs.demo","thread":"main"},{"tag":"walle","msg":"button 1 --->>> ","level":2,"time":1663052782370,"process":"com.efs.demo","thread":"main"}]},"uid":"54d8e67e-0a4e-4e11-9517-08ac993aa670","ver":"1.0","model":"mi-4lte"} 09-13 15:06:23.459 15994-16077/com.efs.demo I/RecordLogCacheProcessor: save file, type is codelogperf 09-13 15:06:23.463 15994-16077/com.efs.demo I/RecordLogCacheProcessor: upload file, name is codelogperf_none_1_1_15994_2442_1663052783458_android0911_9560fe0f75e7c92fff351d537633a91cia_1663052782368_1663052783439
If logs exist in data/data/<your app>/app_UApm/<your appkey>/upload_codelog, saving succeeded.
When logs match and upload successfully, these logs appear:
09-13 15:06:39.255 15994-16077/com.efs.demo I/efs.cache: [-->>] add file is codelogperf_gzip_2_1_15994_3356_1663052783463_android0911_9560fe0f75e7c92fff351d537633a91cia_1663052782368_1663052783439 09-13 15:06:39.262 15994-16141/com.efs.demo I/efs.LogSendAction.Codelog: send data url is http://aplus2-portal-lite.emas-poc.com 09-13 15:06:39.272 15994-16141/com.efs.demo I/efs.px.api: Upload file, url is http://aplus2-portal-lite.emas-poc.com/apm_logs 09-13 15:06:39.478 15994-16141/com.efs.demo I/efs.px.api: upload result : true, resp is HttpResponse {succ=true, code=200, data='{"msg":"success","code":0,"cip":"XXX.XX.XX.XXX","stm":1663052801}', extra={req_url=http://aplus2-portal-lite.emas-poc.com/apm_logs, flow_limit=true, biz_code=0, size=592, type=codelogperf}} 09-13 15:06:39.480 15994-16077/com.efs.demo I/efs.send_log: send success.
3. Local Log Reference
Local logs help troubleshoot SDK integration and feature activation. They do not reflect behavior in the management console.
Enable local logs
Control log output using QtConfigure.setLogEnabled(boolean).
Turn off SDK debug logs before app release. Avoid unnecessary log output.
Log Toggle
Call the method below to enable or disable SDK debug logs. By default, debug logs are off. You must enable them manually.
/**
* Enable component logs
* @param boolean Default false. Set true to view logs.
*/
QtConfigure.setLogEnabled(true);To see logs during initialization, enable the log toggle before calling the init method.
Log Levels
Four log levels for easy viewing:
Error: SDK integration or runtime errors.
Warn: SDK warnings.
Info: SDK notifications.
Debug: SDK debugging info.
Common Scenarios and Log Notes:
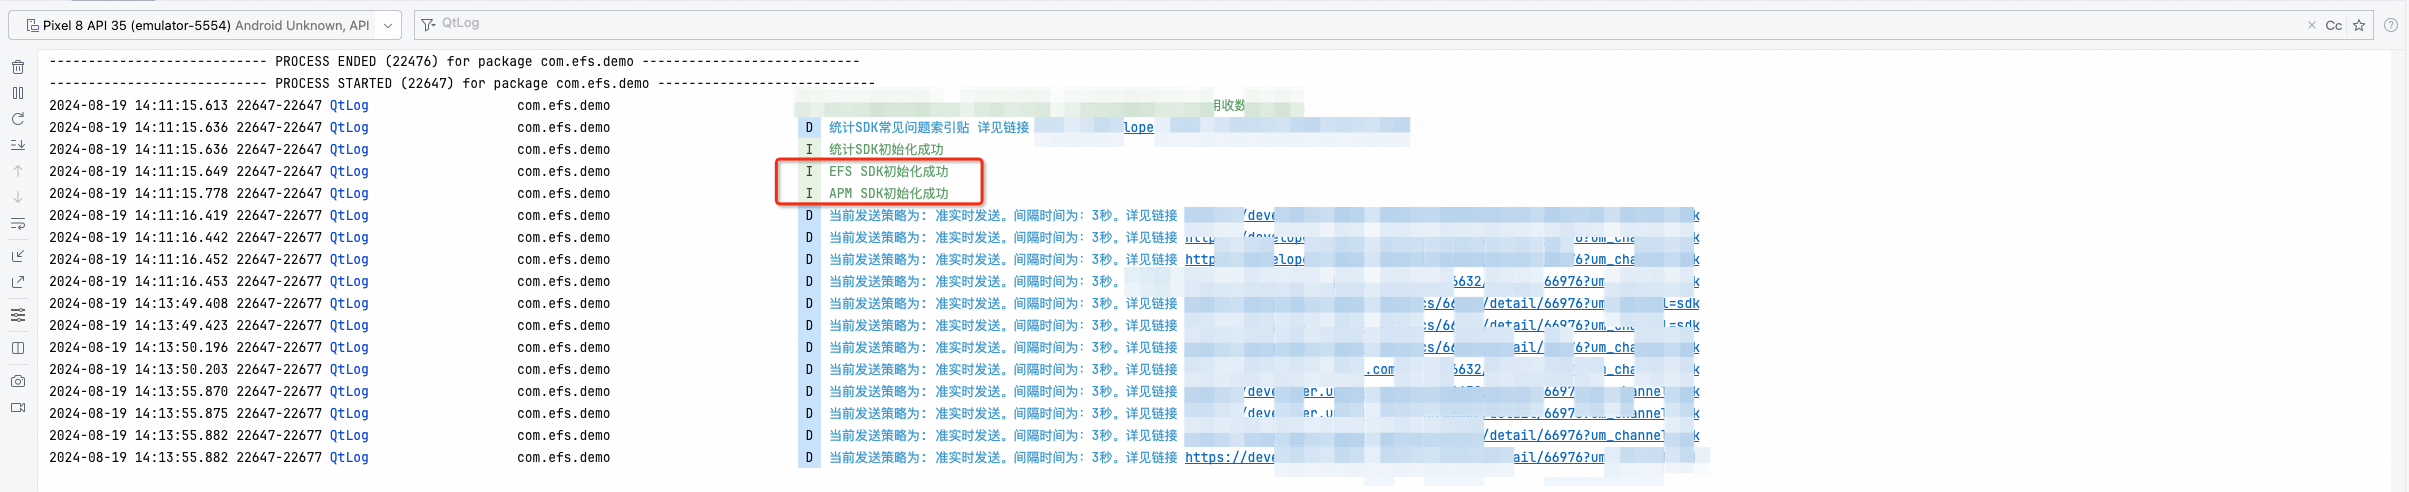
Initialization
After successful init, check for init success logs. Filter for
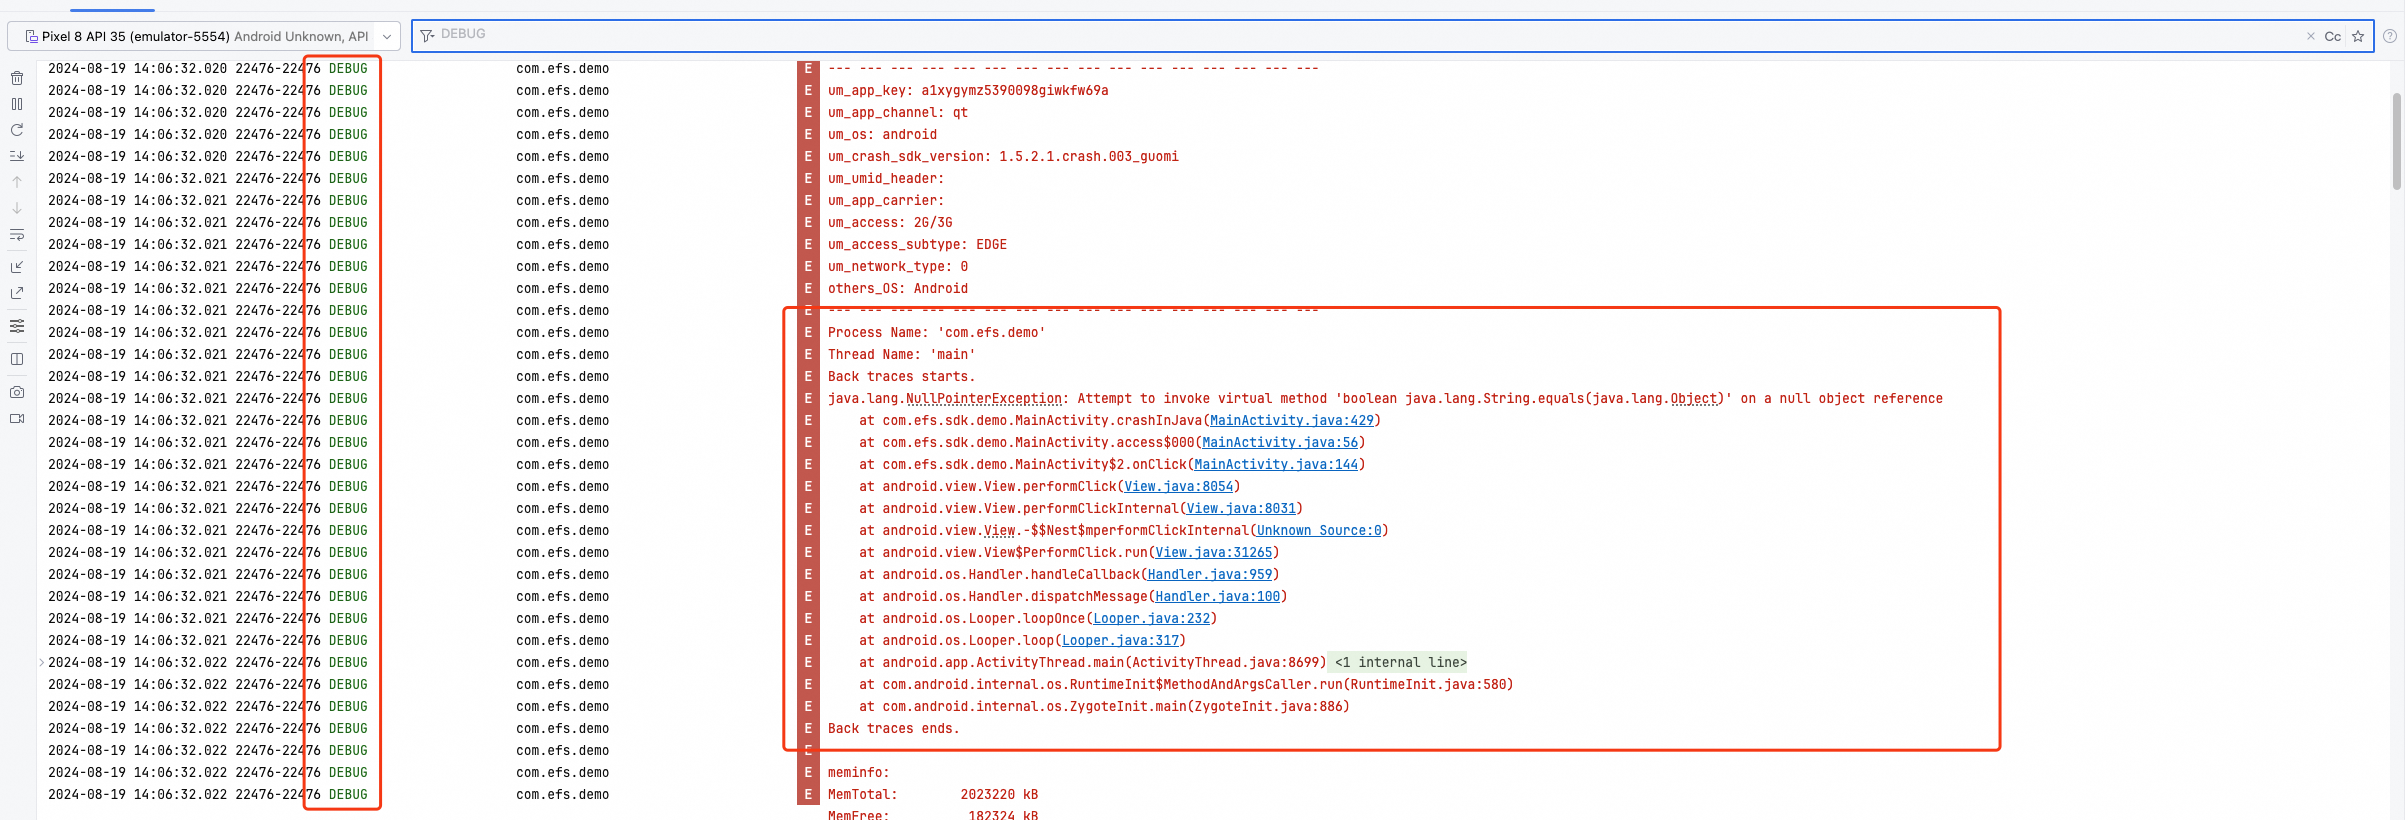
QtLog.Crash Analysis
After simulating a crash, check for captured crash logs. Filter for
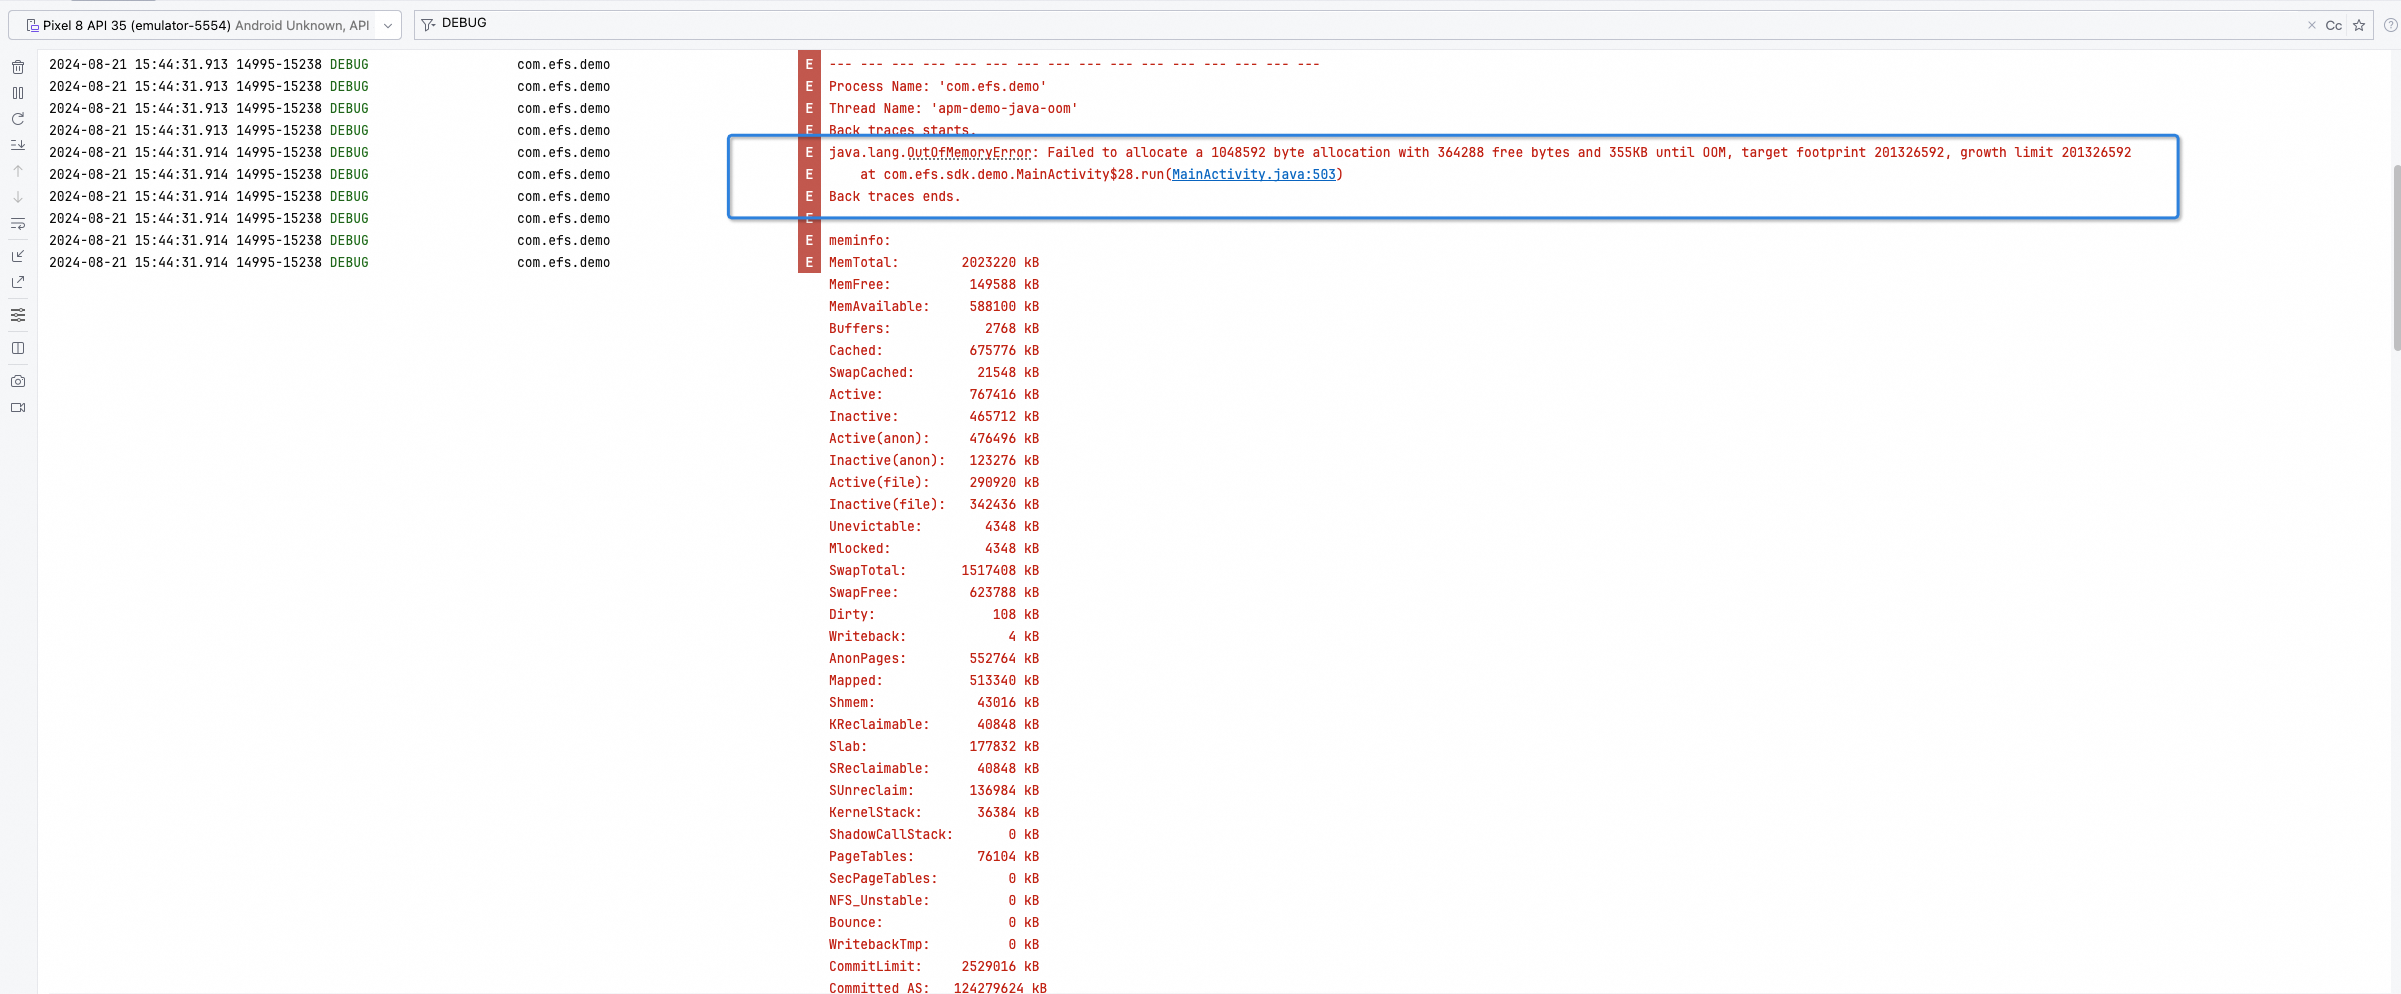
DEBUG.Memory Exception Reporting
After simulating an out-of-memory error, check for captured crash logs. Filter for
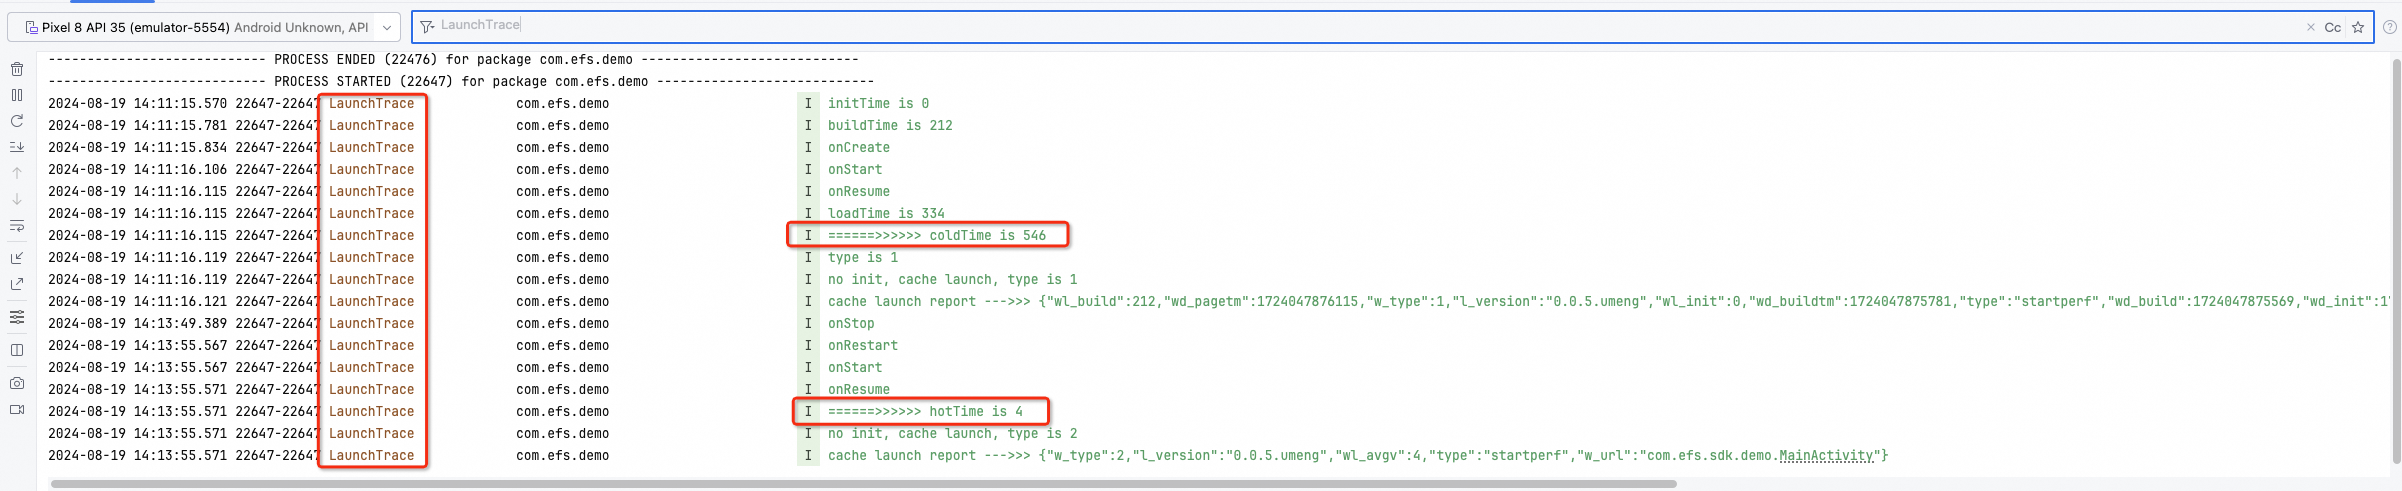
DEBUG.Launch Reporting
After simulating a crash, check for captured crash logs. Filter for
LaunchTrace.NotecoldTime is *** indicates a cold start. hotTime is *** indicates a warm start. Full logs shown above.
Network Analysis Reporting
To troubleshoot network analysis logs, first check if network analysis is enabled. Filter for
inner config.When inner config : net open. and inner config : net rate is 100, network analysis is active.
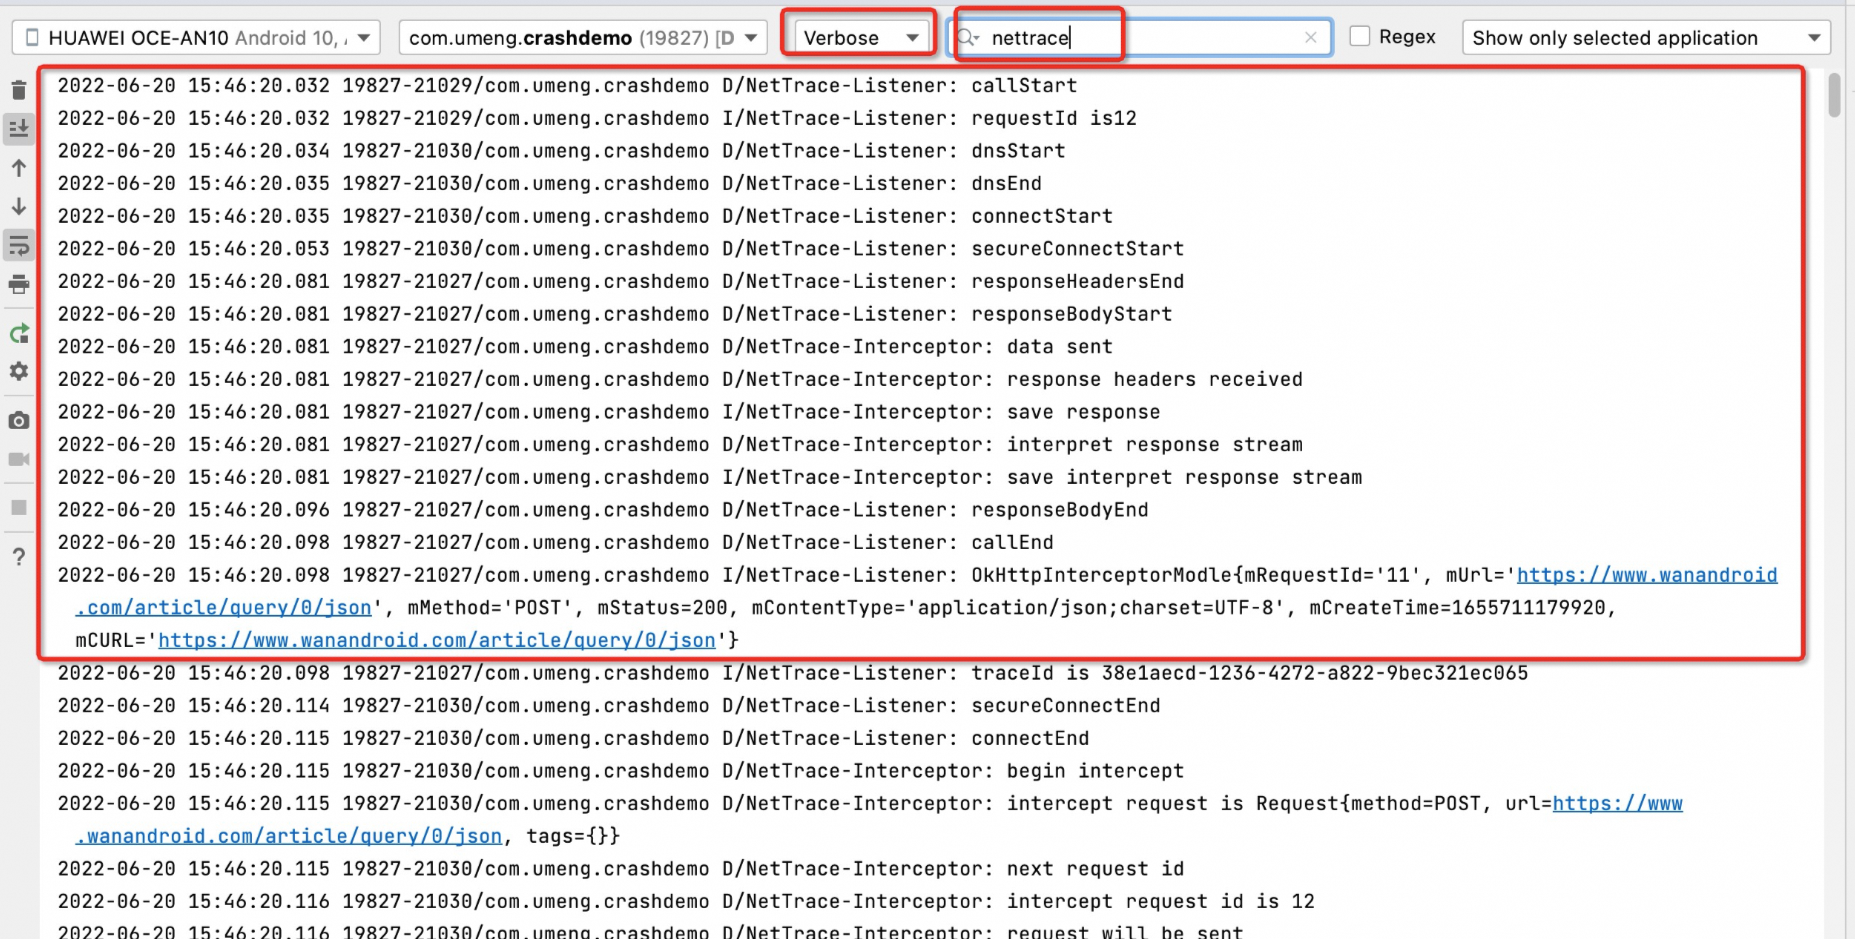
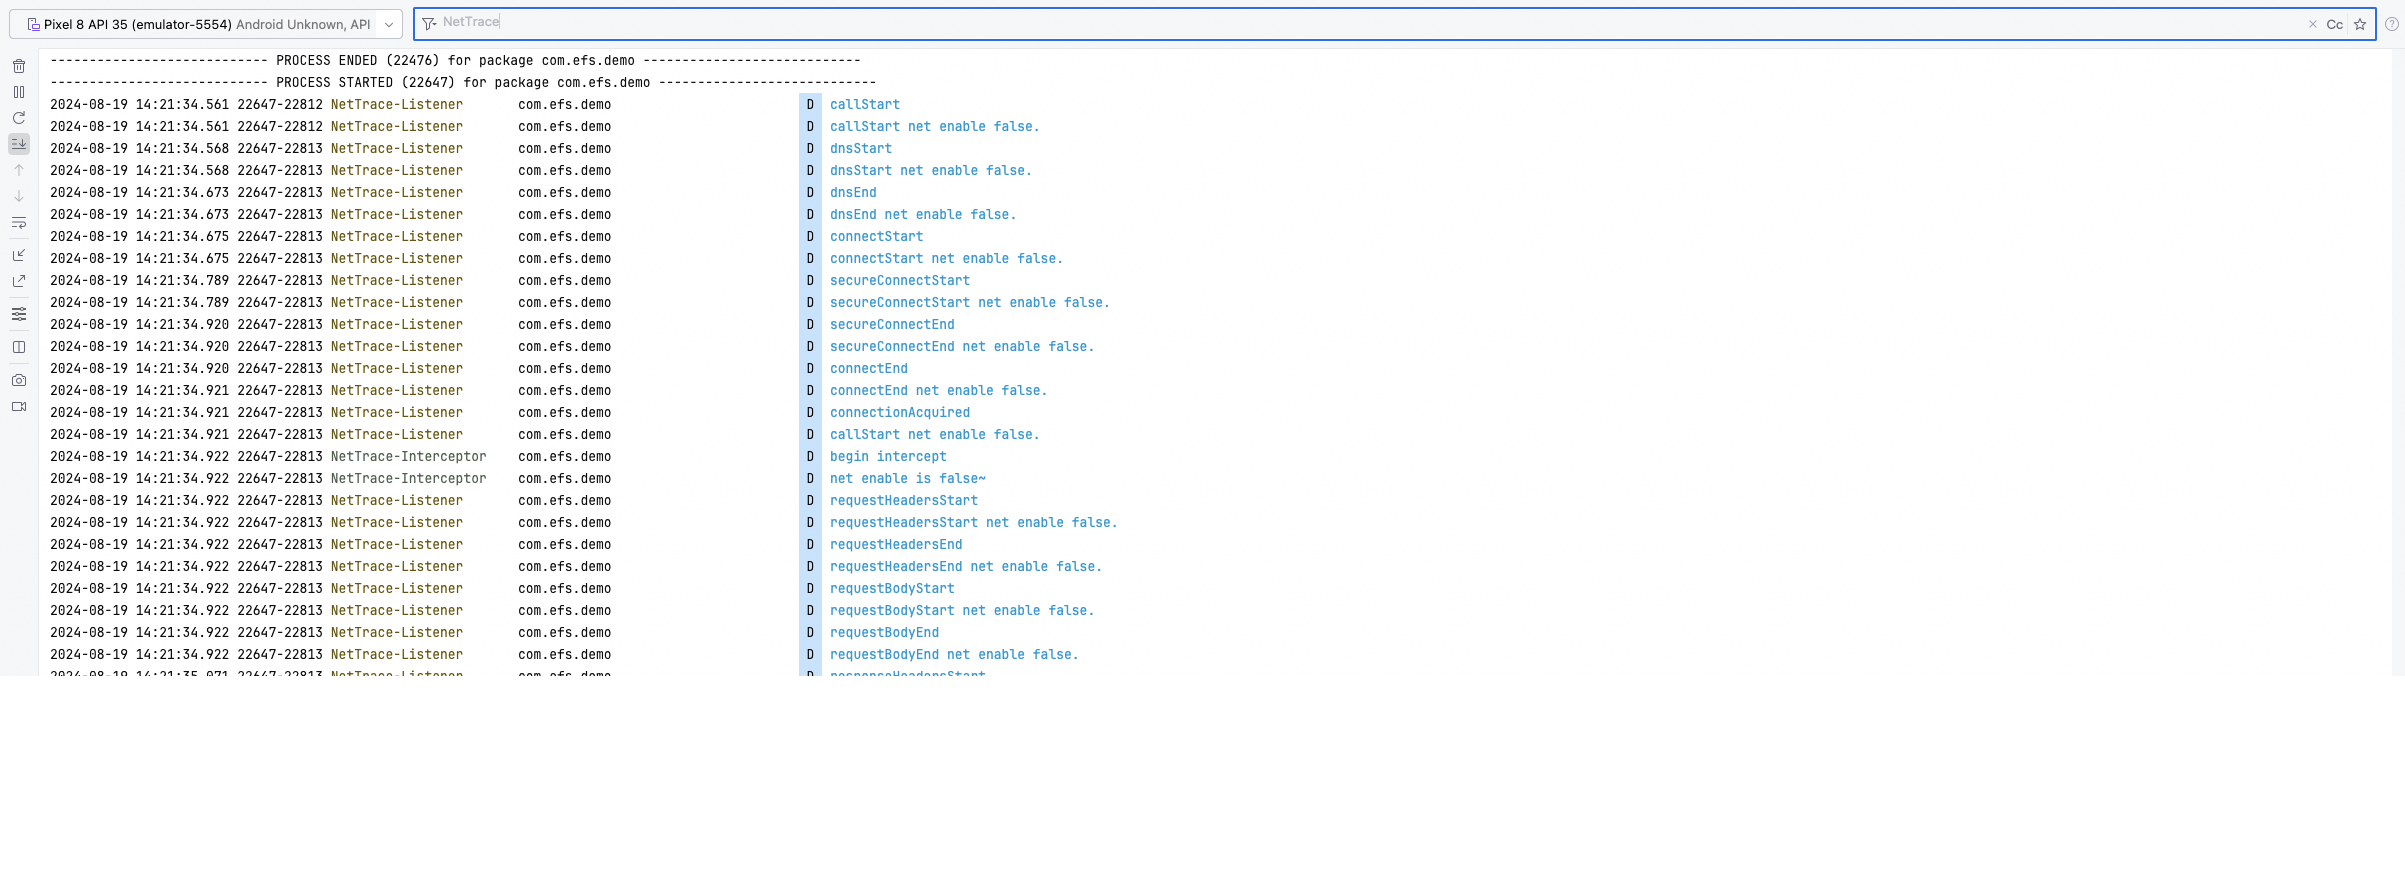
Filter for
NetTraceto check sampling status.When sampling correctly:
Unsampled:
Lag Collection Reporting
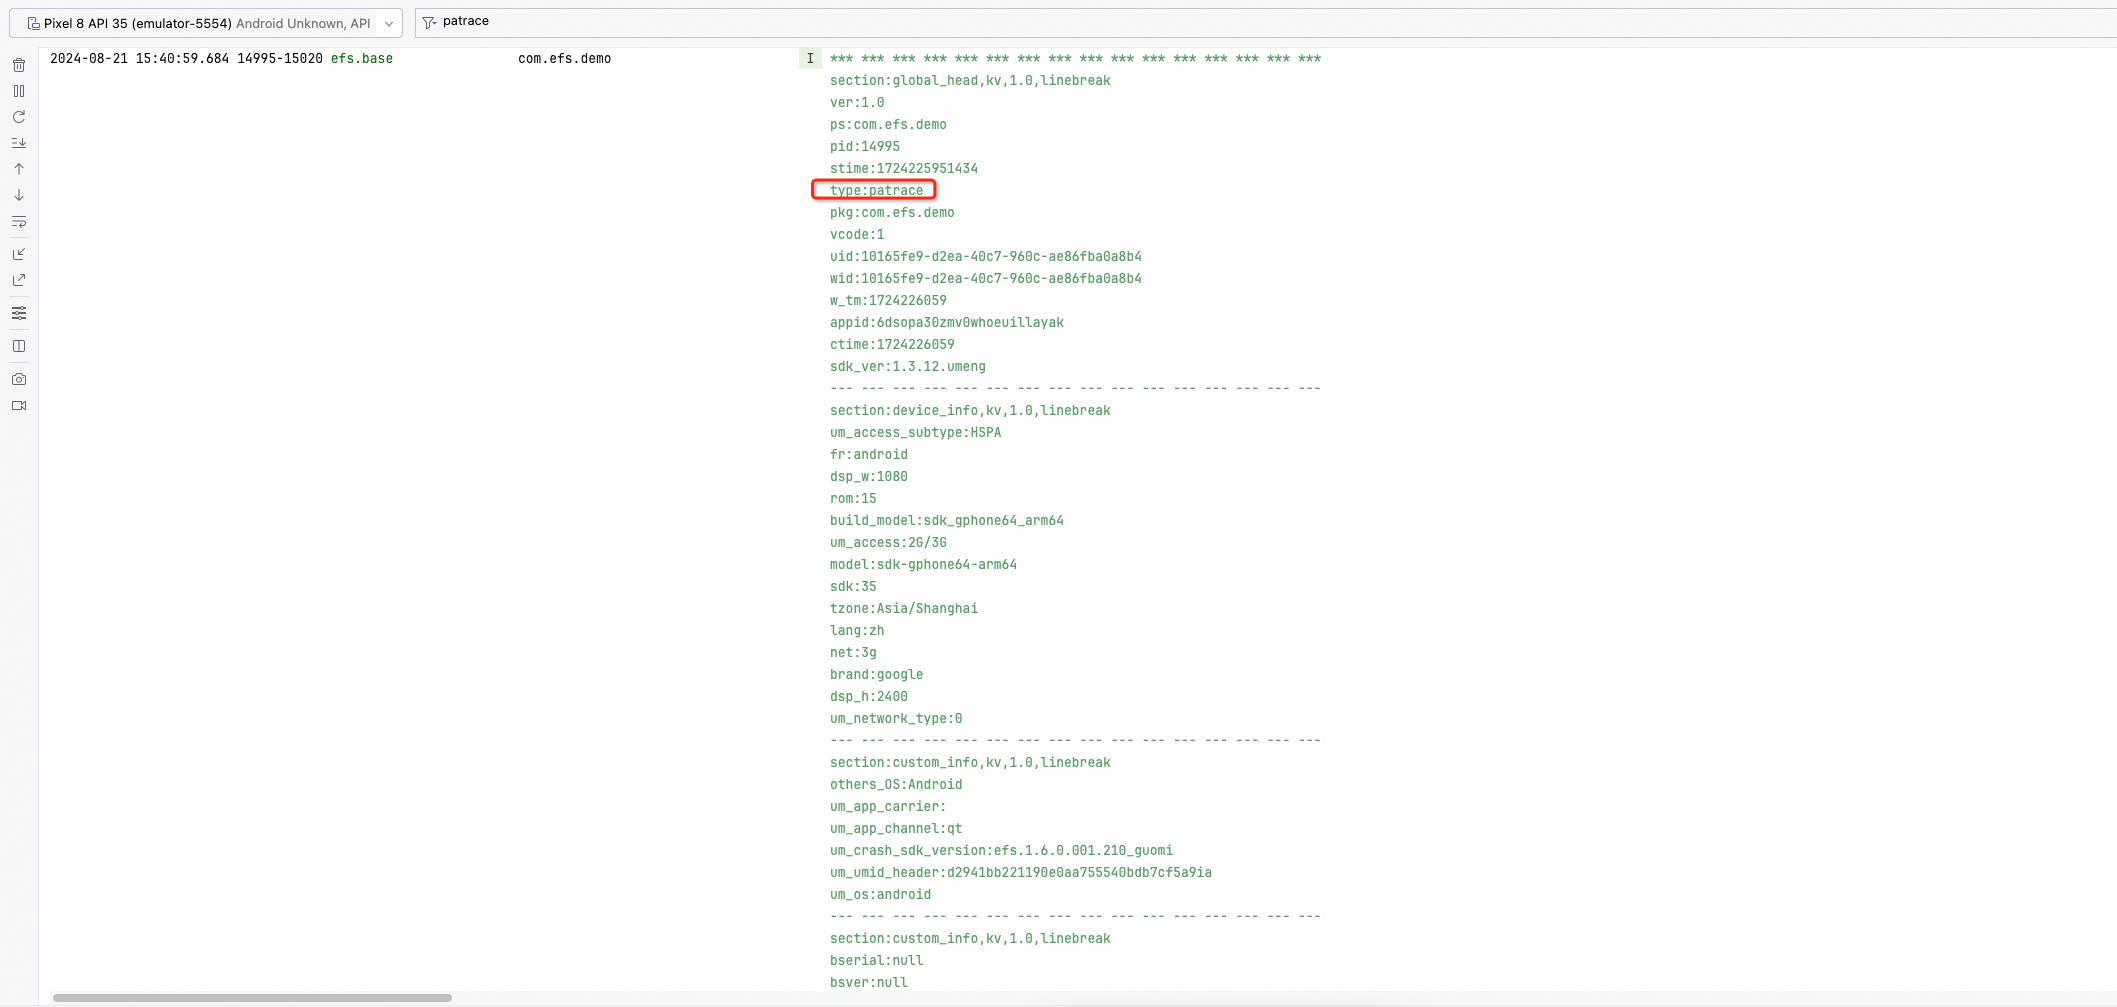
When simulating lag, filter for
patrace. Successful lag collection looks like this:Memory Analysis Reporting
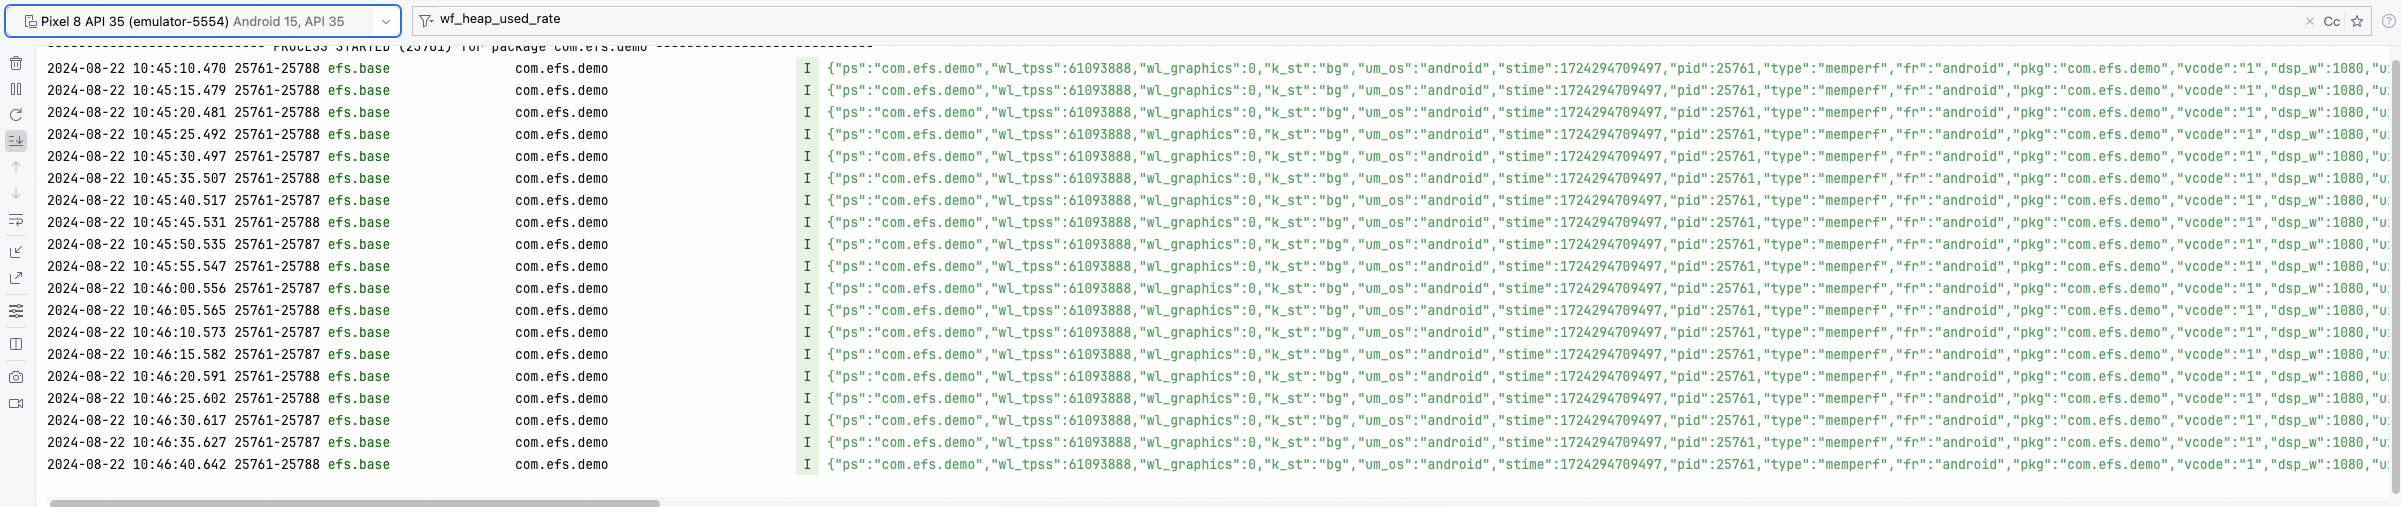
After enabling memory analysis, filter for
wf_heap_used_rate. Logs appear every second. See image below:Native Page Smoothness and Frame Rate Reporting
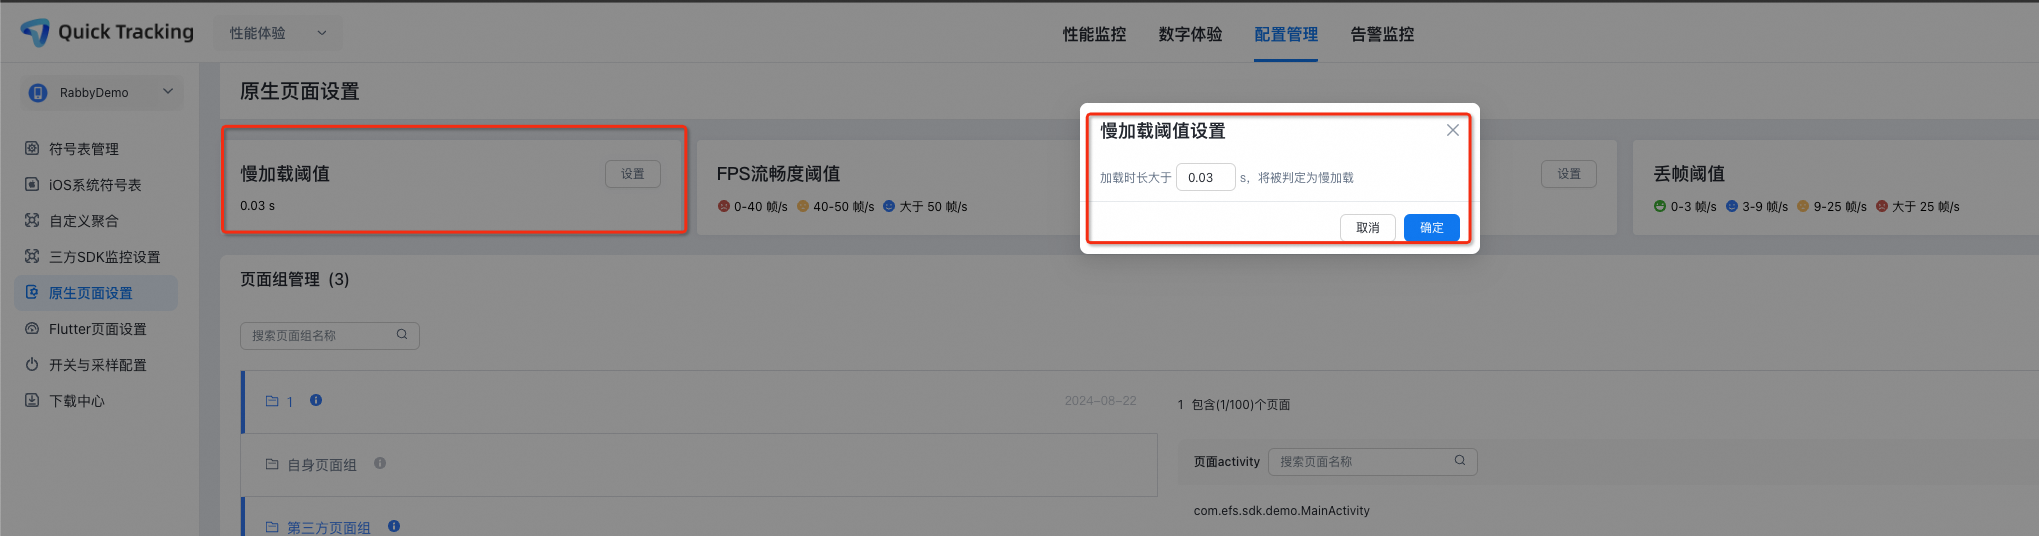
Frame rate reporting requires the automated collection plugin. Follow the Configure Plugin guide. In the management console, enable
Slow Loading Threshold Settings. Adjust load time as needed.After two cold starts, filter for
PageManger-PageFPSImpl. Logs look like this: