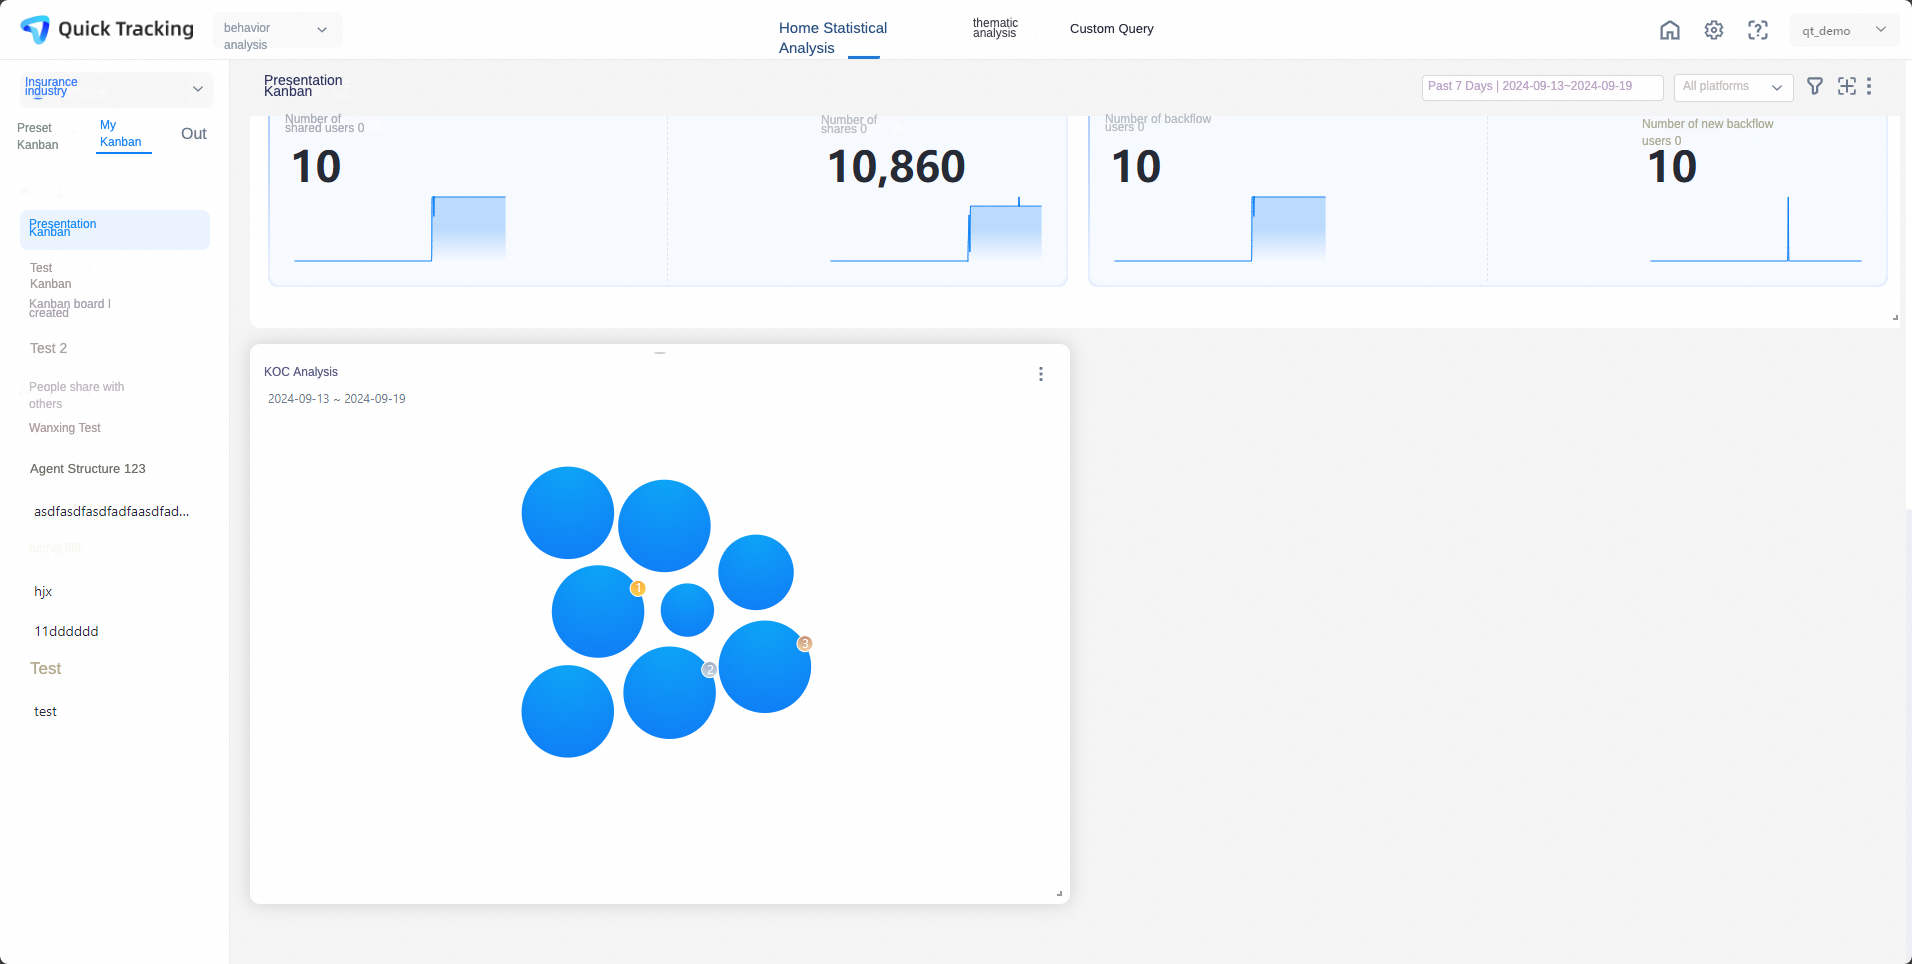
Sharing Fission helps you measure viral referral growth and identify your most impactful sharers. Use it to track sharing trends, rank top sharing users, and score Key Opinion Consumers (KOCs) by their referral impact.
Sharing fission overview
QuickTracking's Sharing Fission module lets you measure and optimize viral referral growth in your app. With it, you can:
Track overall sharing trends and the viral coefficient (K) over time
Identify top sharing users and rank them by referral impact
Score and rank Key Opinion Consumers (KOCs) using a configurable composite index
Save analysis results to reports and add them to dashboards
Sharing Fission covers three sub-features: Sharing Trend, Sharing Users, and KOC Analysis.
Before using Sharing Fission, integrate the Sharing Fission SDK. See Sharing fission for integration instructions.
Sharing trend
Go to the Thematic Analysis page and select the Sharing Trend tab. The page shows the overall sharing performance of your app, with metrics you can slice across multiple dimensions.
The Sharing Trend page is divided into three sections: filter conditions, analysis chart, and trend details.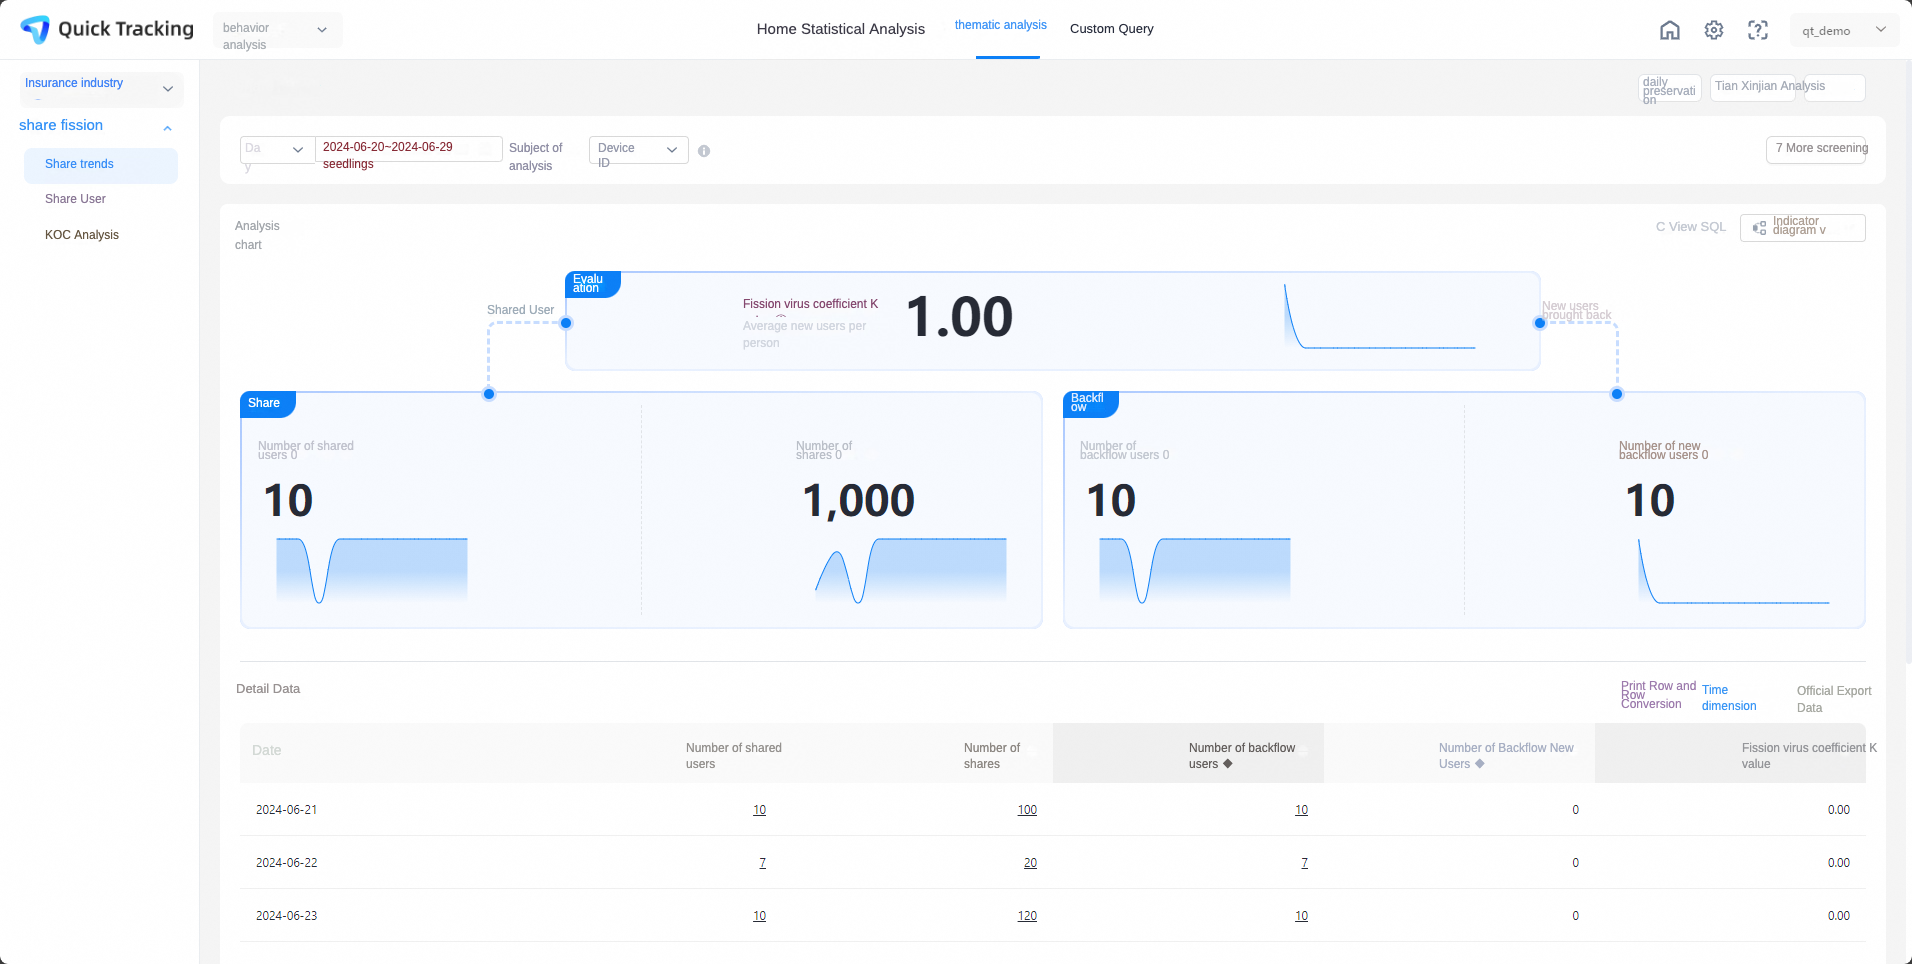
Filter conditions
Use the filter bar to scope the data:
Time range: Defaults to the past 7 days. Switch to a relative period or a fixed date range as needed.
Analysis entity: Defaults to device ID. Switch to account ID or entity ID.
-
More filters: Click More Filter to add the following filter types:
Grouping: Break down results by event attributes, global attributes, user attributes, system attributes, channel attributes, or user groups. Up to 10 groups.
Global filtering: Filter by global properties, user properties, system properties, channel properties, or referral attributes.
User cohort: Restrict the analysis to a specific user cohort.
Analysis chart
-
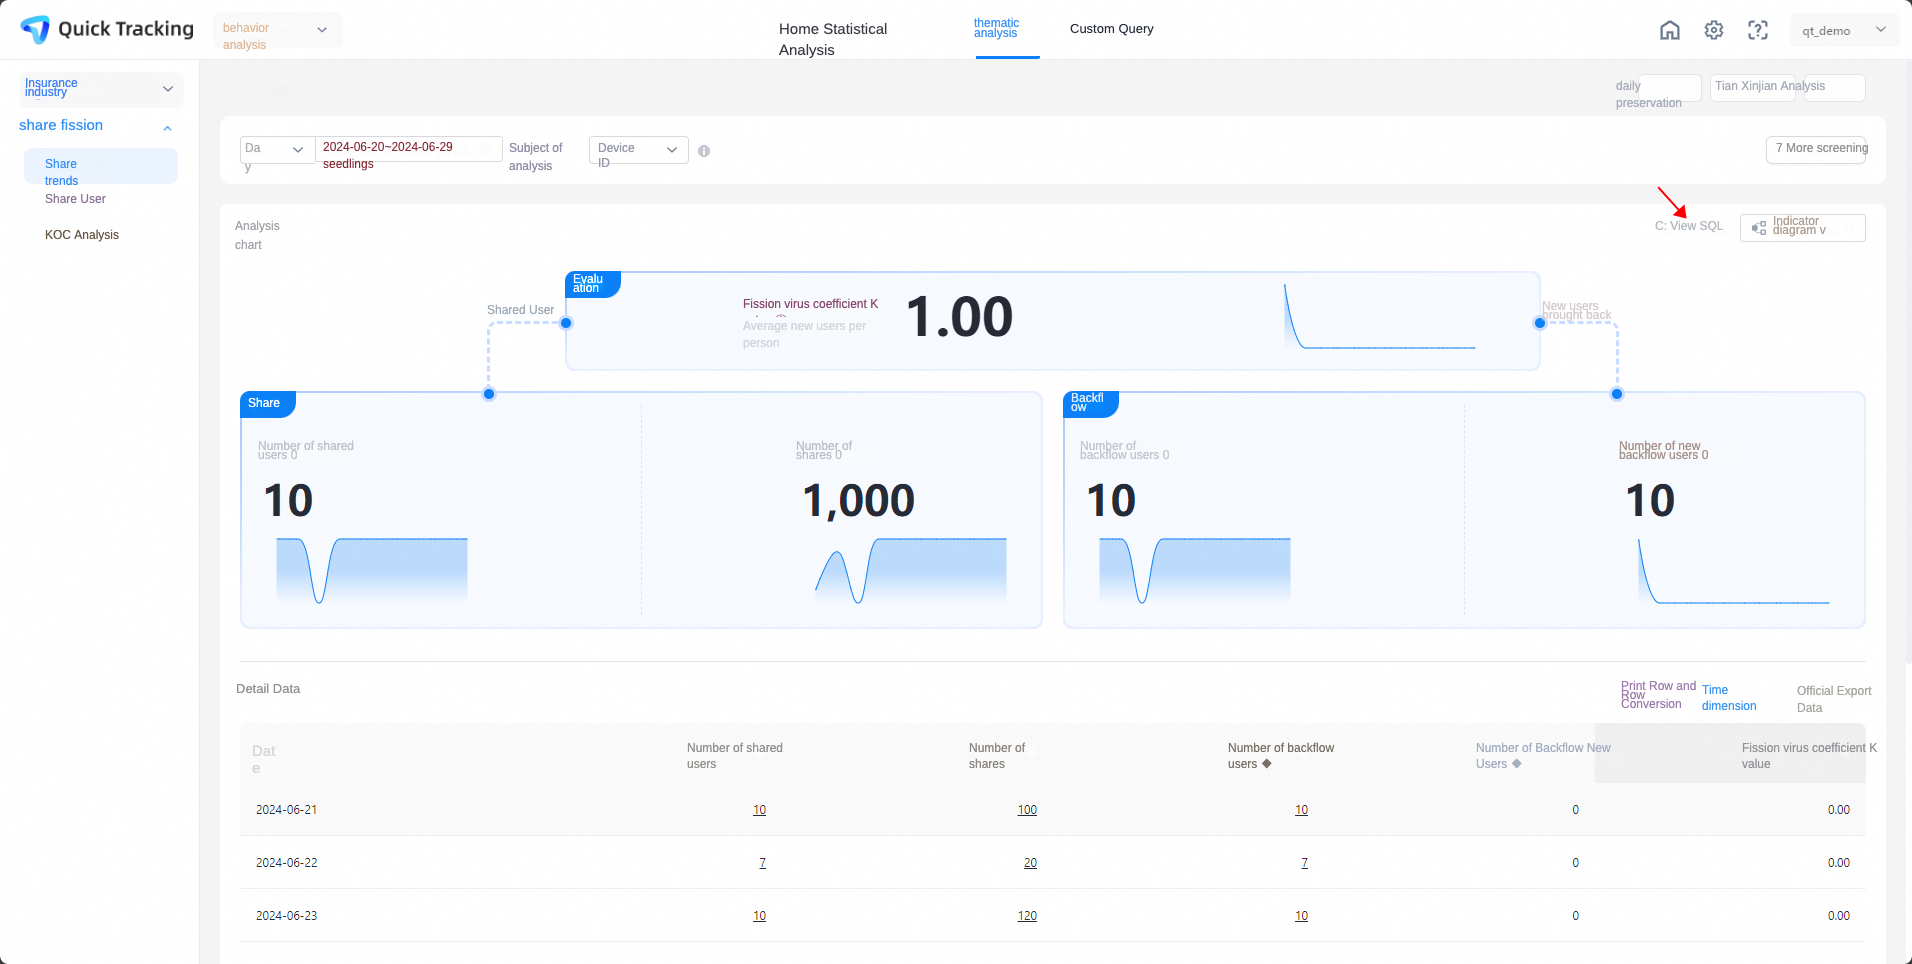
View SQL: Click View SQL in the analysis chart section to see the underlying query. Click Copy to copy it.
-
Chart type: Choose from Indicator Relationship Chart, Indicator Trend Chart, Line Chart, or Bar Chart. The default is Indicator Relationship Chart.
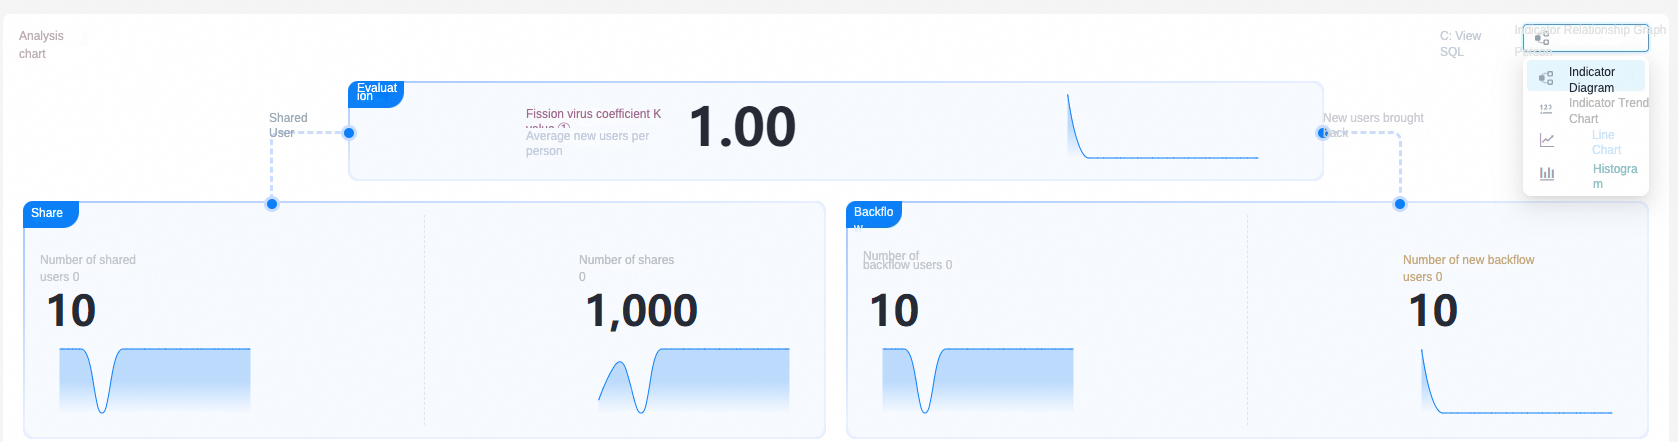
The chart displays the following metrics:
-
Viral coefficient (K): The average number of new users each sharing user brings back. Calculated as:
K = unique returning new users from referral events ÷ unique users who triggered sharing events
Sharing users: The unique count of analysis entity IDs that triggered preset sharing events.
Sharing times: The total number of times the preset sharing event was triggered.
Returning users: The unique count of analysis entity IDs for any event where the sharing attribute Share Recurring is set to Yes (users who returned via a shared link).
Returning new users: The unique count of analysis entity IDs where Share Recurring is Yes and the event occurred on their first day in the app.
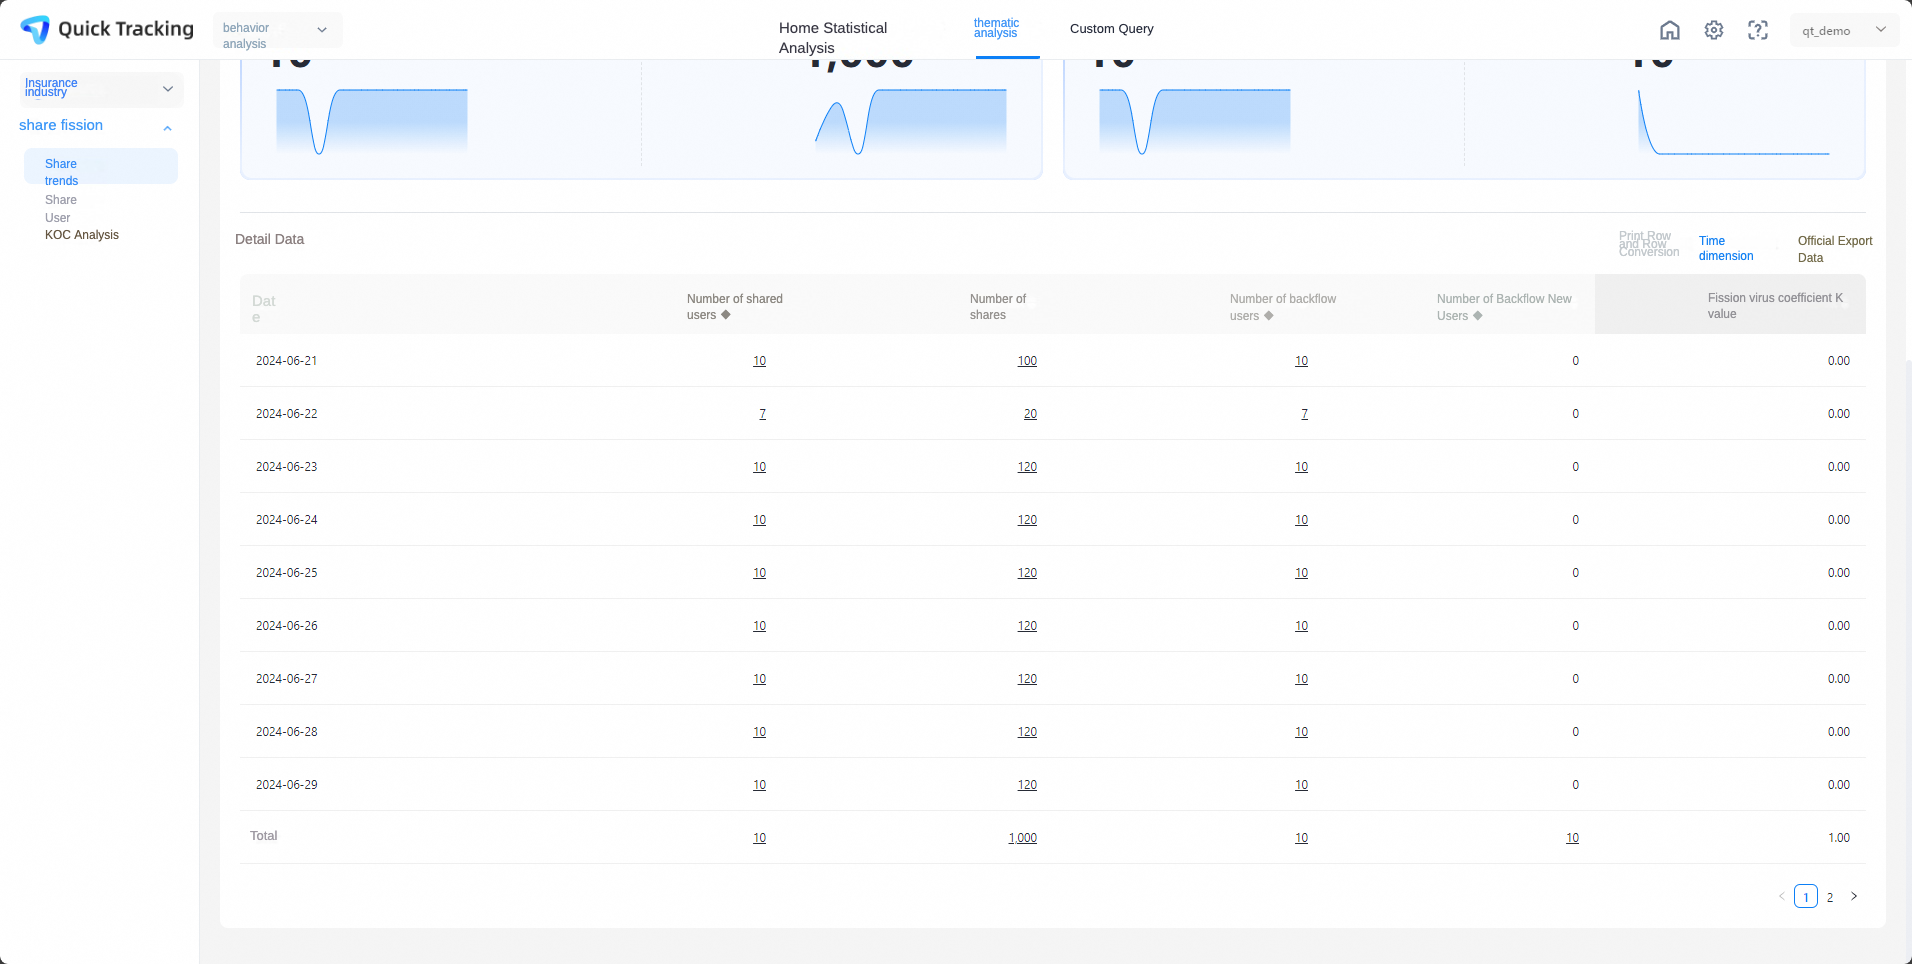
Share trend details
-
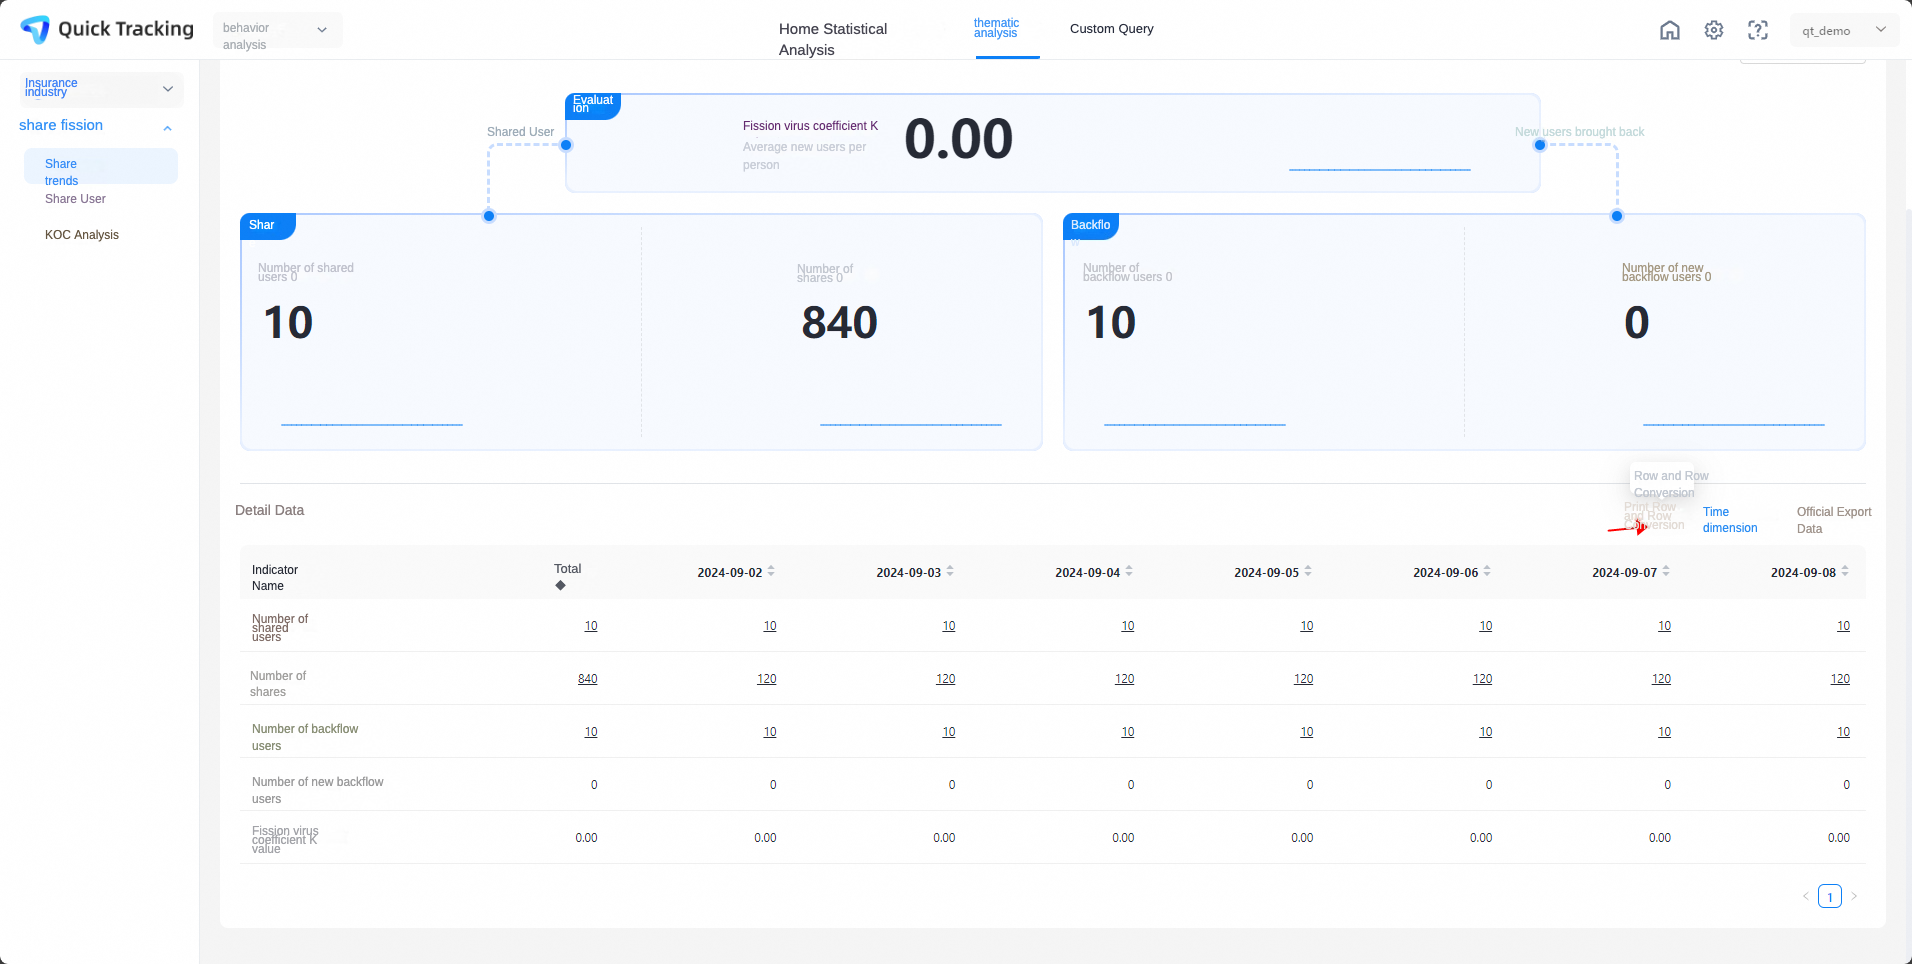
Pivot: Transpose the detail table so rows show either Indicator Name or Date.
-
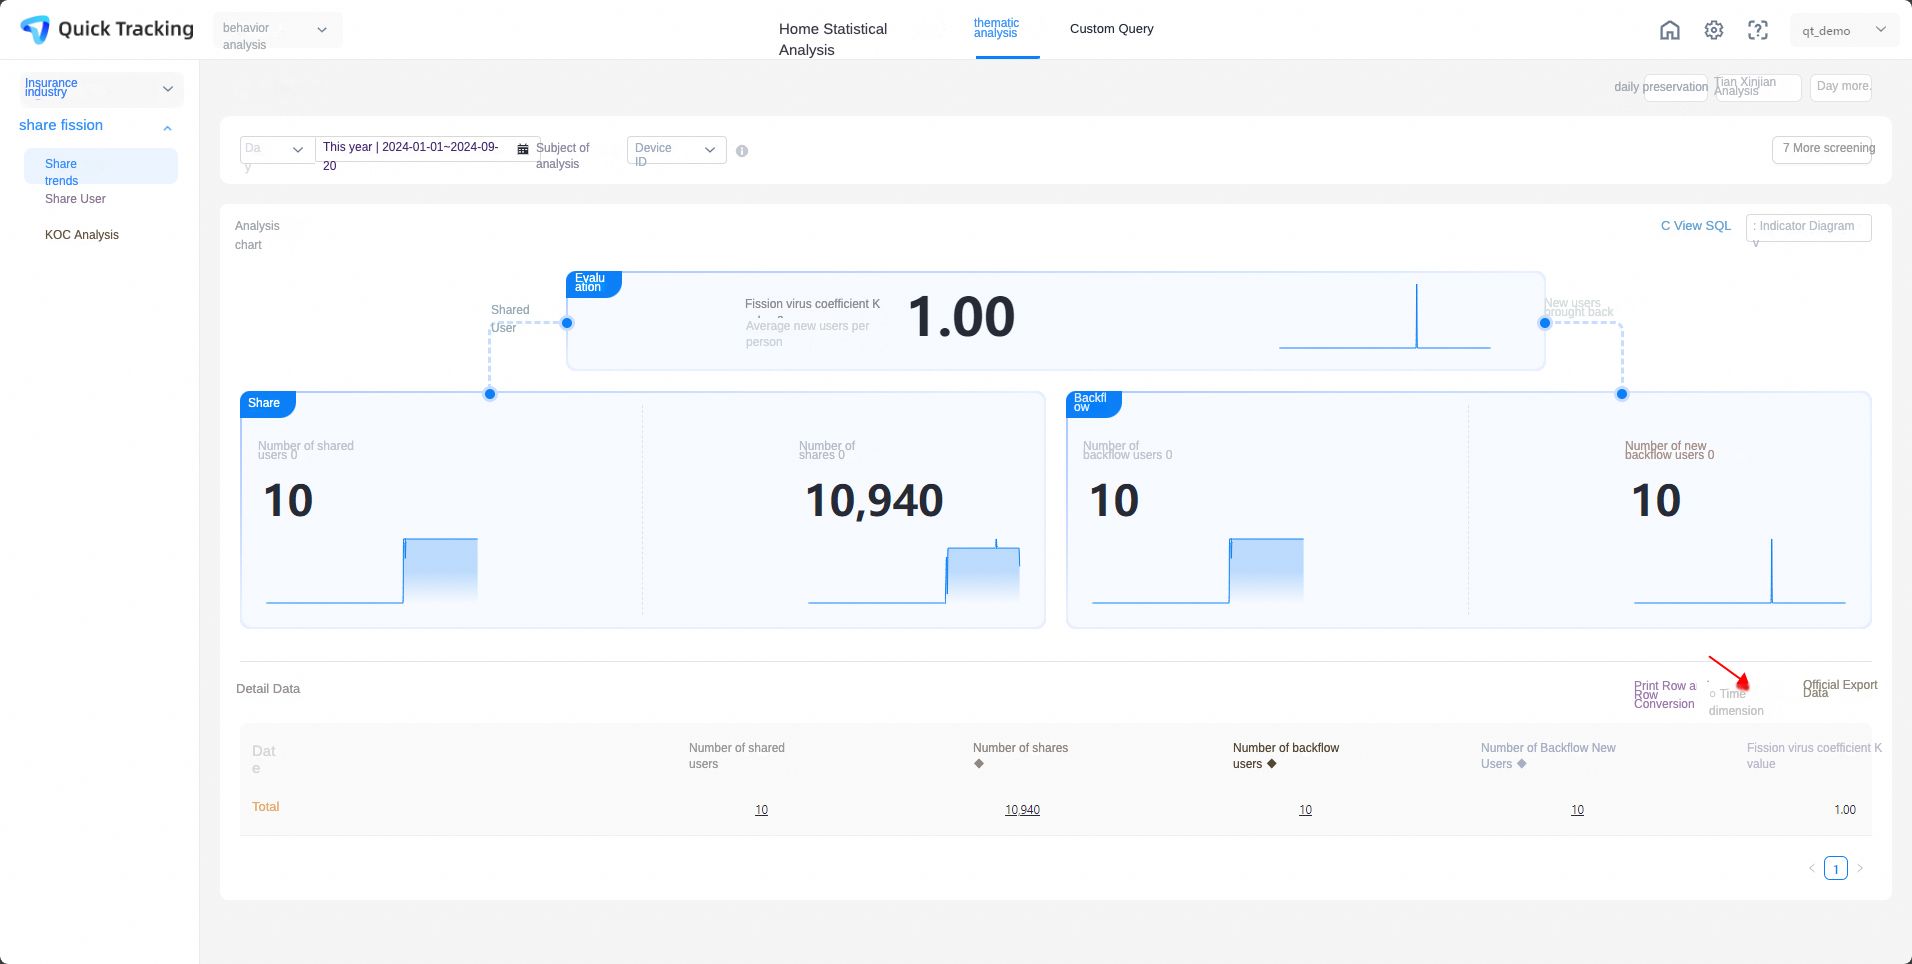
Time dimension: When enabled, the table breaks data down by date. When disabled, the table shows aggregate totals for the full time range.

Export data: Download the current detail table as a file.
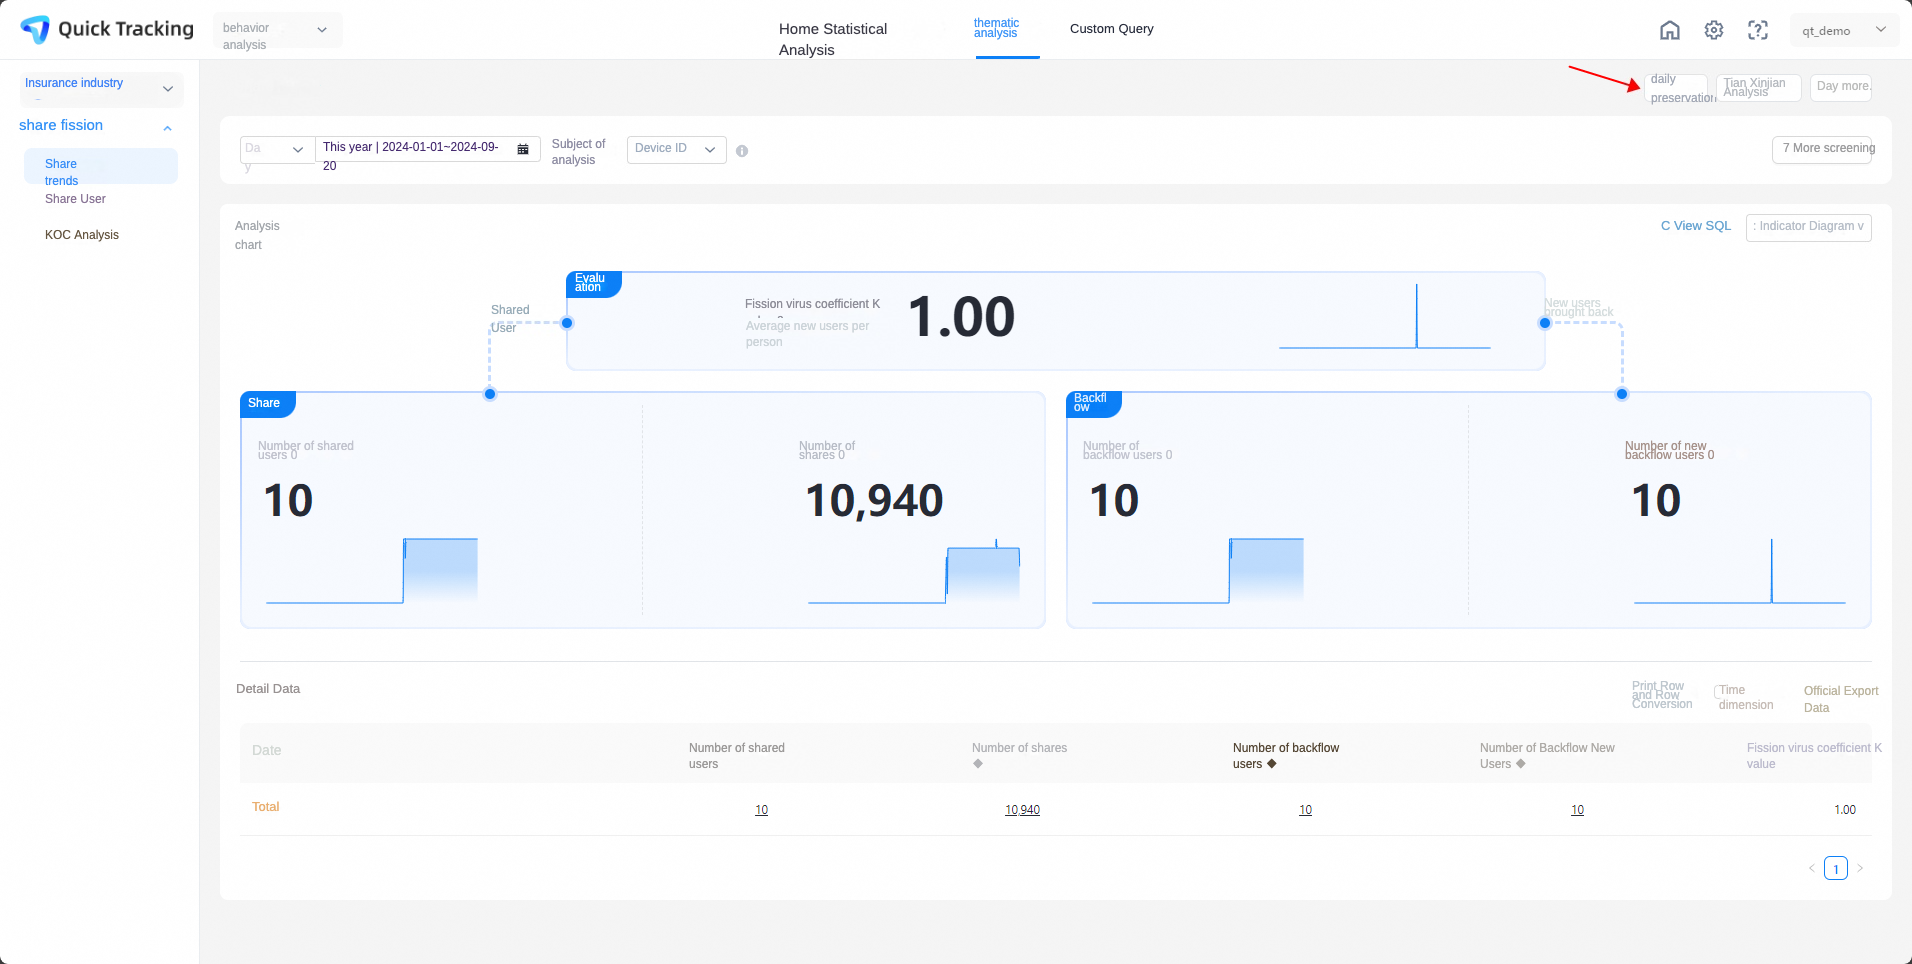
Save a report
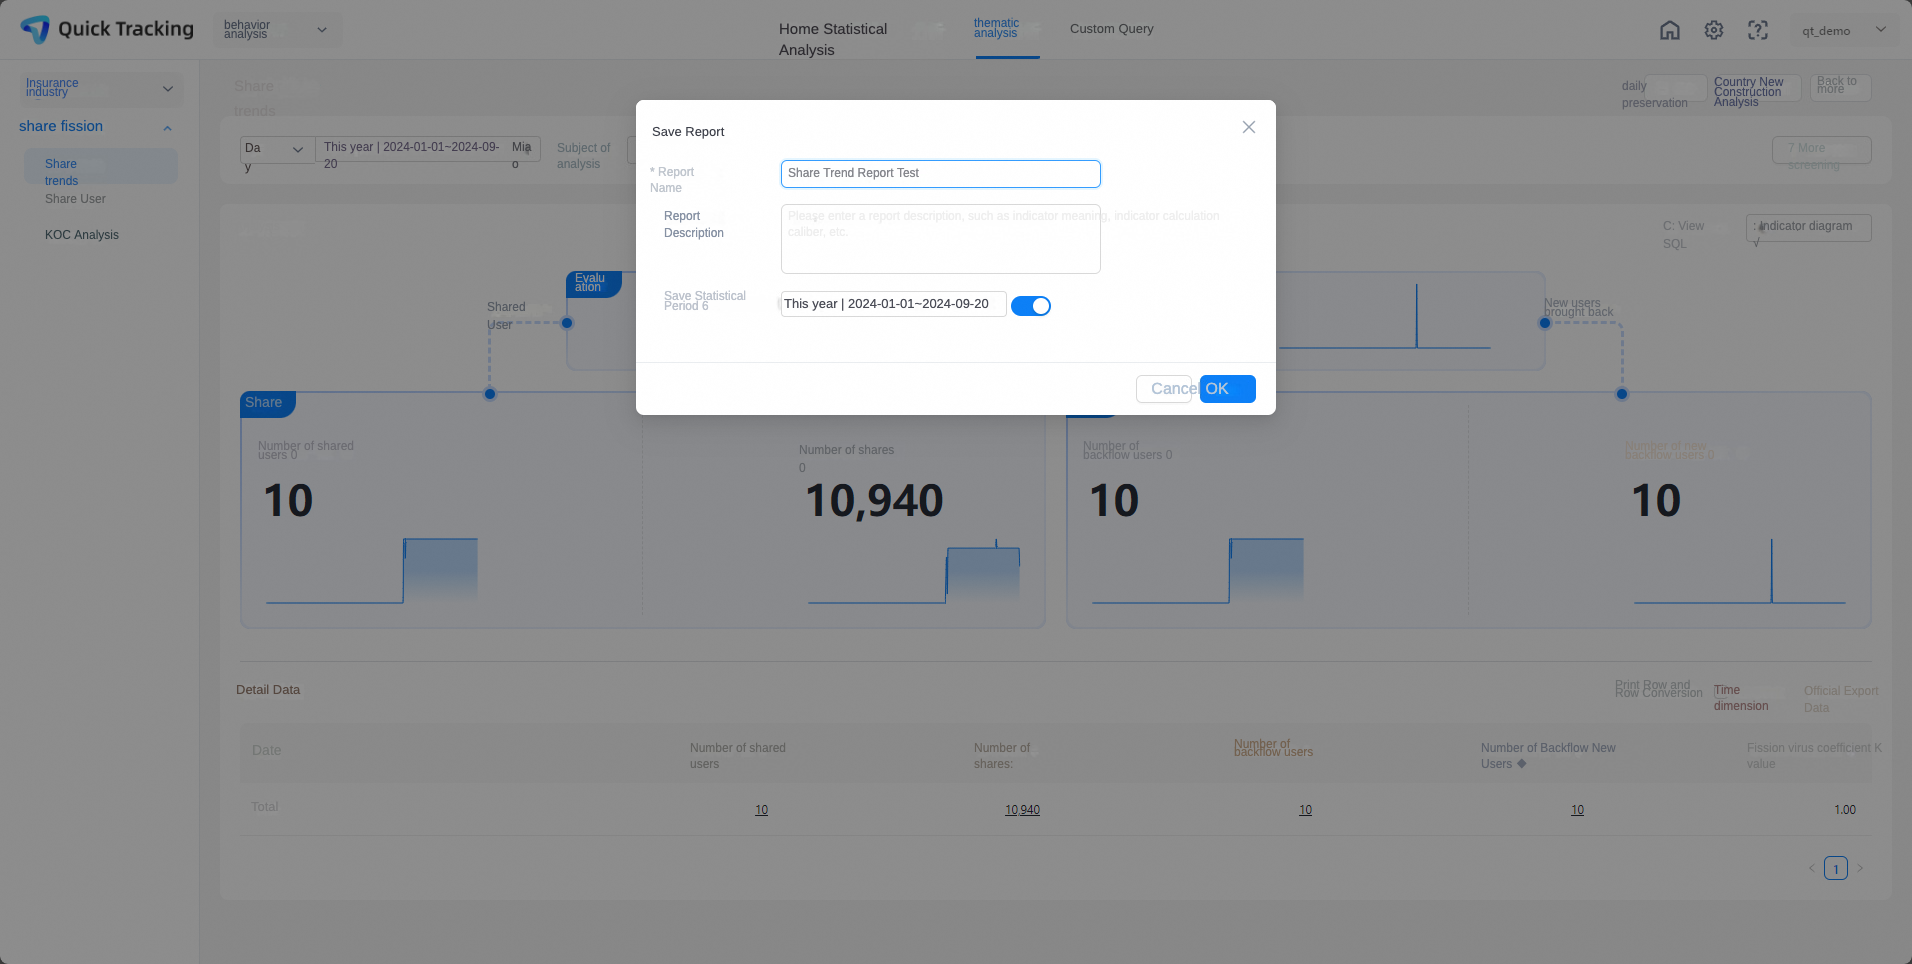
Click Save in the upper-right corner. In the Save Report dialog box, fill in the following fields and click OK to save to the report list:
Report metric
Statistical time period
-
Click OK to save the report.
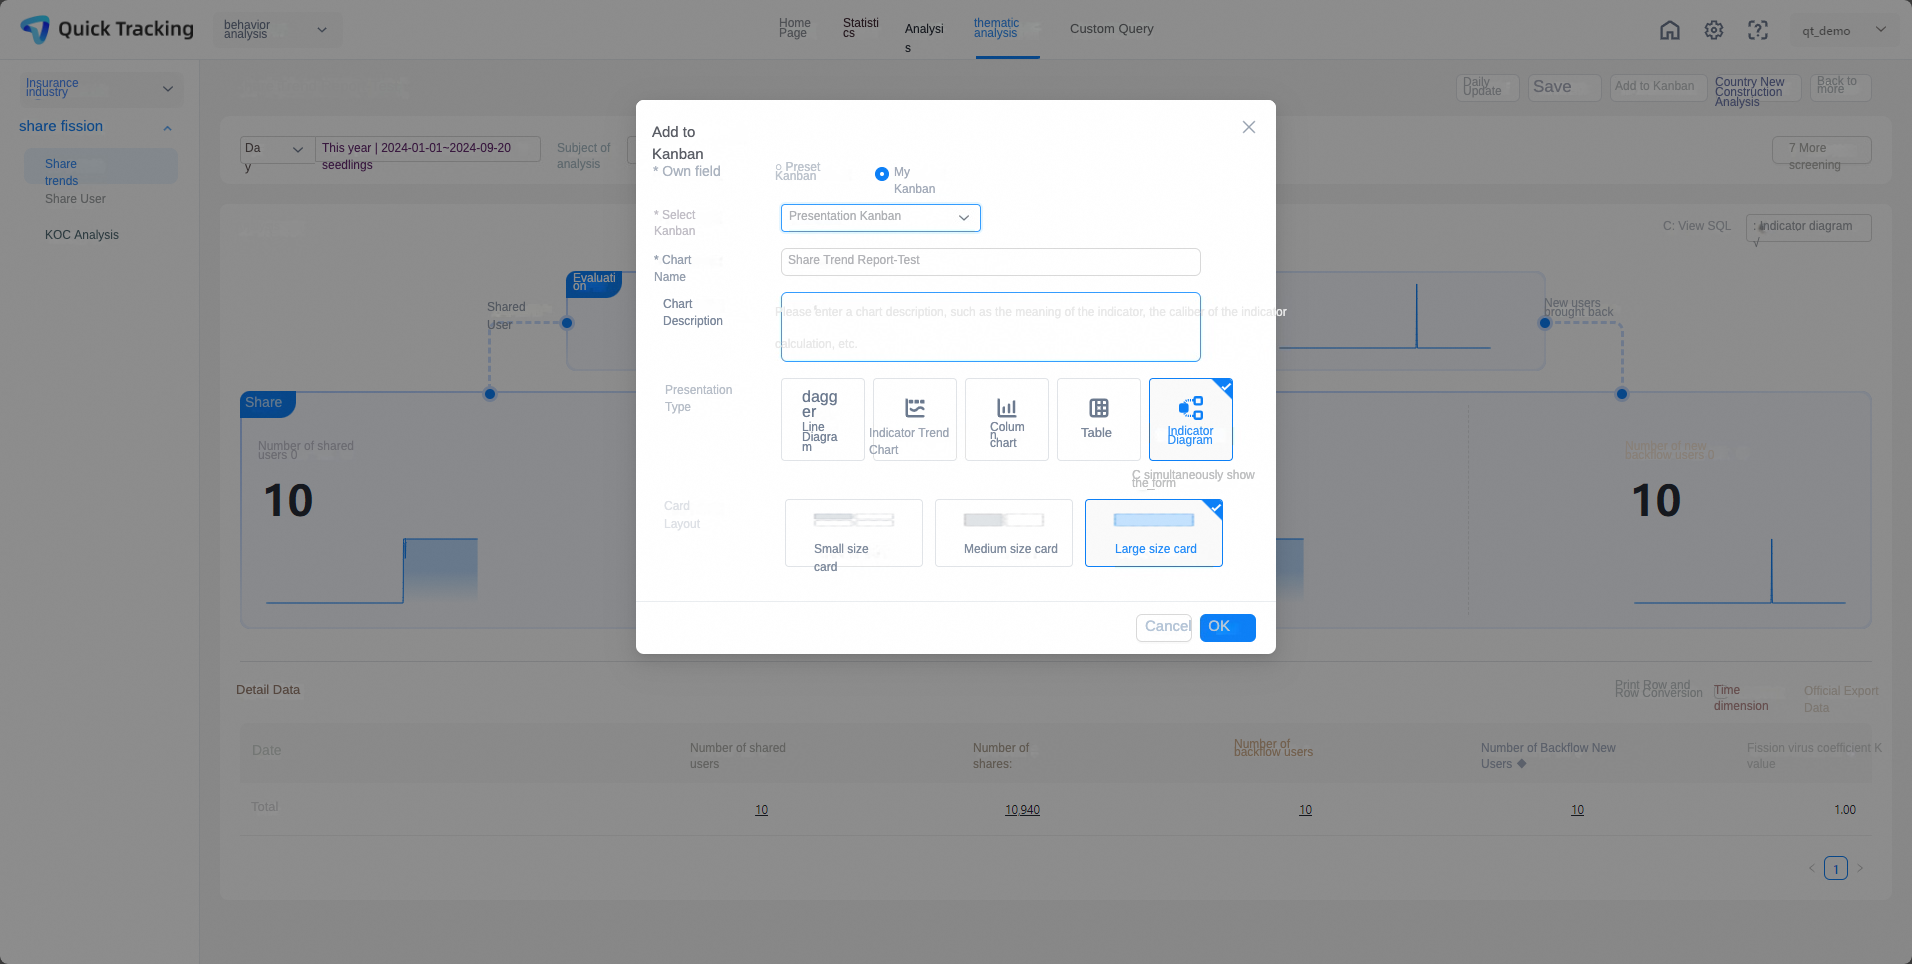
To add the saved report to a dashboard, click Add to Dashboard. Select the dashboard type, the target dashboard, the chart display type, and the layout, then click OK.
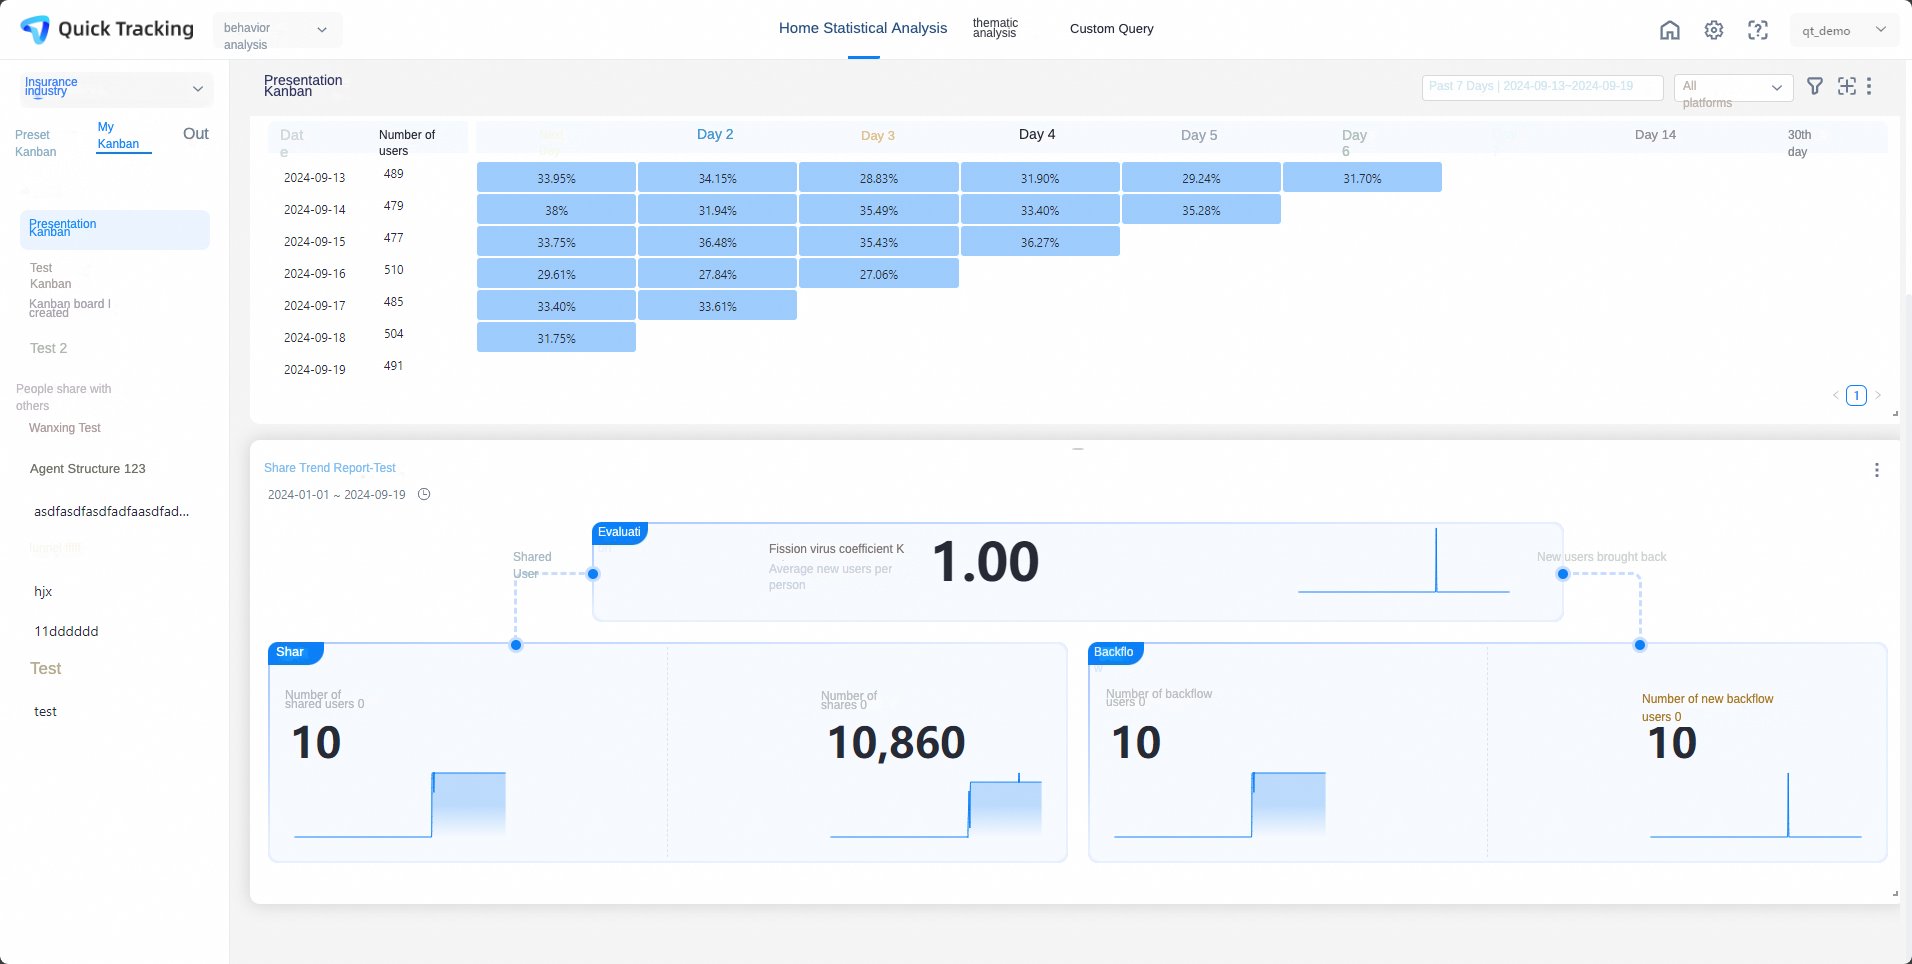
After the report is added, click Jump to open the dashboard.
Sharing users
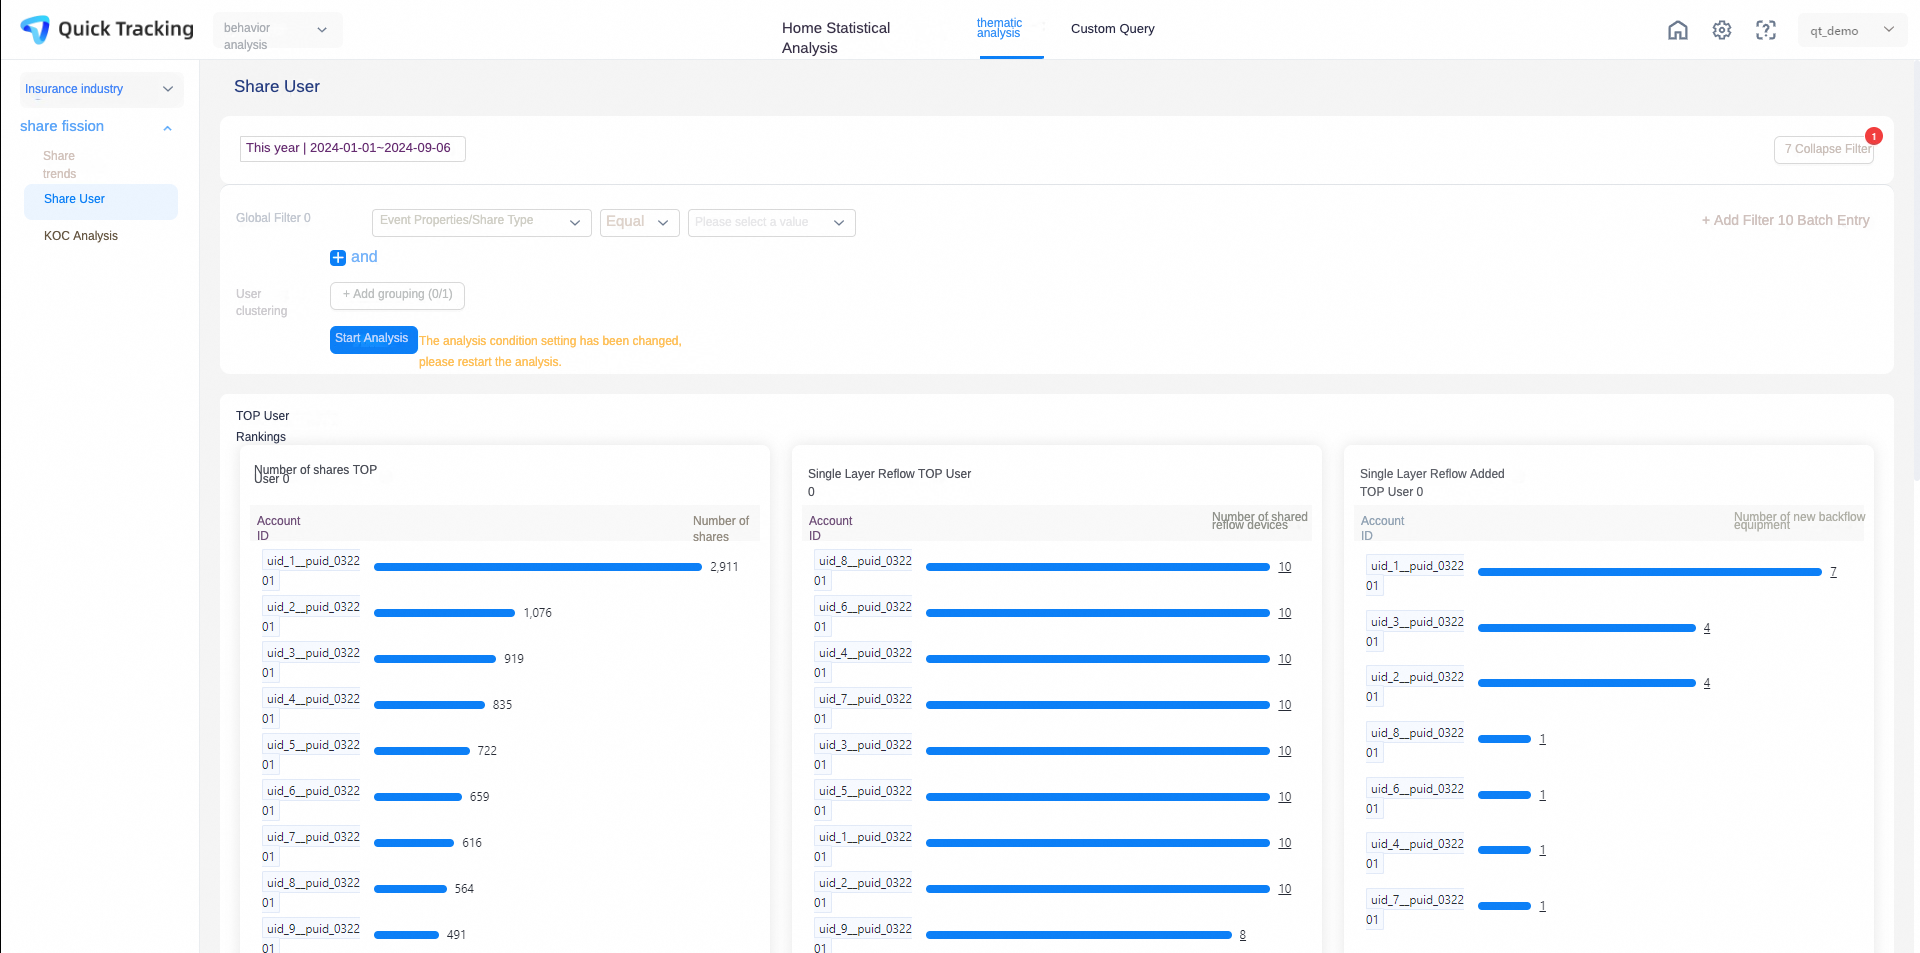
Navigate to Thematic Analysis > Sharing Fission > Sharing Users.
Filter conditions
-
Filter by condition
Time range: Choose a fixed or relative period. Defaults to the past 7 days.
More filters: Click More Filter to filter by event attributes (shared across events), global attributes, user attributes, system attributes, channel attributes, or referral attributes.
-
Top user leaderboard
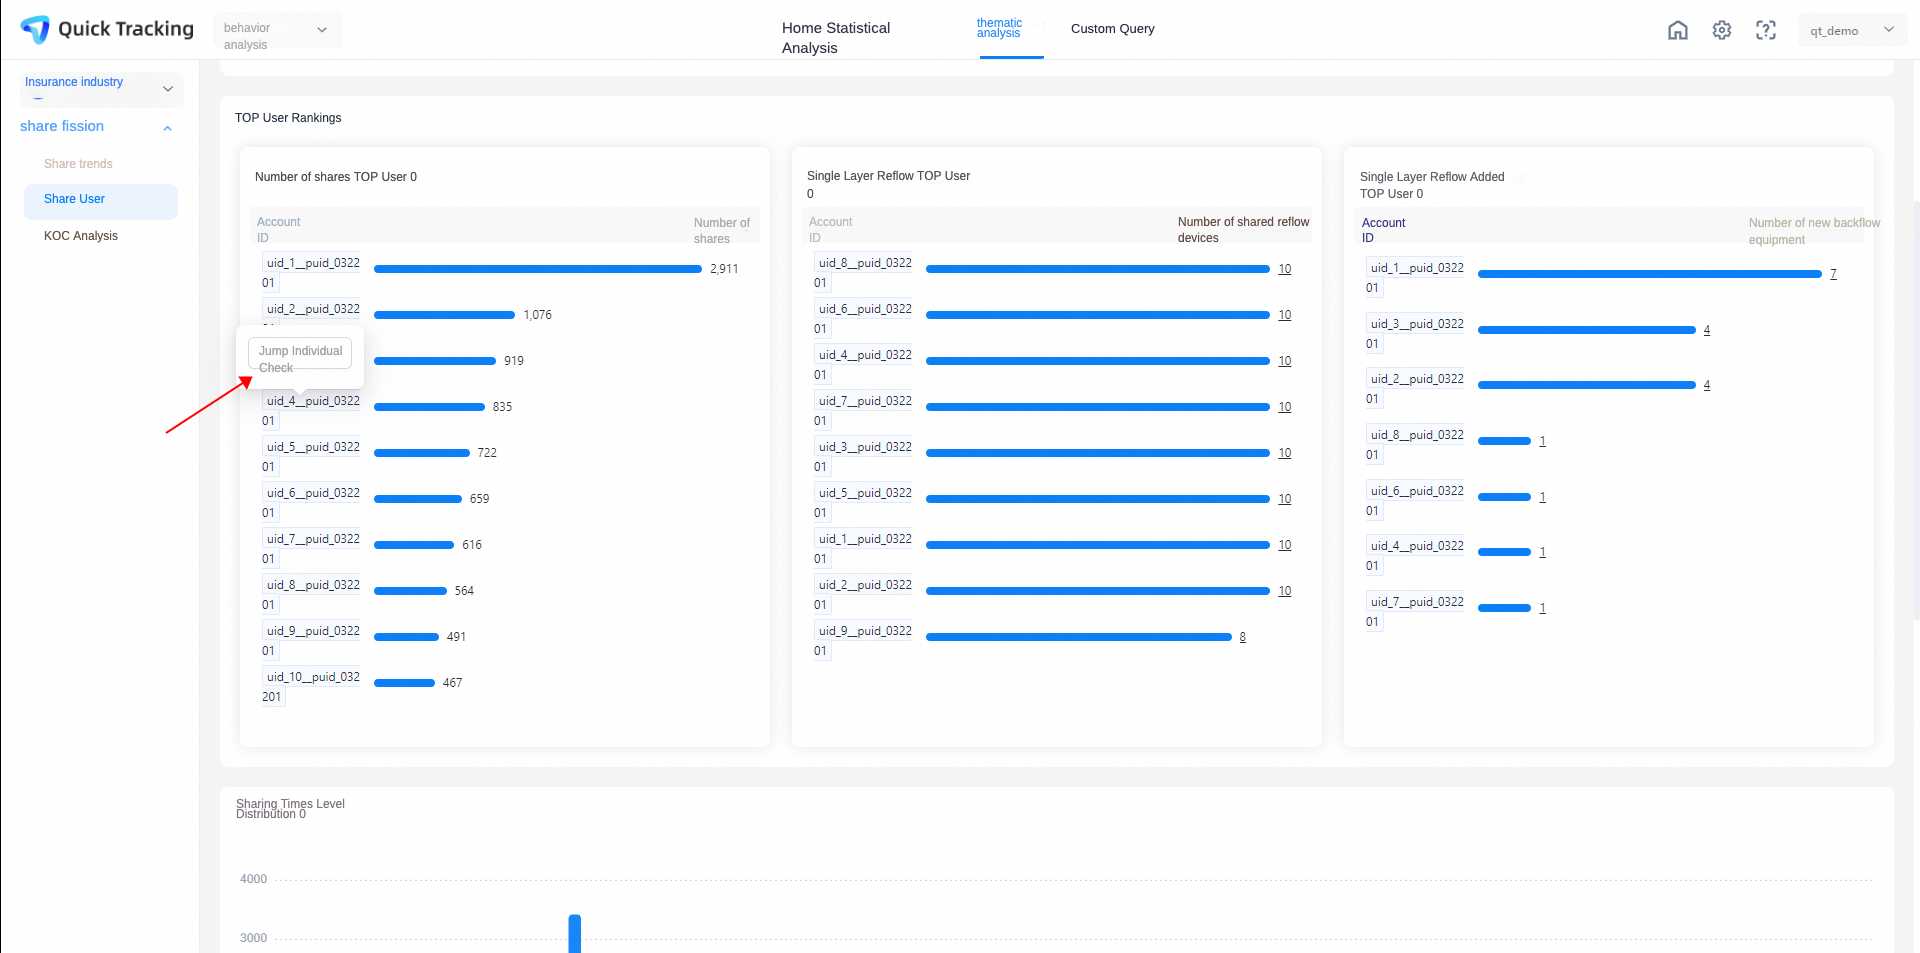
Click a user ID to go to the individual drill-down page for that user.
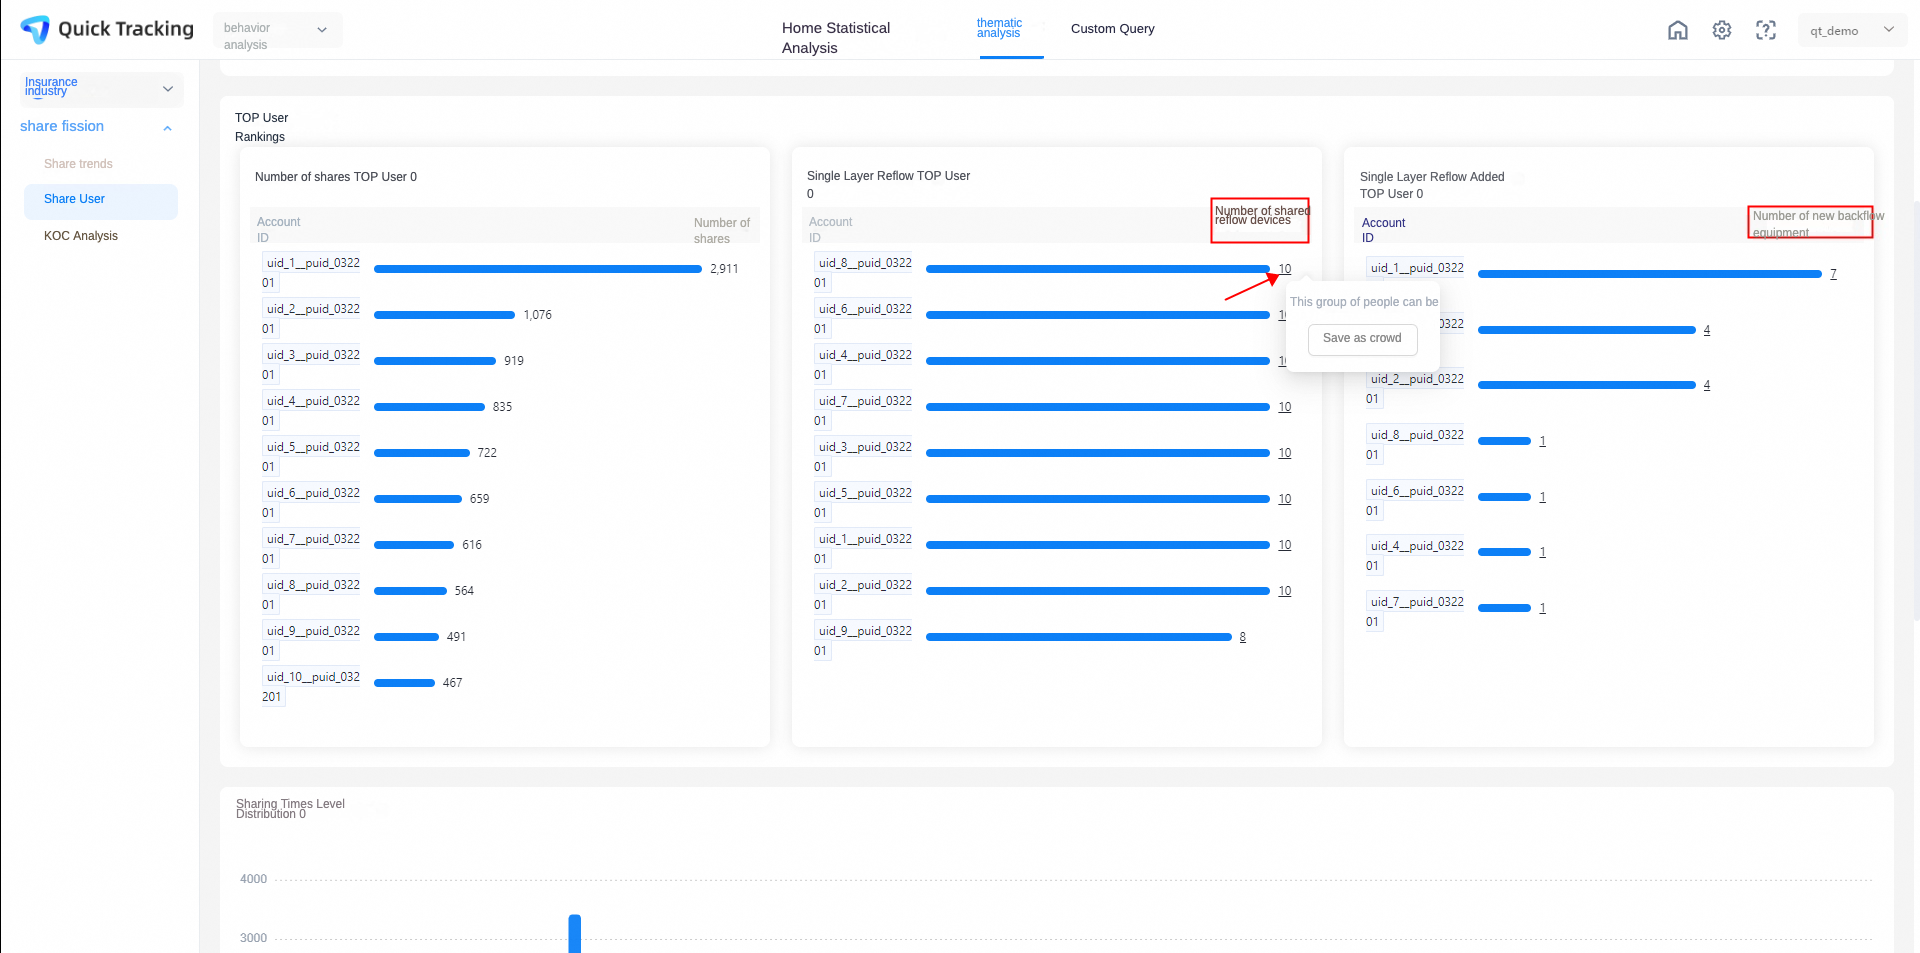
Click the user count in the Direct referral returning users or Direct referral returning new users display area to save that user set.
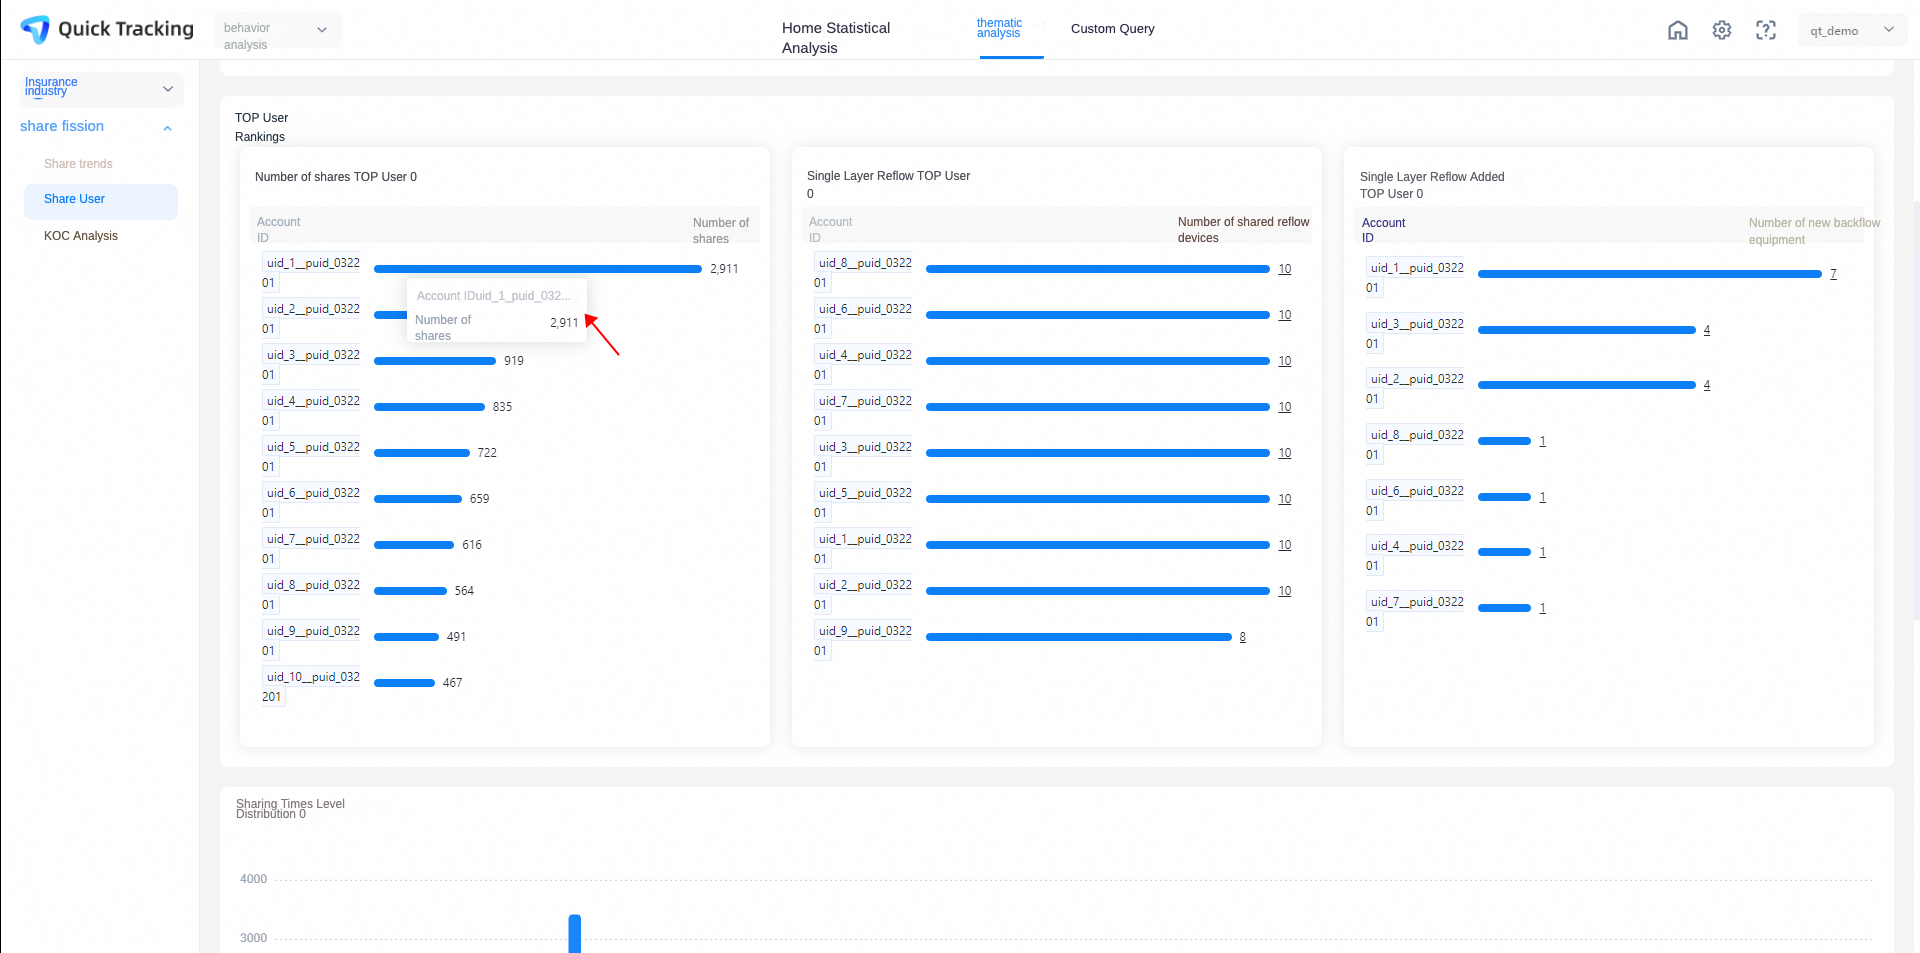
Hover over a user row to see the account ID and metric values for that user.
Top sharing users: The 10 users with the most sharing events in the selected time range.
Direct referral returning users: The 10 users whose direct shares (first-degree) produced the highest unique count of returning device IDs.
Direct referral returning new users: The 10 users whose direct shares produced the highest unique count of returning new device IDs.
-
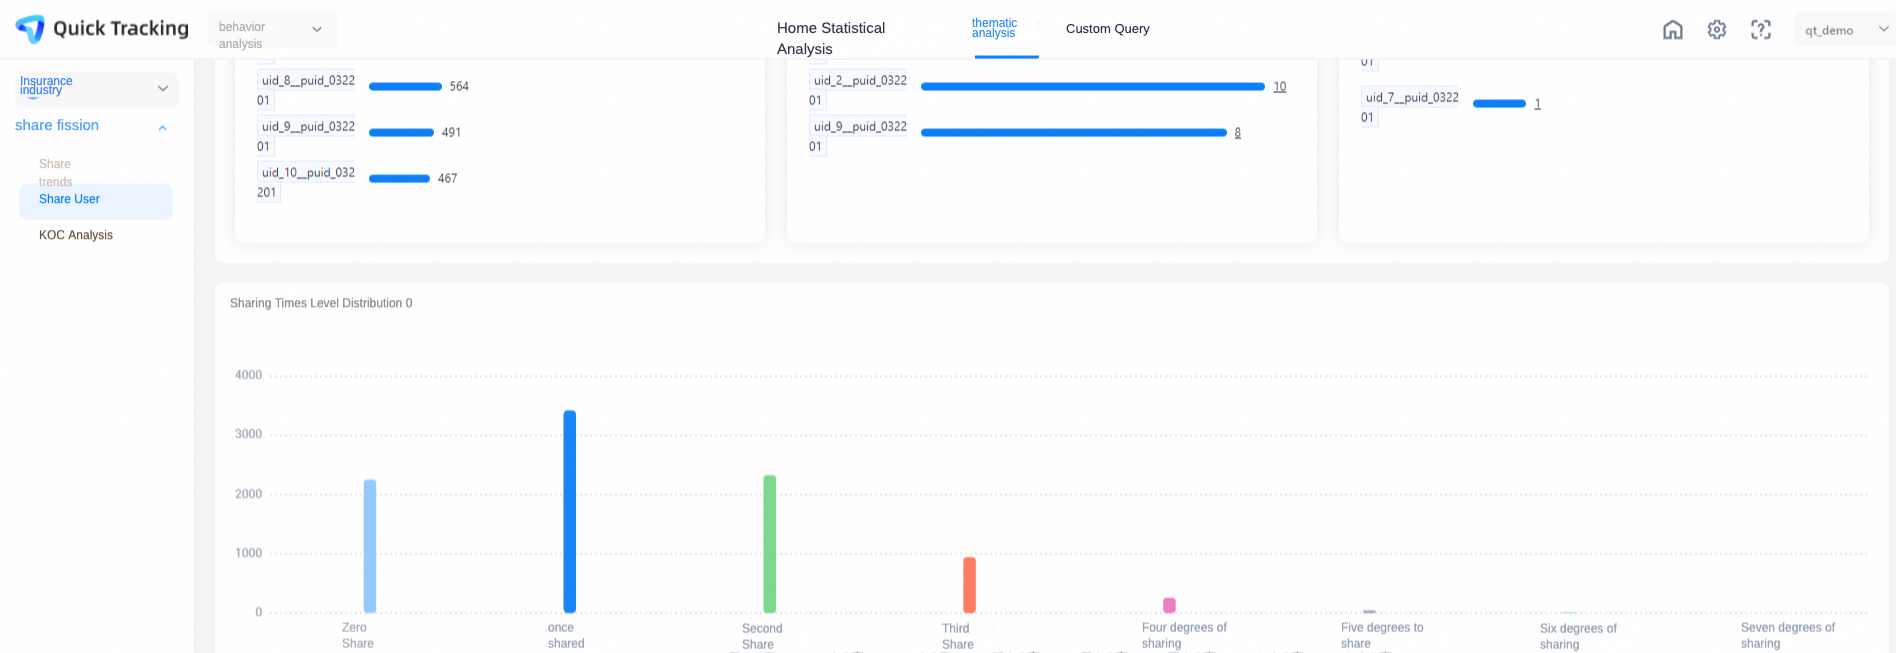
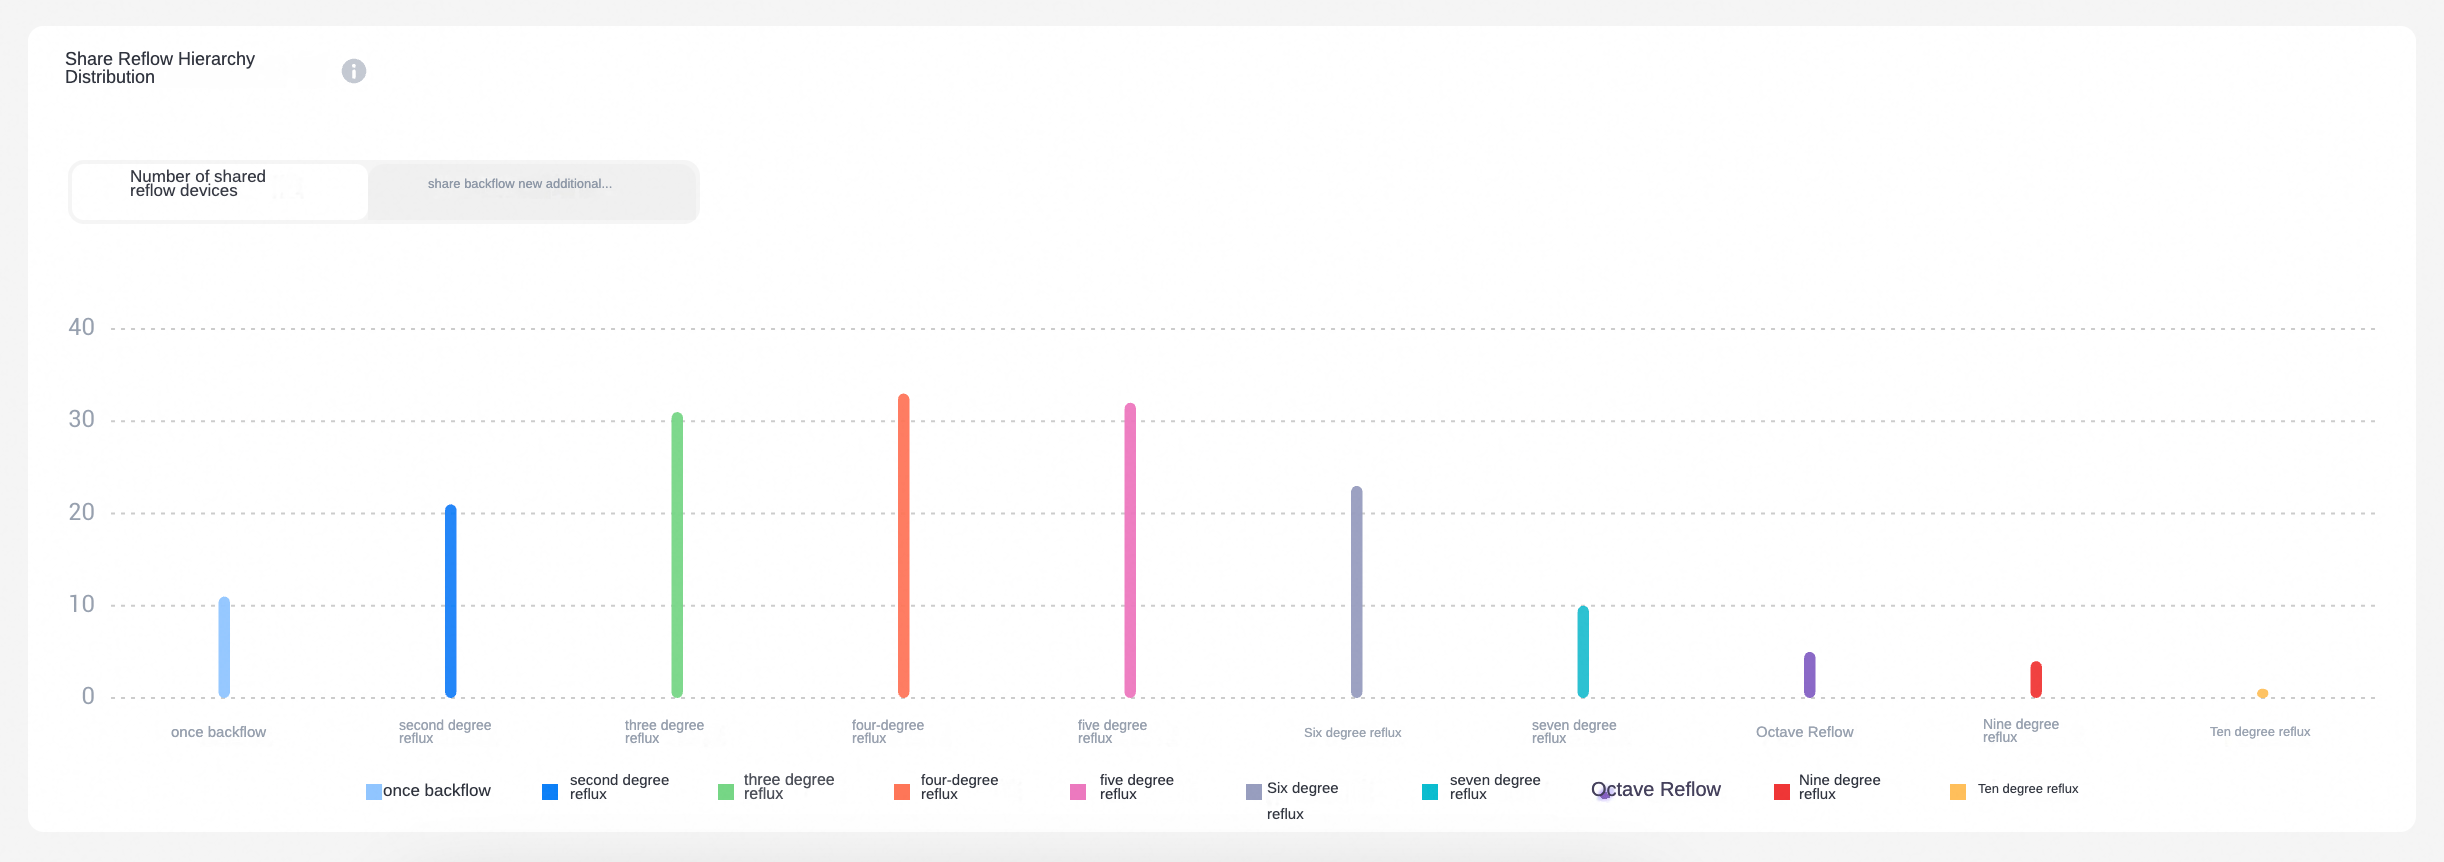
Distribution of sharing times by referral depth
This chart groups sharing event counts (
$$_share) by referral depth ($$_share_referer_rank). Depth 0 represents the first sharing tier — the original sharer. Depth 1 represents users who reshared content they received from a depth-0 user, and so on. -
Distribution of returning users by referral depth
This chart shows how returning users are distributed across referral depths, split into two sub-metrics:
Returning devices by referral depth: The unique count of device IDs for any event where
$$_is_from_shareistrue($$_any_event), grouped by referral depth ($$_share_rank). Depth 1 is the first tier of returning users — those who returned directly from a shared link.-
New returning devices by referral depth: The unique count of device IDs for first-day returning events (
$$_any_eventwhere$$_is_from_shareistrueand$$_is_first_dayis1), grouped by referral depth ($$_share_rank). Depth 1 is the first tier of new returning users.
KOC analysis
Key Opinion Consumer (KOC) analysis scores and ranks users by their referral impact. Unlike a Key Opinion Leader (KOL), who reaches a broad audience directly, a KOC drives growth through their personal network — bringing back users who then bring back more users across multiple referral depths.
KOC index parameters
The KOC index is a composite score made up of two fixed metrics and one optional custom metric:
Returning users (fixed): The cumulative unique count of all users brought back through each user's shared links, across all referral depths within the attribution level you set.
Returning new users (fixed): The cumulative unique count of first-day users brought back through each user's shared links, within the configured attribution level.
Returning core conversions (custom, optional): The cumulative value of a custom conversion event triggered by users brought back through sharing, within the configured attribution level.
How the KOC index is calculated: Each metric is computed based on the attribution level you define. With attribution level set to 1, only direct (first-degree) returning users count. With attribution level set to 10, all users brought back from depth 1 through 10 count.
Each metric value is converted to a 0–100 score using the scoring rules you configure. The final KOC index is the weighted sum of the three metric scores, with weights you assign.
Use KOC analysis
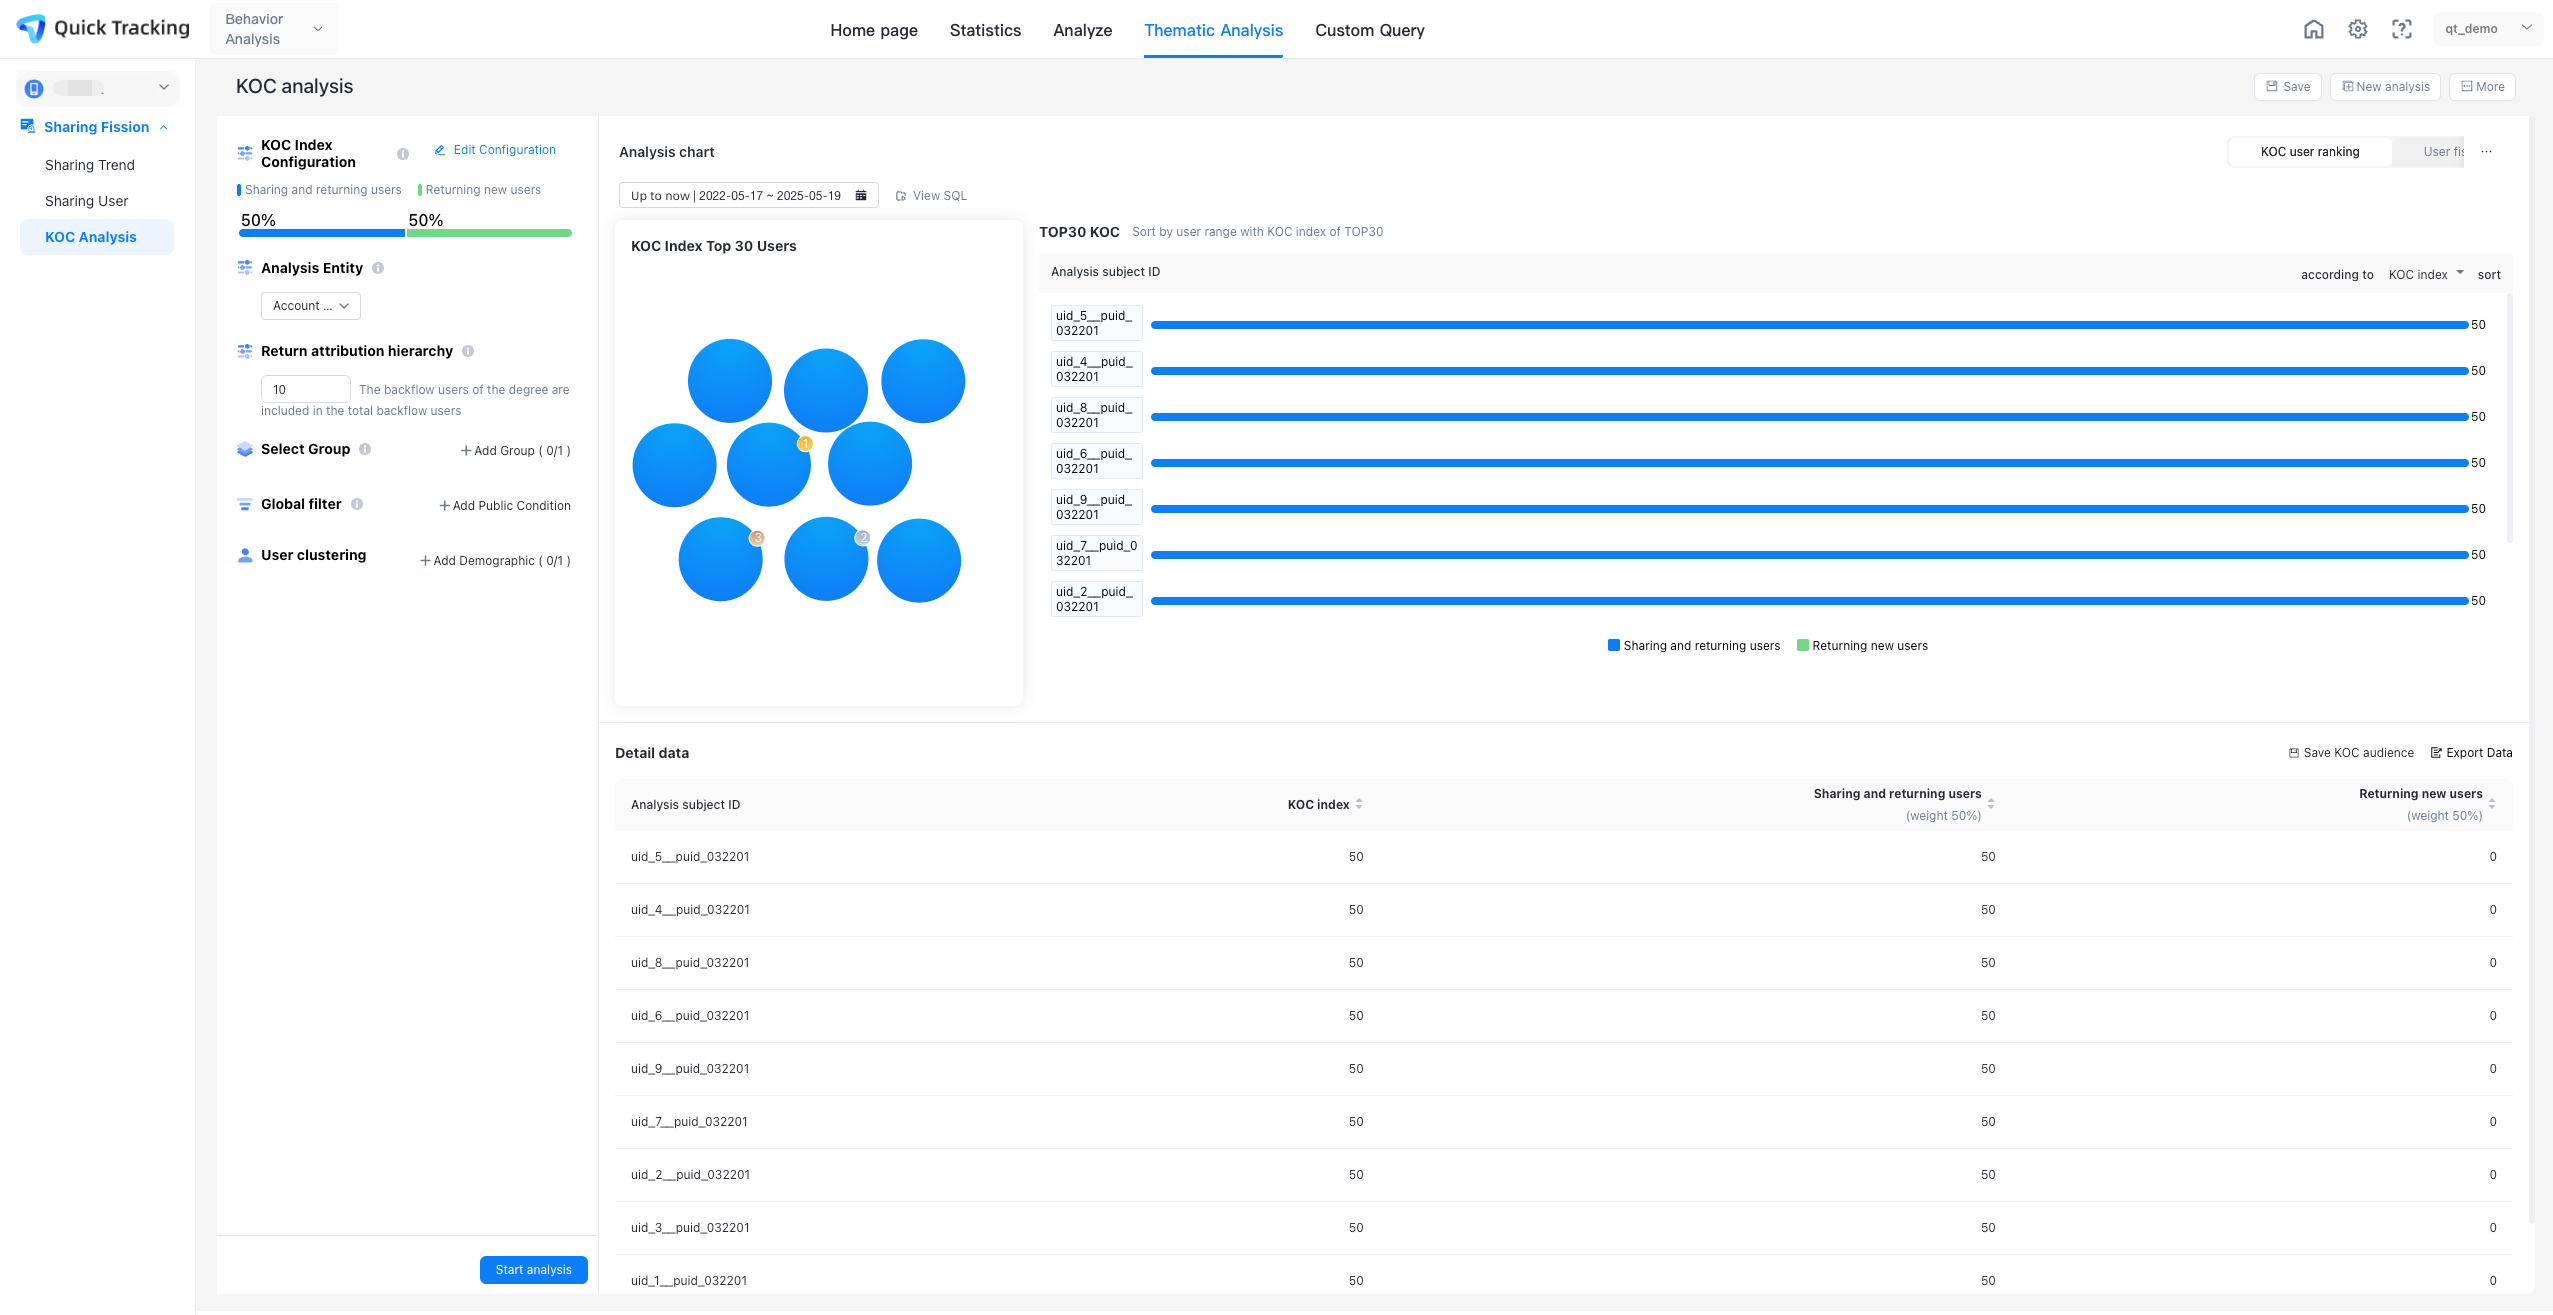
Navigate to Thematic Analysis > Sharing Fission > KOC Analysis. The page is divided into an analysis condition area (left) and a chart display area (right).
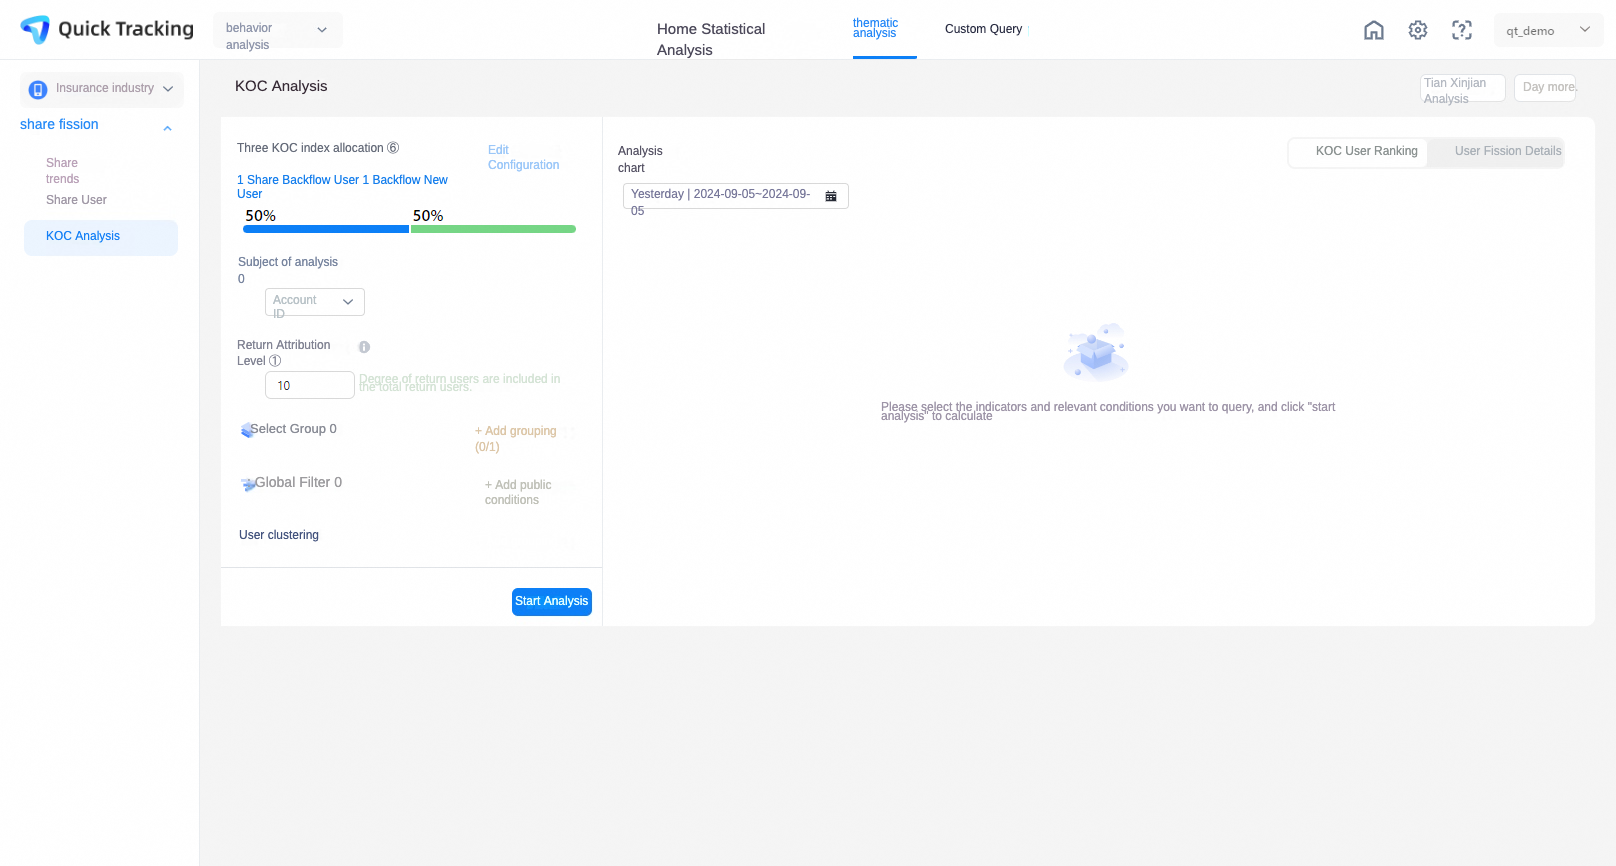
Configure the KOC index
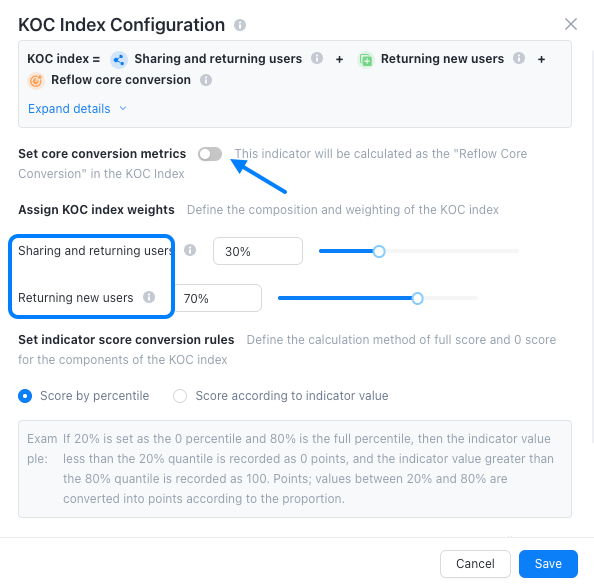
In the KOC Index Configuration section, click Edit Configuration. The KOC Index Configuration dialog box appears.
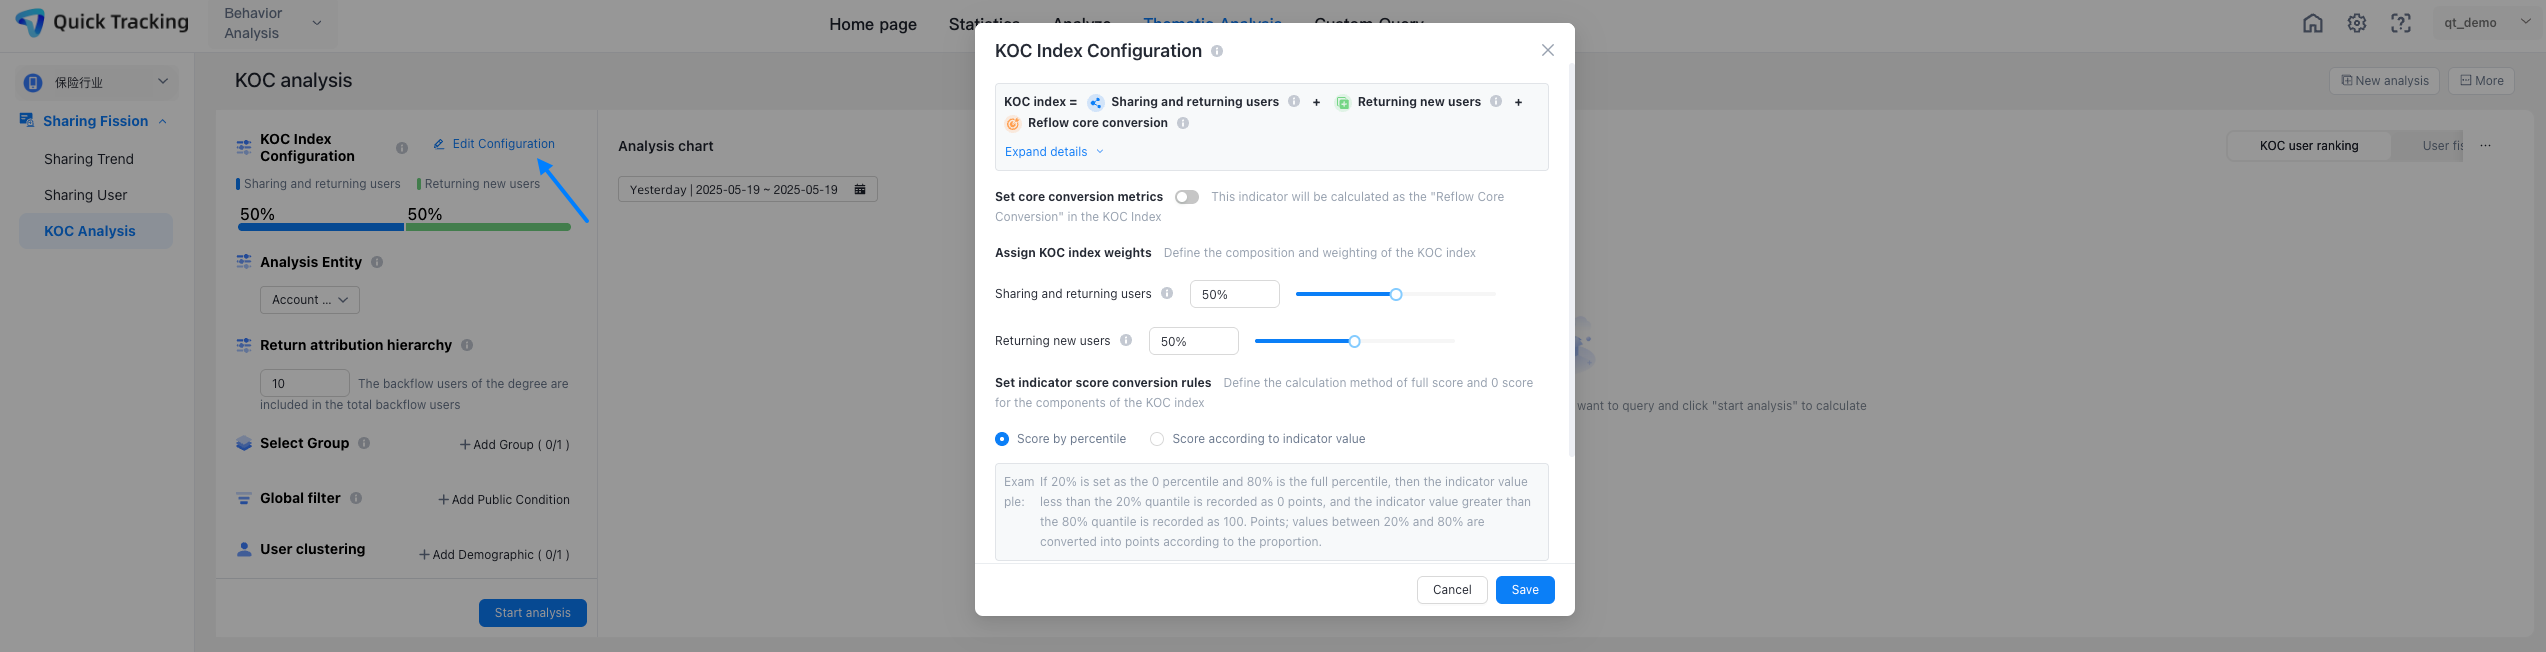
-
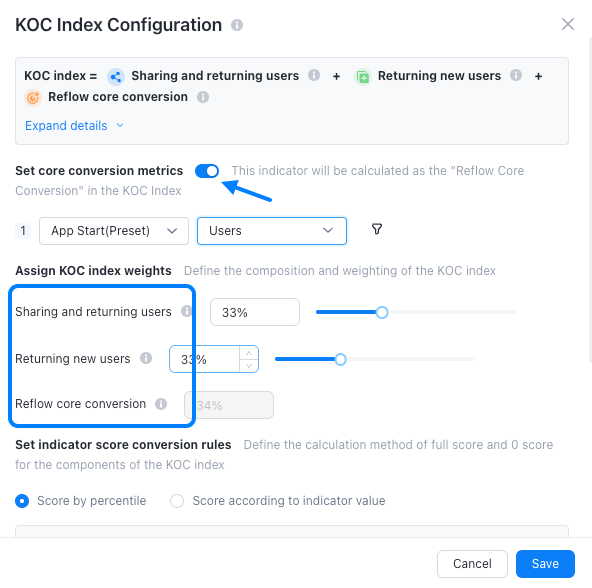
Set core conversion metrics: Enable the Core Conversion Metrics switch to add a custom conversion event. Select the event, then choose an attribute and computation method — the same way you configure event analysis.
-
Assign KOC index weights:
When core conversion metrics are enabled: assign weights to Returning Users, Returning New Users, and Returning Core Conversions. The three weights must sum to 100%.
When core conversion metrics are disabled: the KOC index is calculated from Returning Users and Returning New Users only.
-
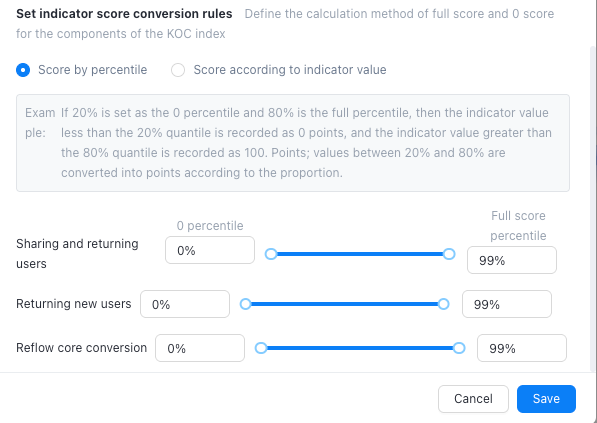
Set metric score conversion rules
Choose Score by Percentile or Score by Value to map each metric's raw value to a 0–100 score.
-
Score by Percentile: Maps the raw metric value to 0–100 based on its percentile rank across all users.
Example: Set the 20th percentile as the zero score and the 80th percentile as the perfect score. Values at or below the 20th percentile score 0; values at or above the 80th percentile score 100; values in between are scaled proportionally.
For each metric, configure a start percentile (zero score) and an end percentile (perfect score).
-
Score by value: Maps the raw metric value to 0–100 based on absolute thresholds you set.
Example: Set 10 as the zero-score threshold and 200 as the perfect-score threshold. Values ≤10 score 0; values ≥200 score 100; values between 10 and 200 are scaled proportionally.
Enter specific threshold values for each metric. Values must be positive numbers with up to two decimal places.
-
Set analysis conditions
-
Analysis entity: Connects sharing and returning behaviors by the identifier you choose. Defaults to account ID.
Device ID: The unique ID QuickTracking generates for each device.
Account ID: The user account ID you pass in through the SDK, used to uniquely identify a user.
Attribution level: Determines how many referral depths the KOC index covers. Level 1 counts only direct returning users; level 10 counts all users brought back from depth 1 through 10.
Global filtering: Filter across all events by shared common attributes.
User cohort: Restrict the analysis to a specific cohort. For instructions on creating cohorts, see Audience Management.
-
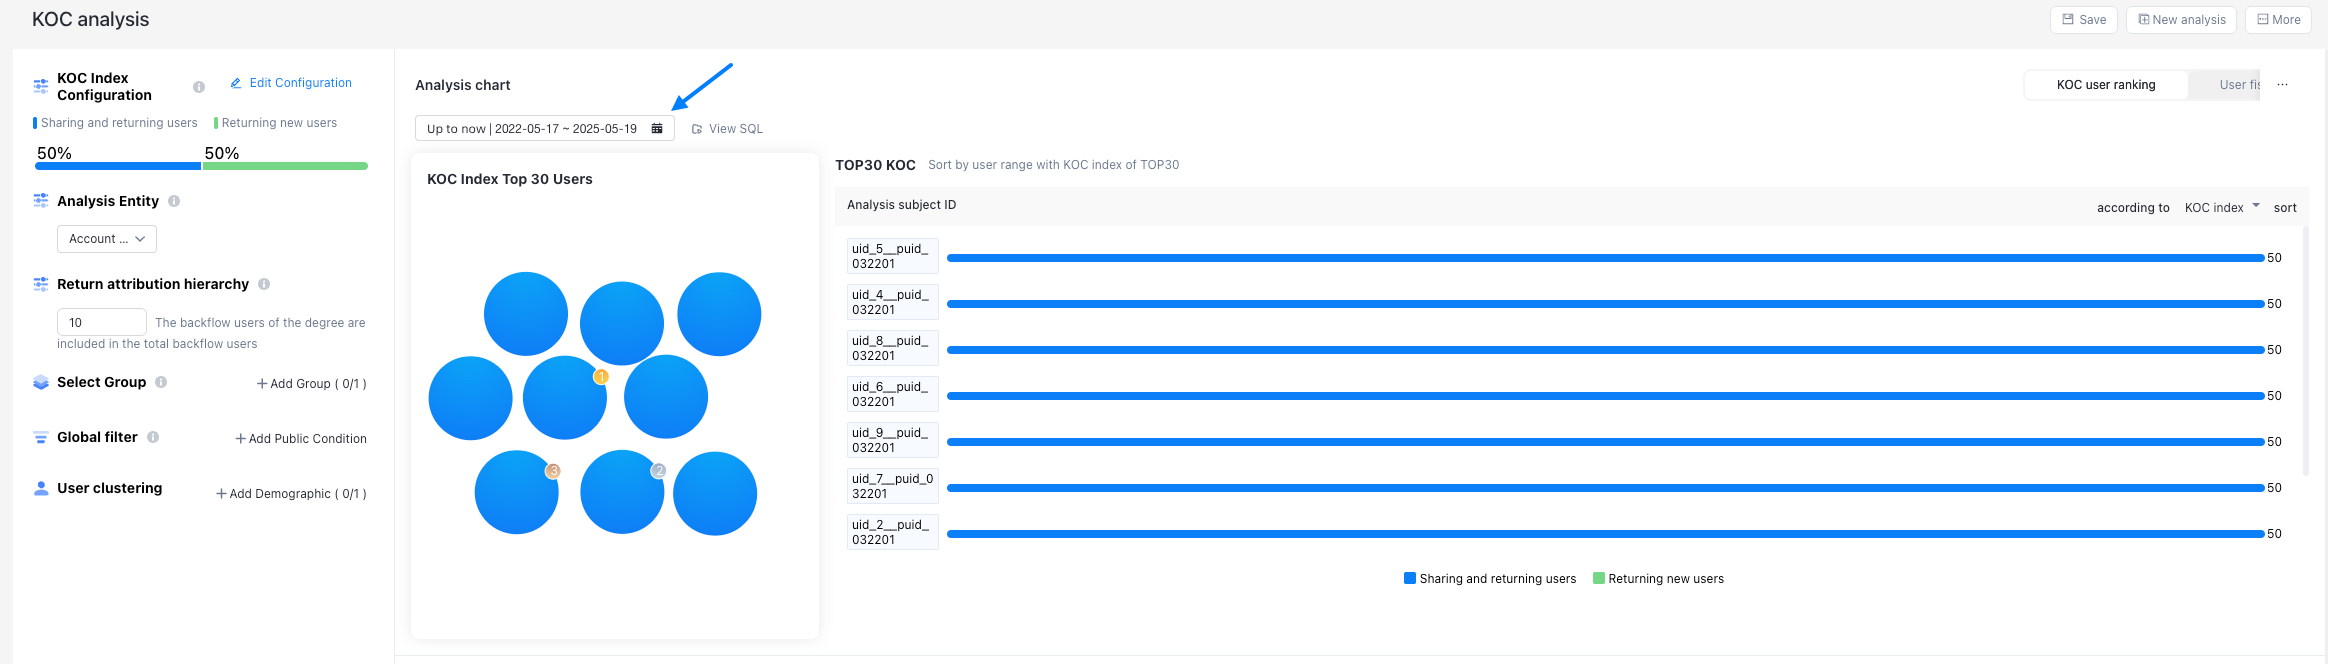
Time selection: Click OK to confirm your filter conditions. The chart defaults to the past 7 days. Change the time range using the selector above the chart.
KOC user ranking chart
Switch between KOC User Ranking and User Fission Details using the tab in the upper-right corner.
-
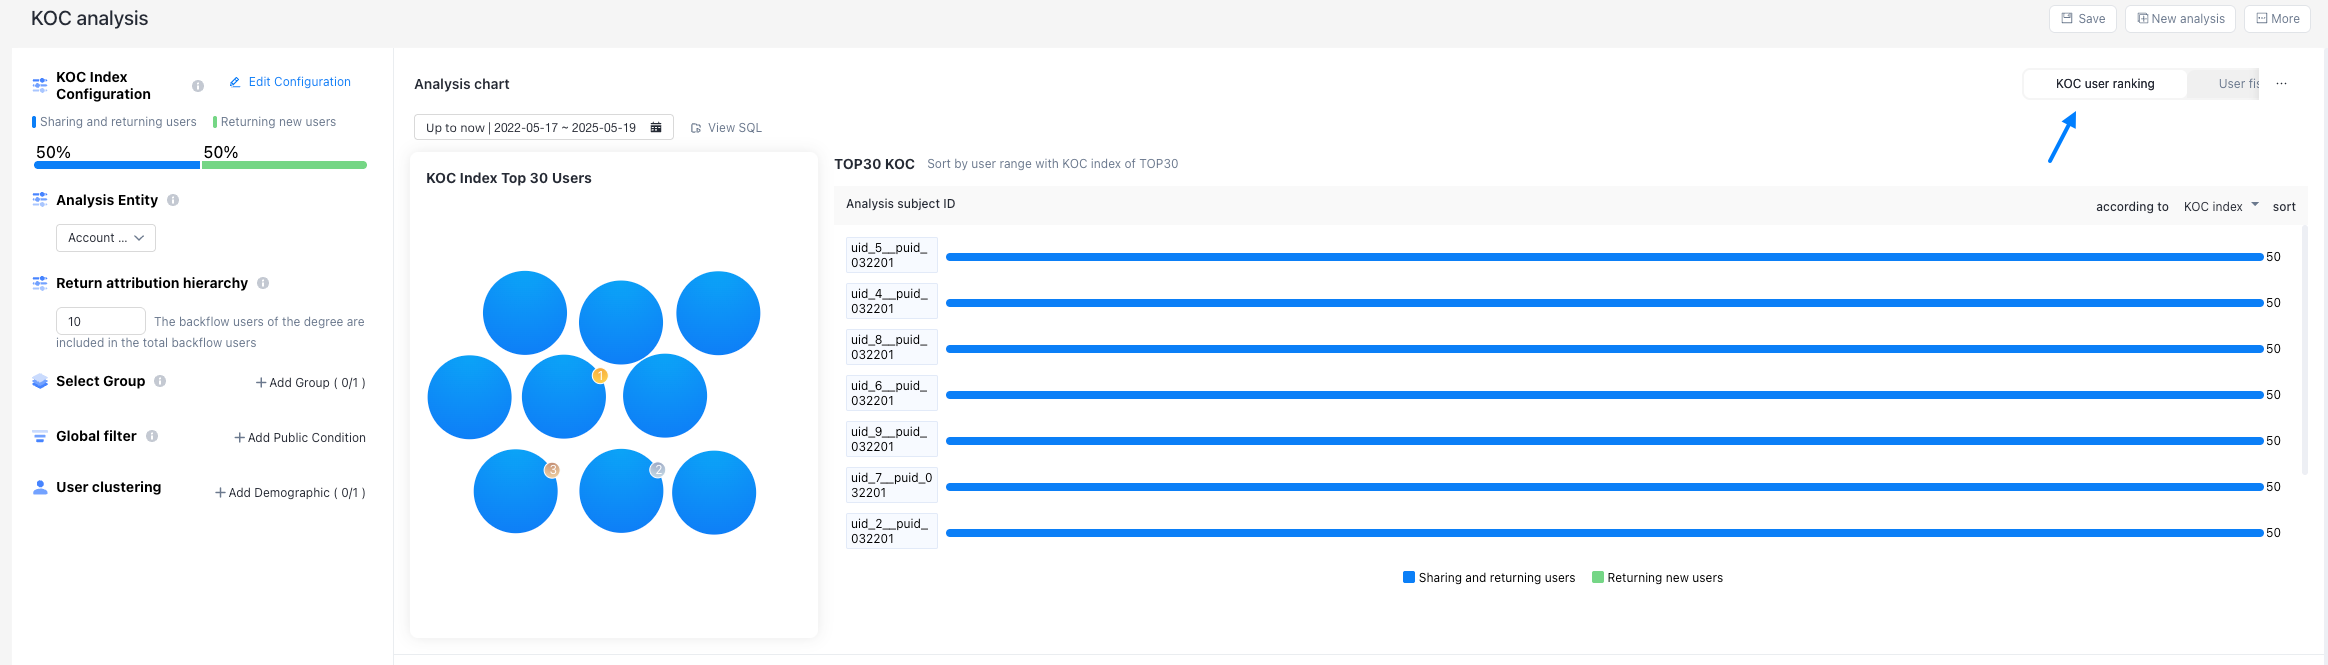
The KOC user ranking view includes a scatter chart and a ranking chart.
Scatter chart: Displays the top 30 users by KOC index.
Hover over a user's circle to highlight it and see the analysis entity ID and KOC index in a tooltip.
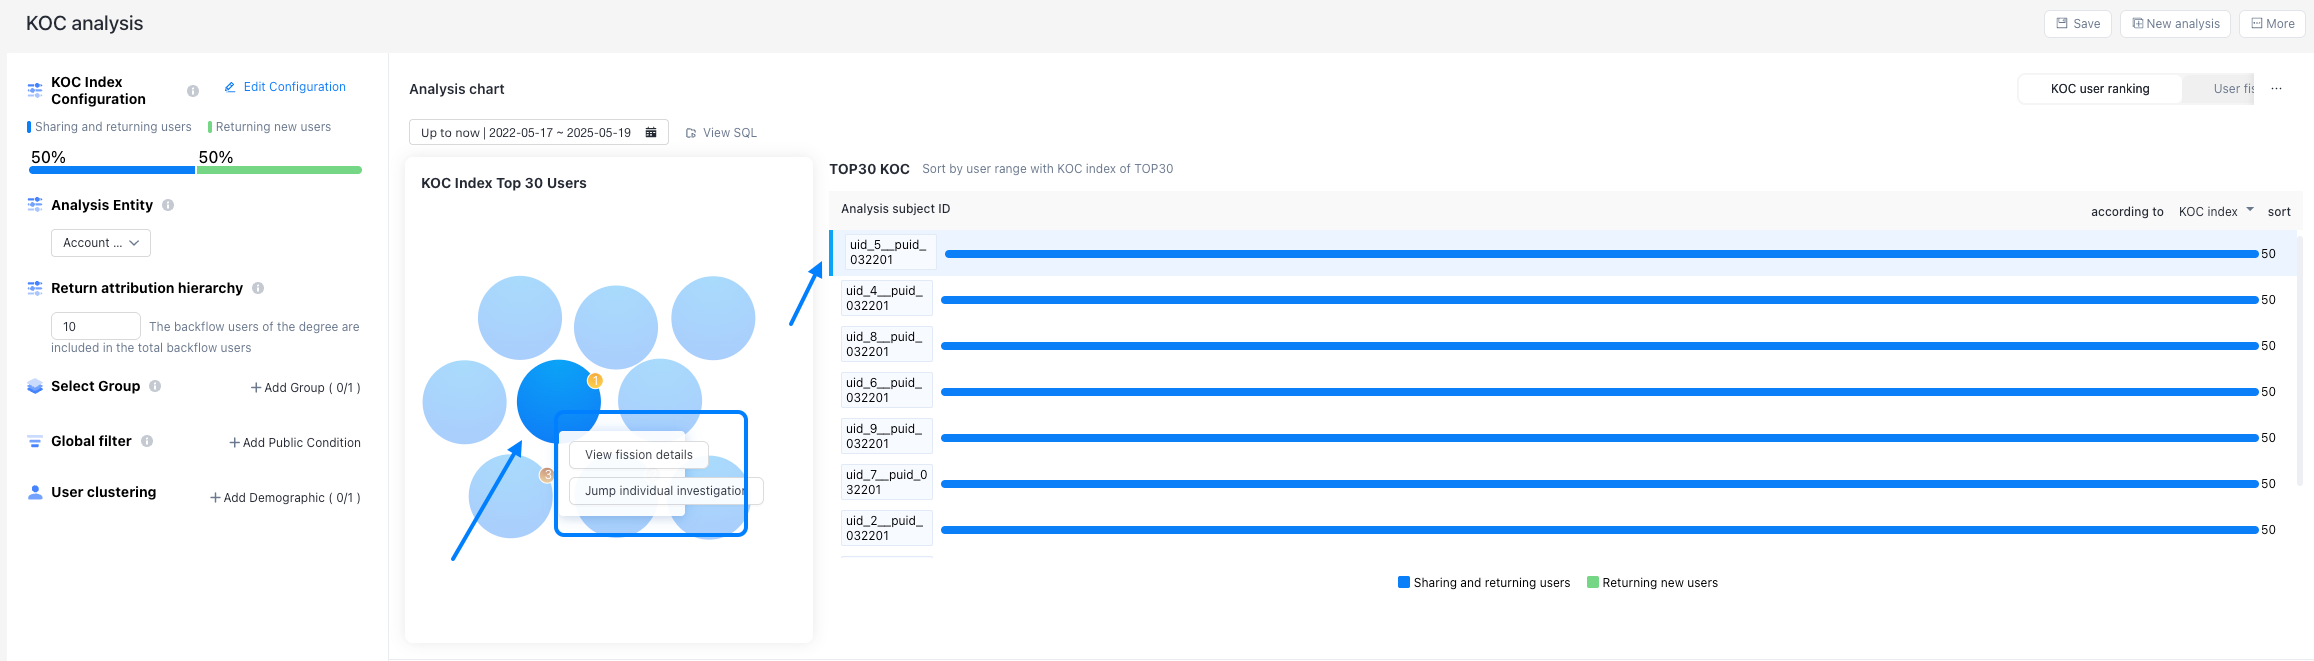
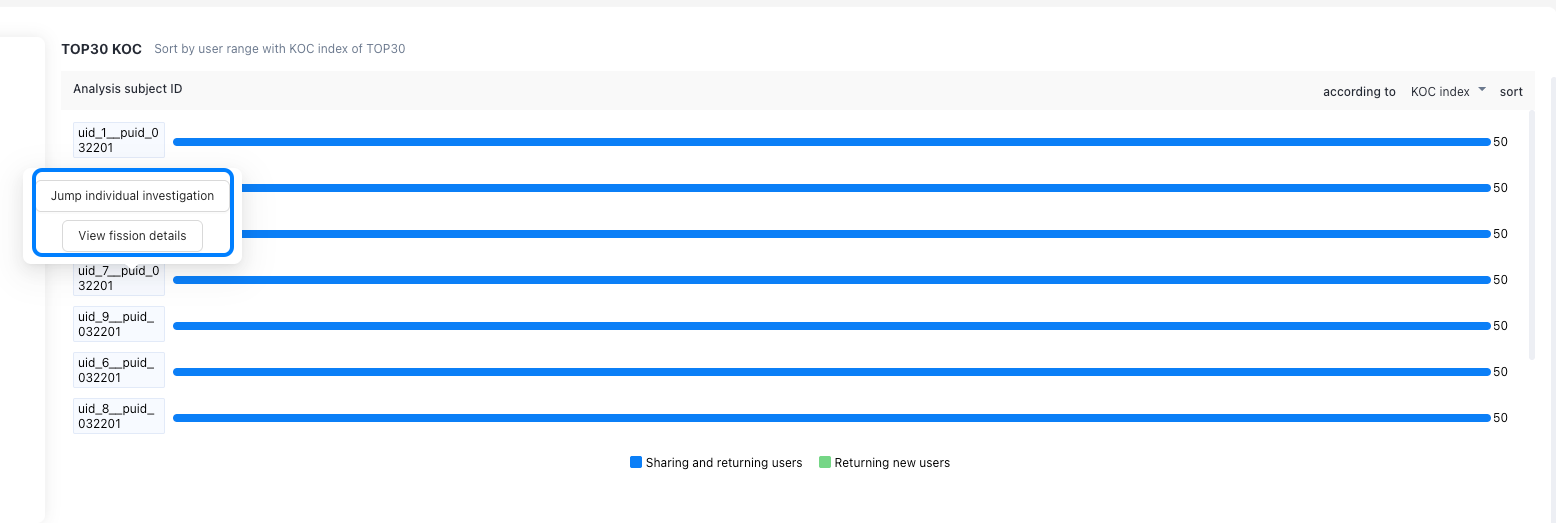
Click a user's circle to locate the user in the ranking chart. A popup appears with two navigation options: Jump to user fission details to open the fission detail chart for that user, or Jump to individual drill-down to open the user's individual detail page.
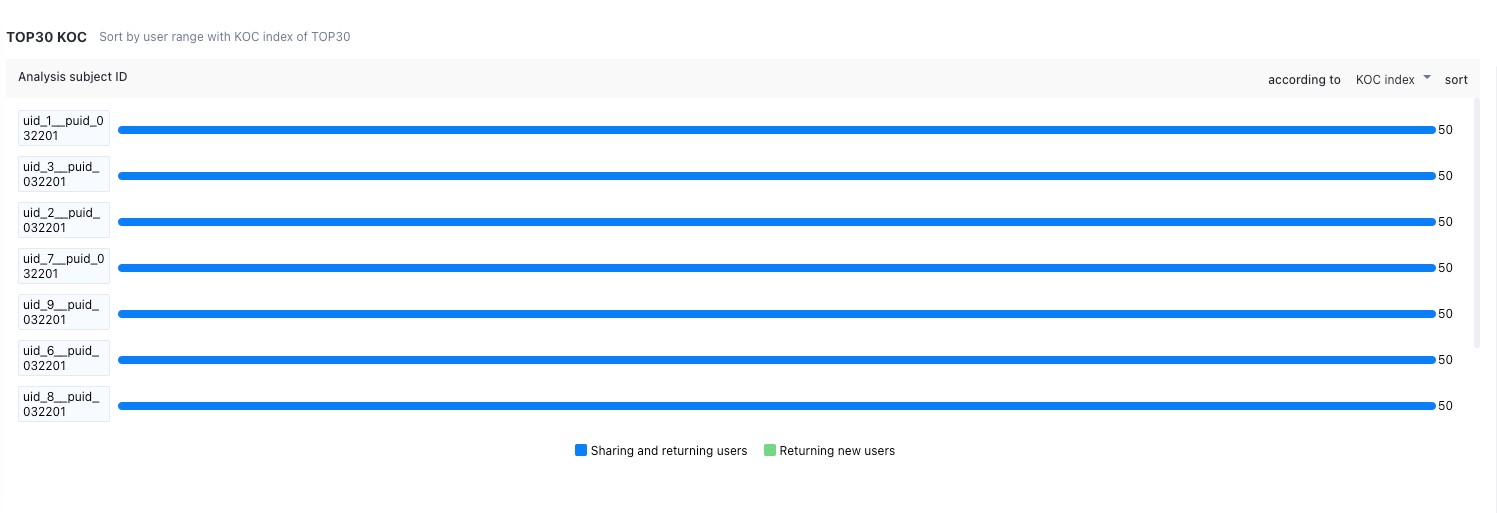
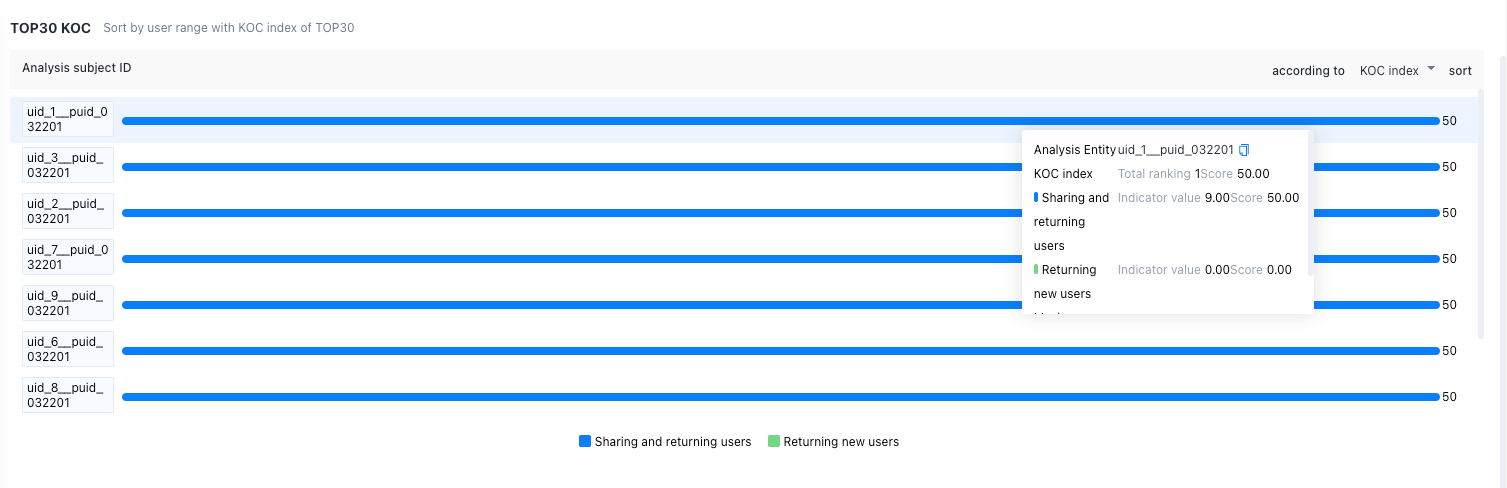
Ranking chart: Lists the top 30 users by KOC index in descending order. The users in the list match the circles in the scatter chart.
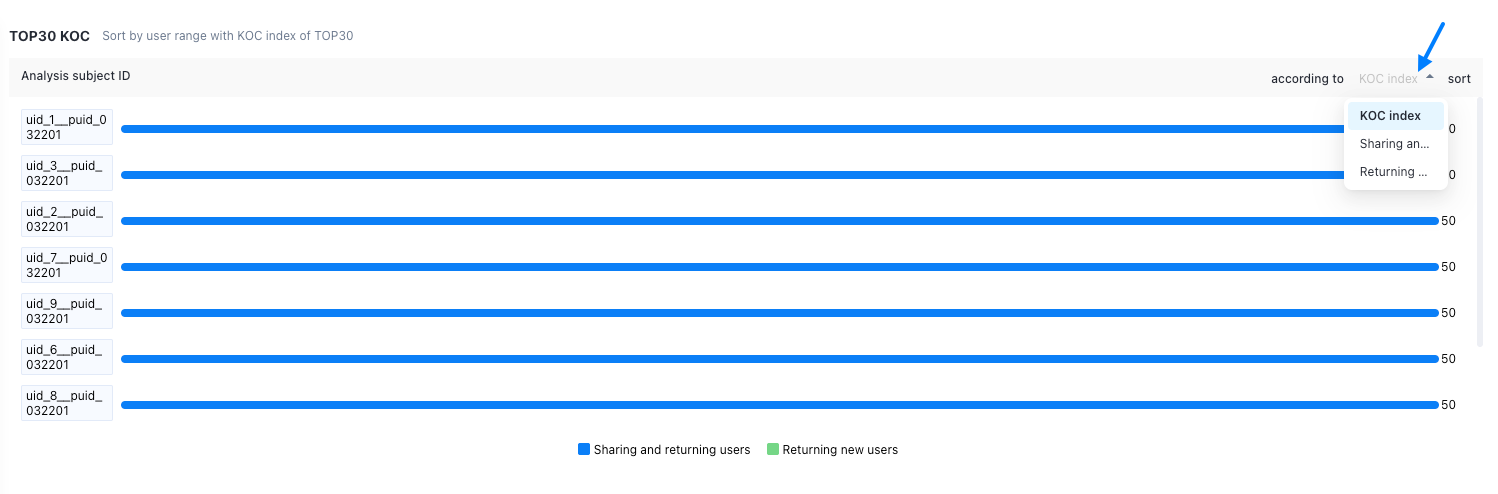
Sort the list by KOC Index, Returning Users, or Returning New Users.
Click a user row to see two options: Jump to individual drill-down opens the user's individual detail page; View fission details opens the fission detail chart for that user.
Hover over a user row to see:
Analysis entity: The user's account ID or device ID.
KOC index: The composite score calculated using the configured KOC index rules.
Returning users: The cumulative count of all returning users brought back by this user.
Returning new users: The cumulative count of new users among all returning users brought back by this user.
Maximum referral depth: The deepest sharing tier reached by this user's referral chain.
User fission details
Click the tab in the upper-right corner to switch to the user fission details view.
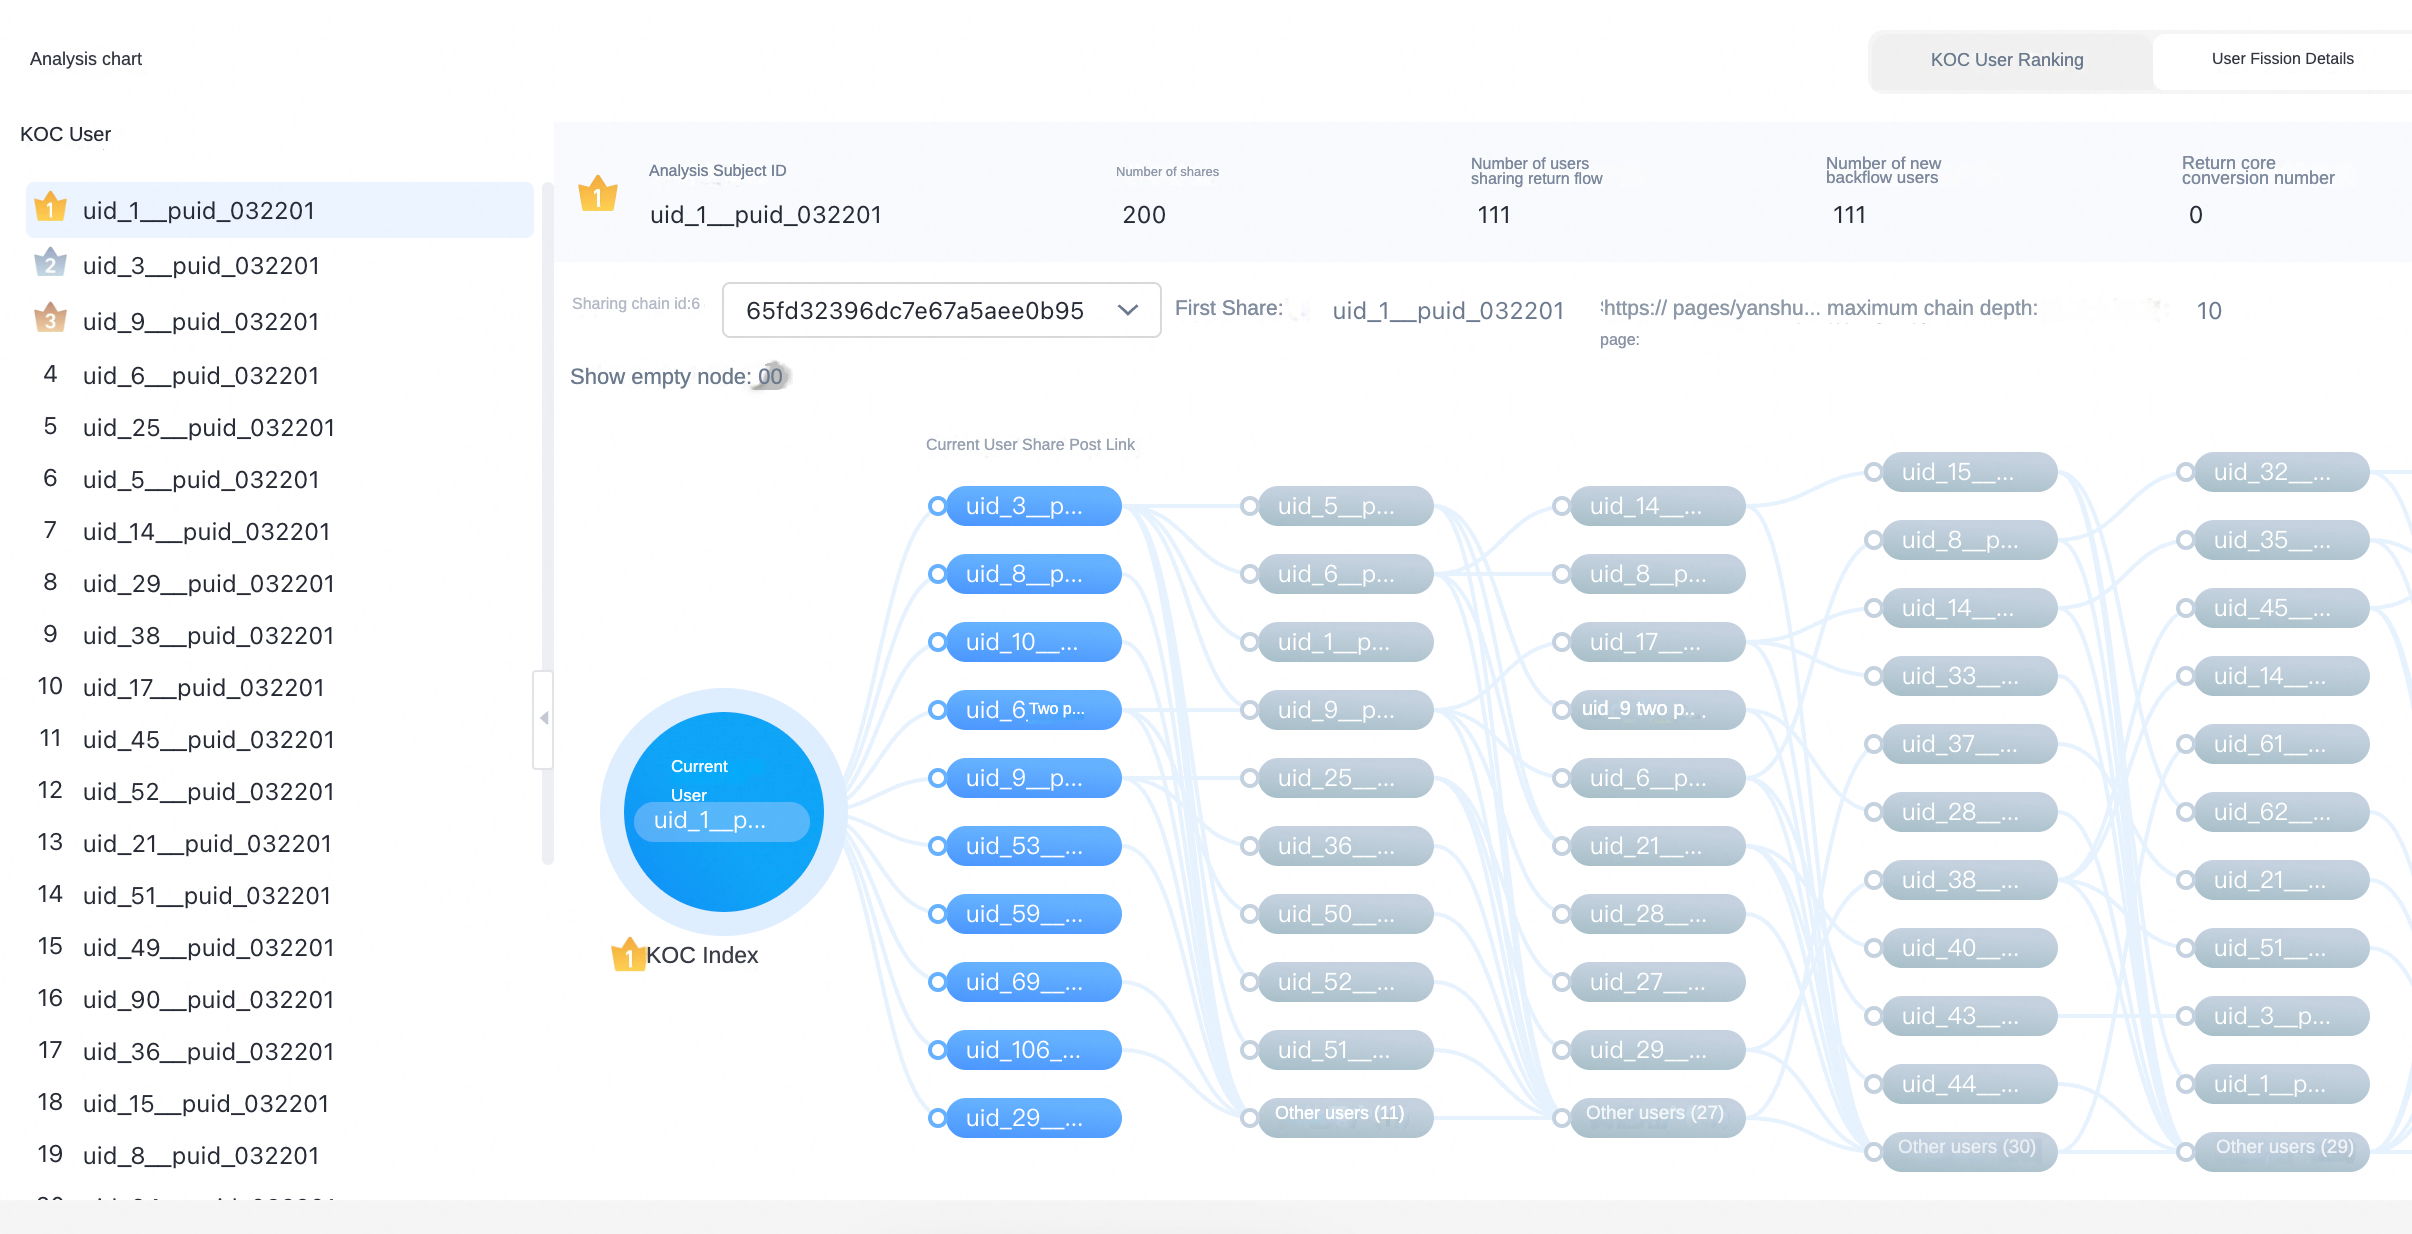
KOC users: The left panel lists the top 30 users by KOC index. Select a user to view their fission details.
-
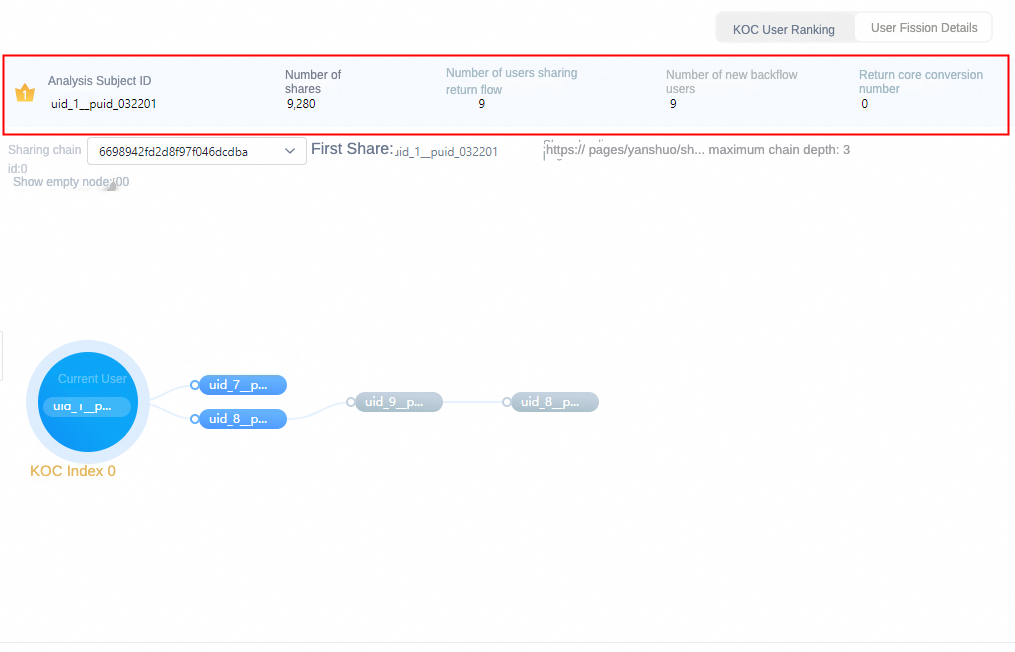
Current user details: Shows the key metrics for the selected user.
Analysis entity ID: The current user's analysis entity ID.
Sharing times: Total number of shares by this user under the current filter conditions.
Returning users: Total returning users across all referral chains for this user.
Returning new users: Total returning new users across all referral chains for this user.
Returning core conversions: Sum of the custom conversion metric across all referral chains for this user.
-
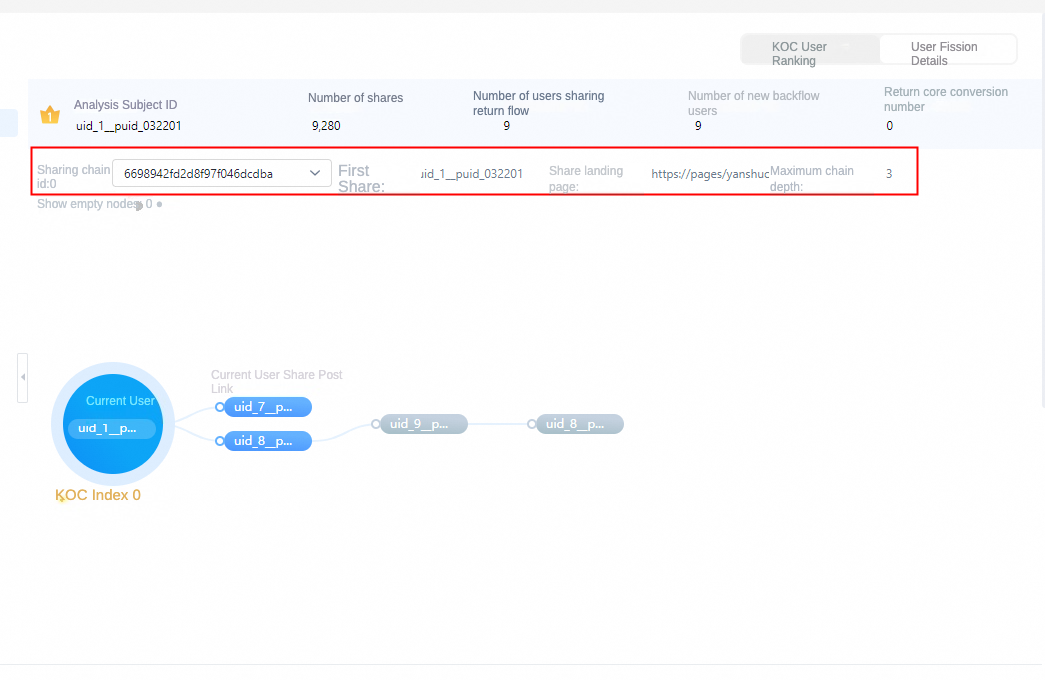
Referral chain details
Sharing chain ID: The ID of the referral chain that the sharing event belongs to.
First sharer ID: The ID of the first user who initiated the referral chain.
Landing page: The URL of the landing page associated with the referral chain.
Maximum chain depth: The deepest referral tier within the chain.
-
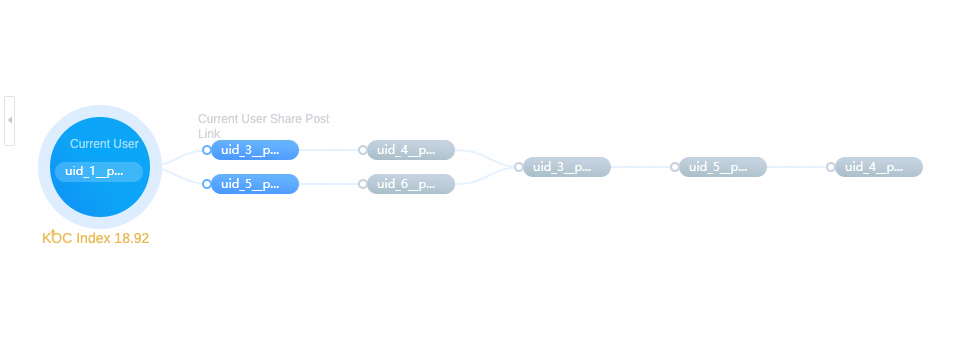
Referral chain fission chart: Visualizes the sharing and returning relationships between the current user and all downstream returning users in the selected referral chain.
Hover over a user node to see the user's device ID, account ID, and the time they returned via sharing.
Nodes in the same column are returning users at the same referral depth. Lines between nodes show the referral relationship between users.
Each referral depth shows up to 10 returning user nodes, ordered by sharing time. Additional users are represented by an Other Users node showing the overflow count.
Enable the Empty Node switch to display nodes where the analysis entity ID has no value in the referral chain.
View detailed data
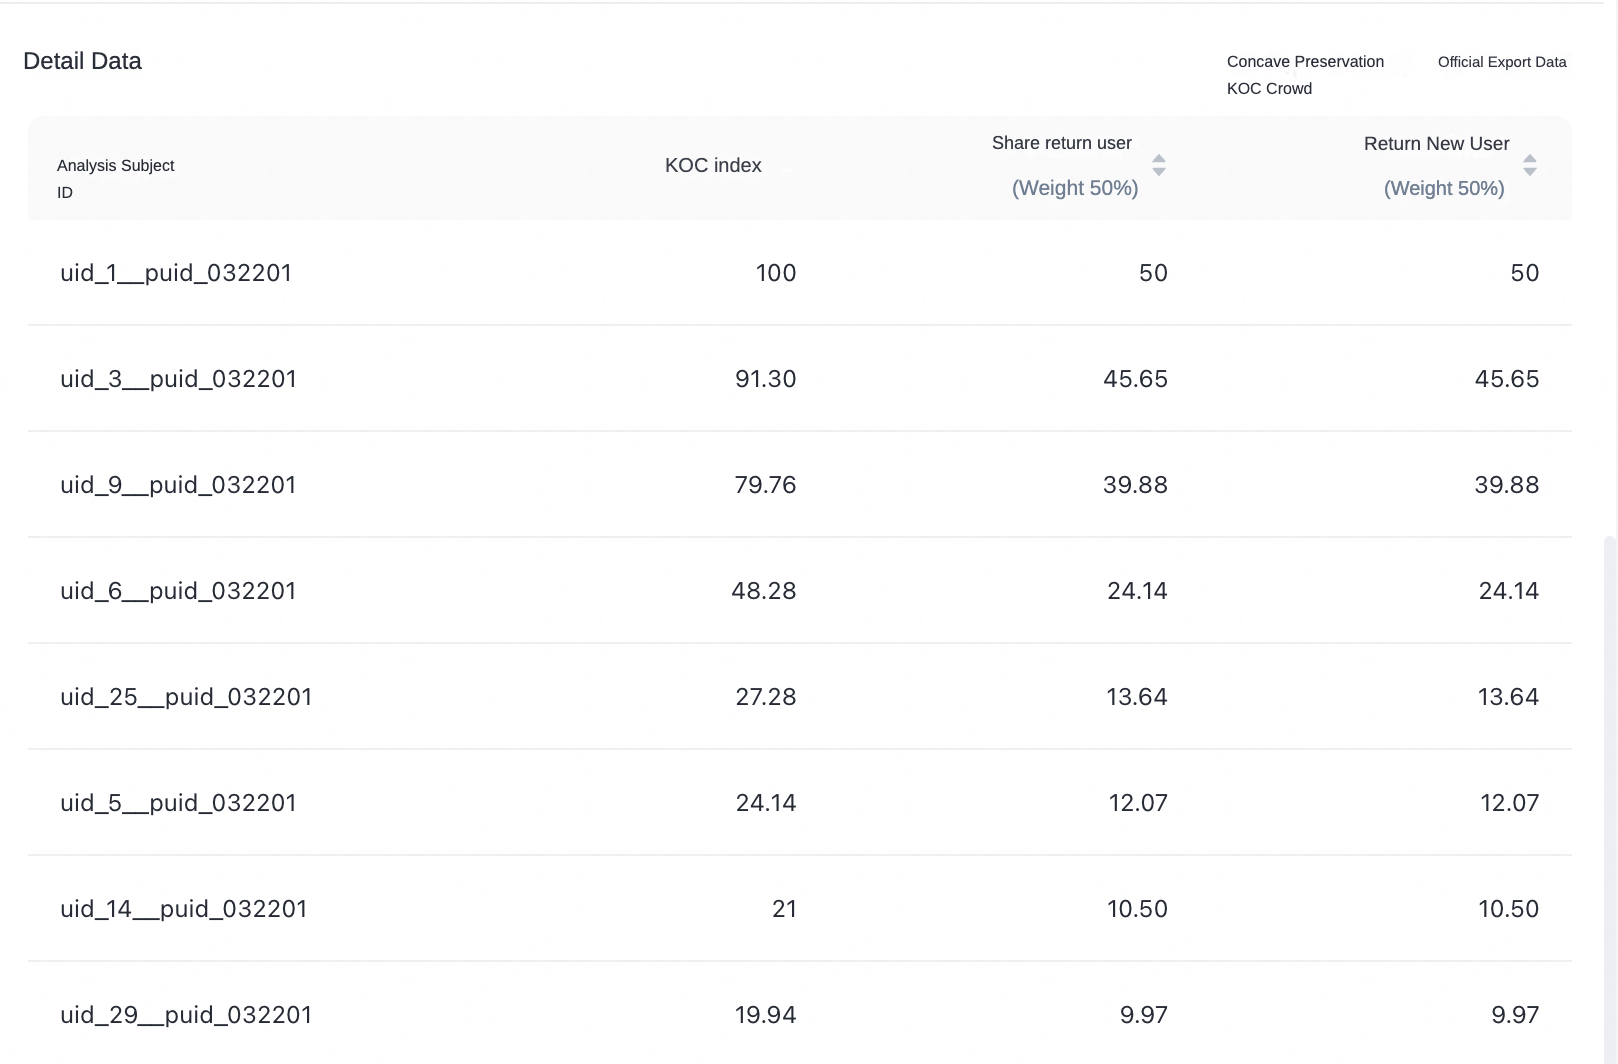
The detailed data table shows KOC index metrics for the top 30 users. Click Export Data to download the table as an Excel file.
Save KOC
Above the detailed data table, click Save KOC. Enter an audience name and visibility scope, then save. This creates an audience from the current top-30 KOC users.
Save data to a report
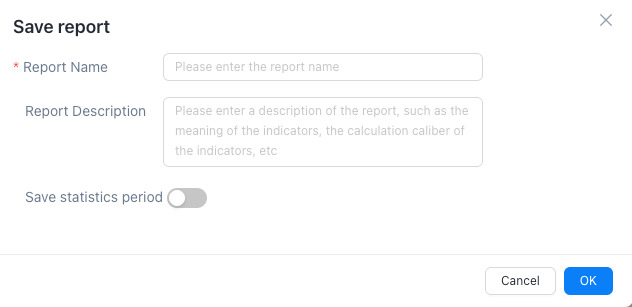
Click Save in the upper-right corner. In the Save Report dialog box, enter the required information and click OK to save the data to the report list.
Add a report to a dashboard
Click Add to Dashboard to add the saved report to a dashboard. Select the dashboard type, the target dashboard, the chart display type, and the layout, then click OK.
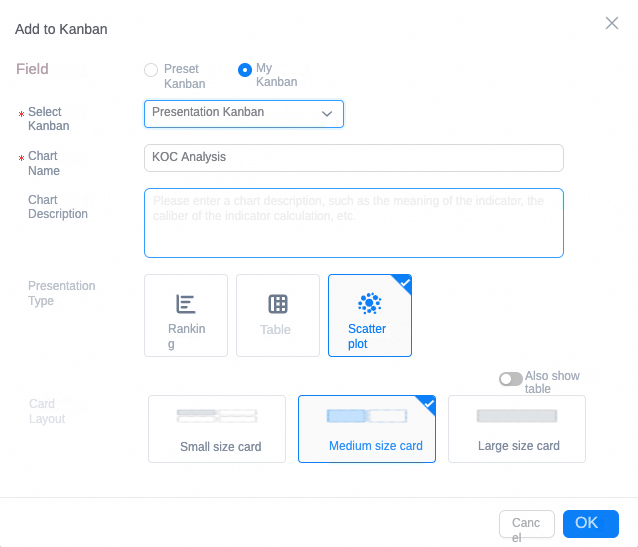
After the report is added, click Jump to open the dashboard.