This document describes JavaScript (JS) error monitoring in EMAS. It explains how to use this feature to efficiently monitor and resolve JS errors, and improve application stability using comprehensive error collection and administration techniques.
Overview
JavaScript (JS) errors are one of the most common problems in Web and H5 applications. They are a major cause of blank screens and performance issues, which significantly impact business stability and user experience. The EMAS Web/H5 monitoring software development kit (SDK) can capture various errors in your application. By collecting detailed error information and stack traces, the SDK helps developers quickly identify the root cause of issues and resolve them efficiently.
Error types
JS errors are divided into two main types:
Error: Errors in synchronous code execution or asynchronous errors that do not involve promises, such as syntax errors and reference errors, trigger an Error event.
Unhandledrejection: This event is triggered when a promise is rejected in an asynchronous operation but is not handled by a catch block.
Our plugin aggregates similar errors to improve monitoring efficiency. This helps developers understand and monitor exceptions more effectively.
Scenarios
Monitor various exceptions that occur during JS script execution while developing and maintaining large-scale web applications and H5 pages within native applications.
Track new script errors or exceptions caused by environmental differences after code is released.
Analyze and compare script errors across different versions and environments to guide code optimization and improve user experience.
Preparations
Before you can use the JS error monitoring feature, you must integrate the EMAS Application Performance Management (APM) SDK. For more information, see SDK integration.
Enable the reporting switch for the JS error module. For more information, see Reporting configuration.
Features
Trend analysis
The JS error trend graph shows the trend of error metrics based on the filter conditions. You can use it to view error fluctuations and their impact.
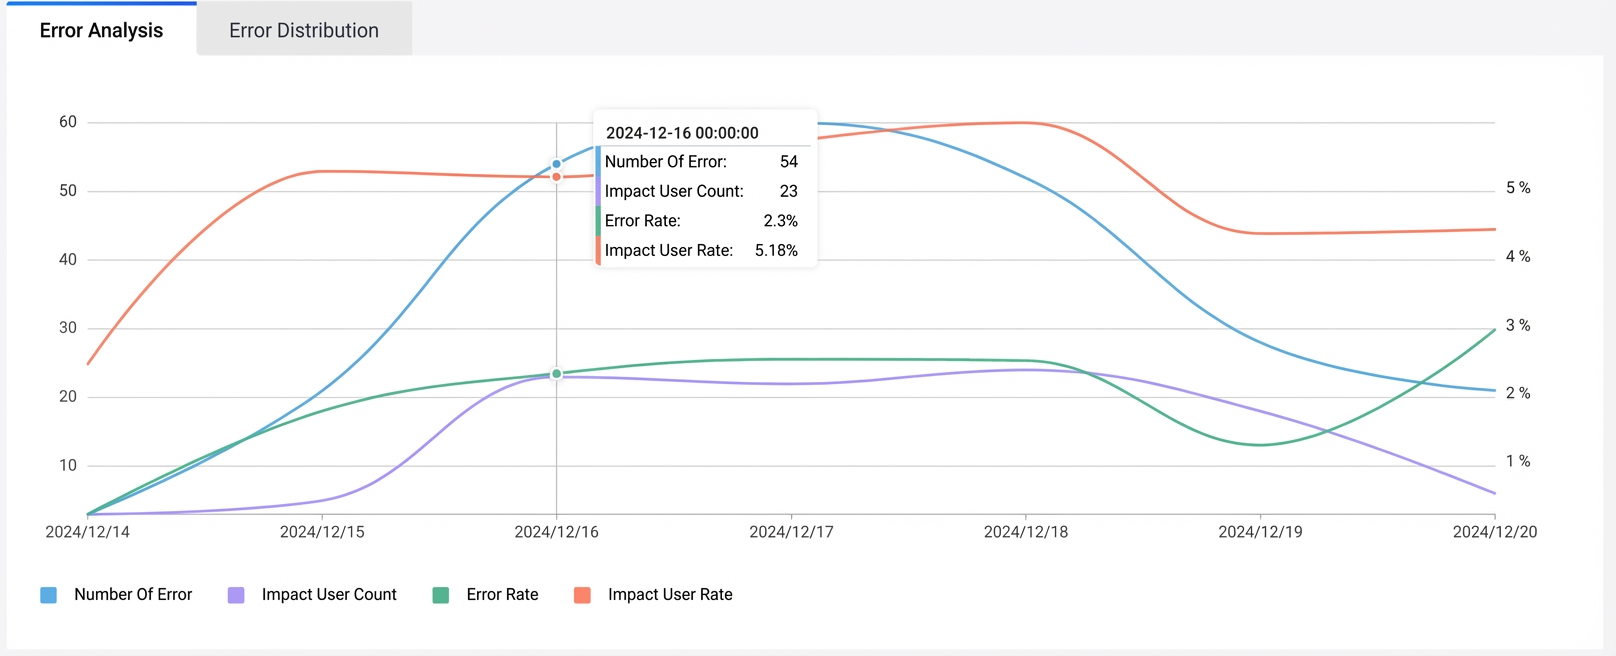
Metric |
Description |
JS error count |
The number of times a JS error occurred. |
JS error rate |
JS error count / Total PV |
Affected users by JS errors |
The number of unique visitors (UV) who experienced a JS error. |
Affected user rate by JS errors |
UV with JS errors / Total UV |
If the user_id field is not reported, the "Affected users" and "Affected user rate" metrics cannot be calculated.
Distribution analysis
Distribution analysis lets you observe the distribution of JS errors and locate the source of problems using multi-dimensional statistics, such as browser version, operating system version, and device model.
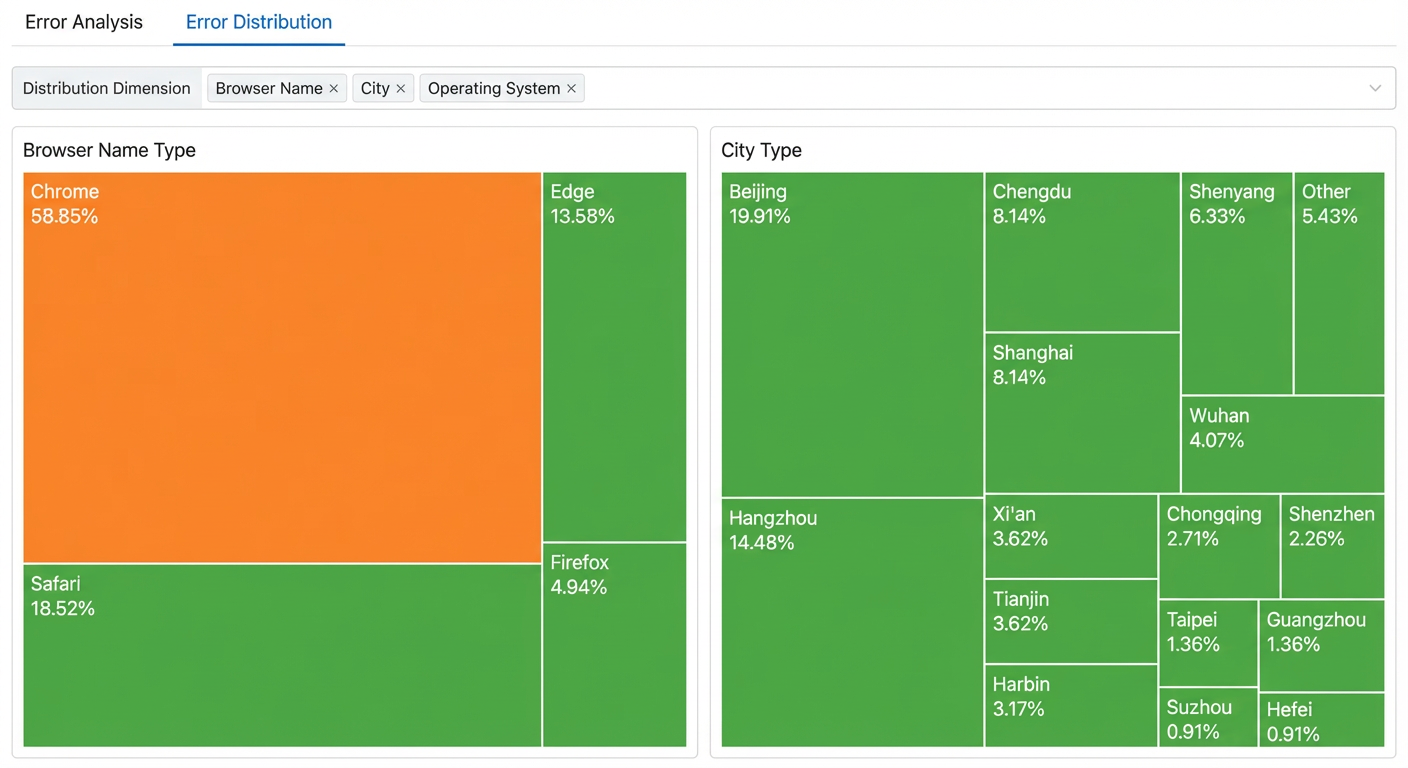
By default, the JS error distribution is displayed by browser, operating system, device model, and city. You can click the Distribution Dimension button to select different dimensions from the drop-down list to replace the default ones. You can select a minimum of one and a maximum of four dimensions.
You can click
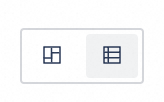 to switch between the distribution ranking view and the list ranking view.
Error list
The JS error list displays aggregated data for the same type of error, including the error name, error count, number of affected users, last occurrence time, and issue status.
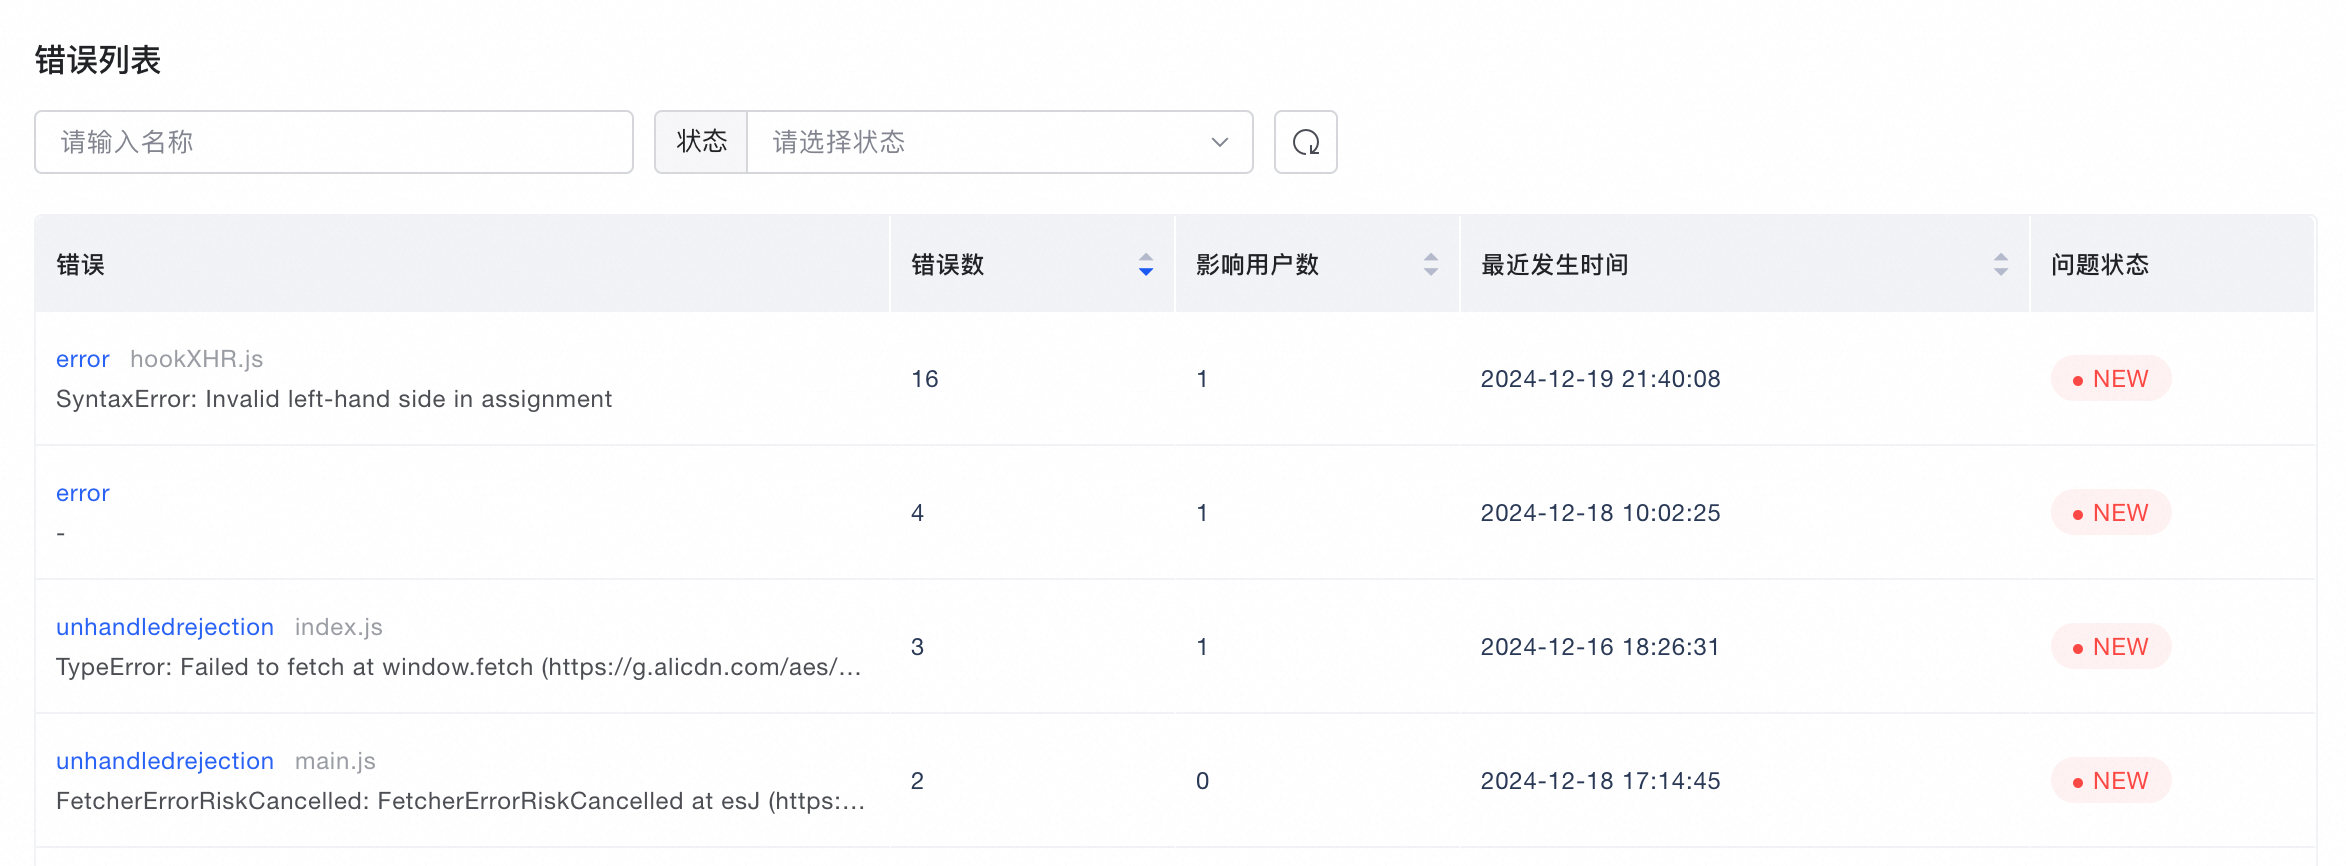
Aggregation method: JS errors are aggregated by error type, error file name, and the first line of the stack.
Sorting: You can sort the metrics. By default, they are sorted by error count in descending order.
View details: You can click an error to go to its error details analysis page.
Error details
The error details page lets you perform a detailed drill-down analysis on a specific type of aggregated error. It provides an overview summary, trend analysis, distribution analysis, and call stack analysis to assist with your investigation. It also provides detailed information for each report received from the client.
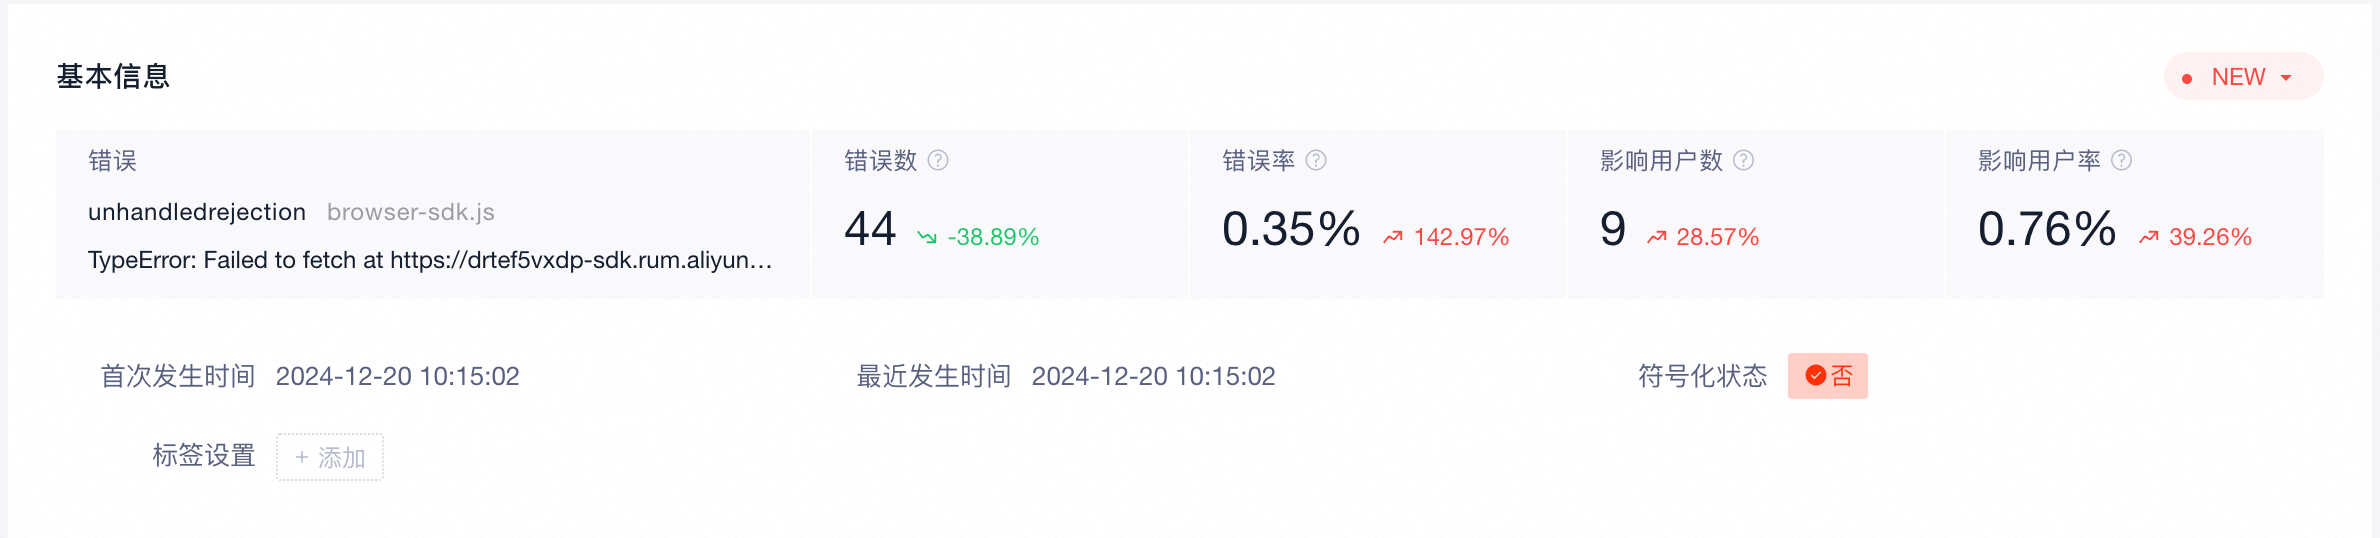
Basic information
Parameter |
Description |
Error name |
The name of the JS error, aggregated by error type and error file name, showing the first line of the stack. |
Error count |
Error count = Total number of times this JS error occurred within the selected time range. |
Error rate |
Error rate = Error count under filter conditions / Total PV under filter conditions. |
Affected users |
Affected users = UV who experienced this JS error under the filter conditions. |
Affected user rate |
Affected device rate = Affected users under filter conditions / Total UV under filter conditions. |
First occurred |
The time of the first occurrence within the selected time range. |
Last occurred |
The time of the last occurrence within the selected time range. |
Symbolication status |
Indicates whether the error has been deobfuscated. |
Tag settings |
Add tags to this error type for easier management. An error message supports up to 10 tags. Each tag can have a maximum of 15 characters. |
Issue status |
The issue status can be modified to help investigate and track whether the issue is resolved.
|
Call stack analysis
This section provides the common call stack for the JS error to help you locate the cause. You can locate the source code using a SourceMap.
If no SourceMap is uploaded, the original stack is displayed. This is the stack information from the raw log uploaded by the client.
If a SourceMap has been uploaded, the parsed stack is displayed. This is the symbolicated stack.
If the SourceMap or parsing is incorrect, you can upload the SourceMap again or click Reparse in the upper-right corner of the details section.
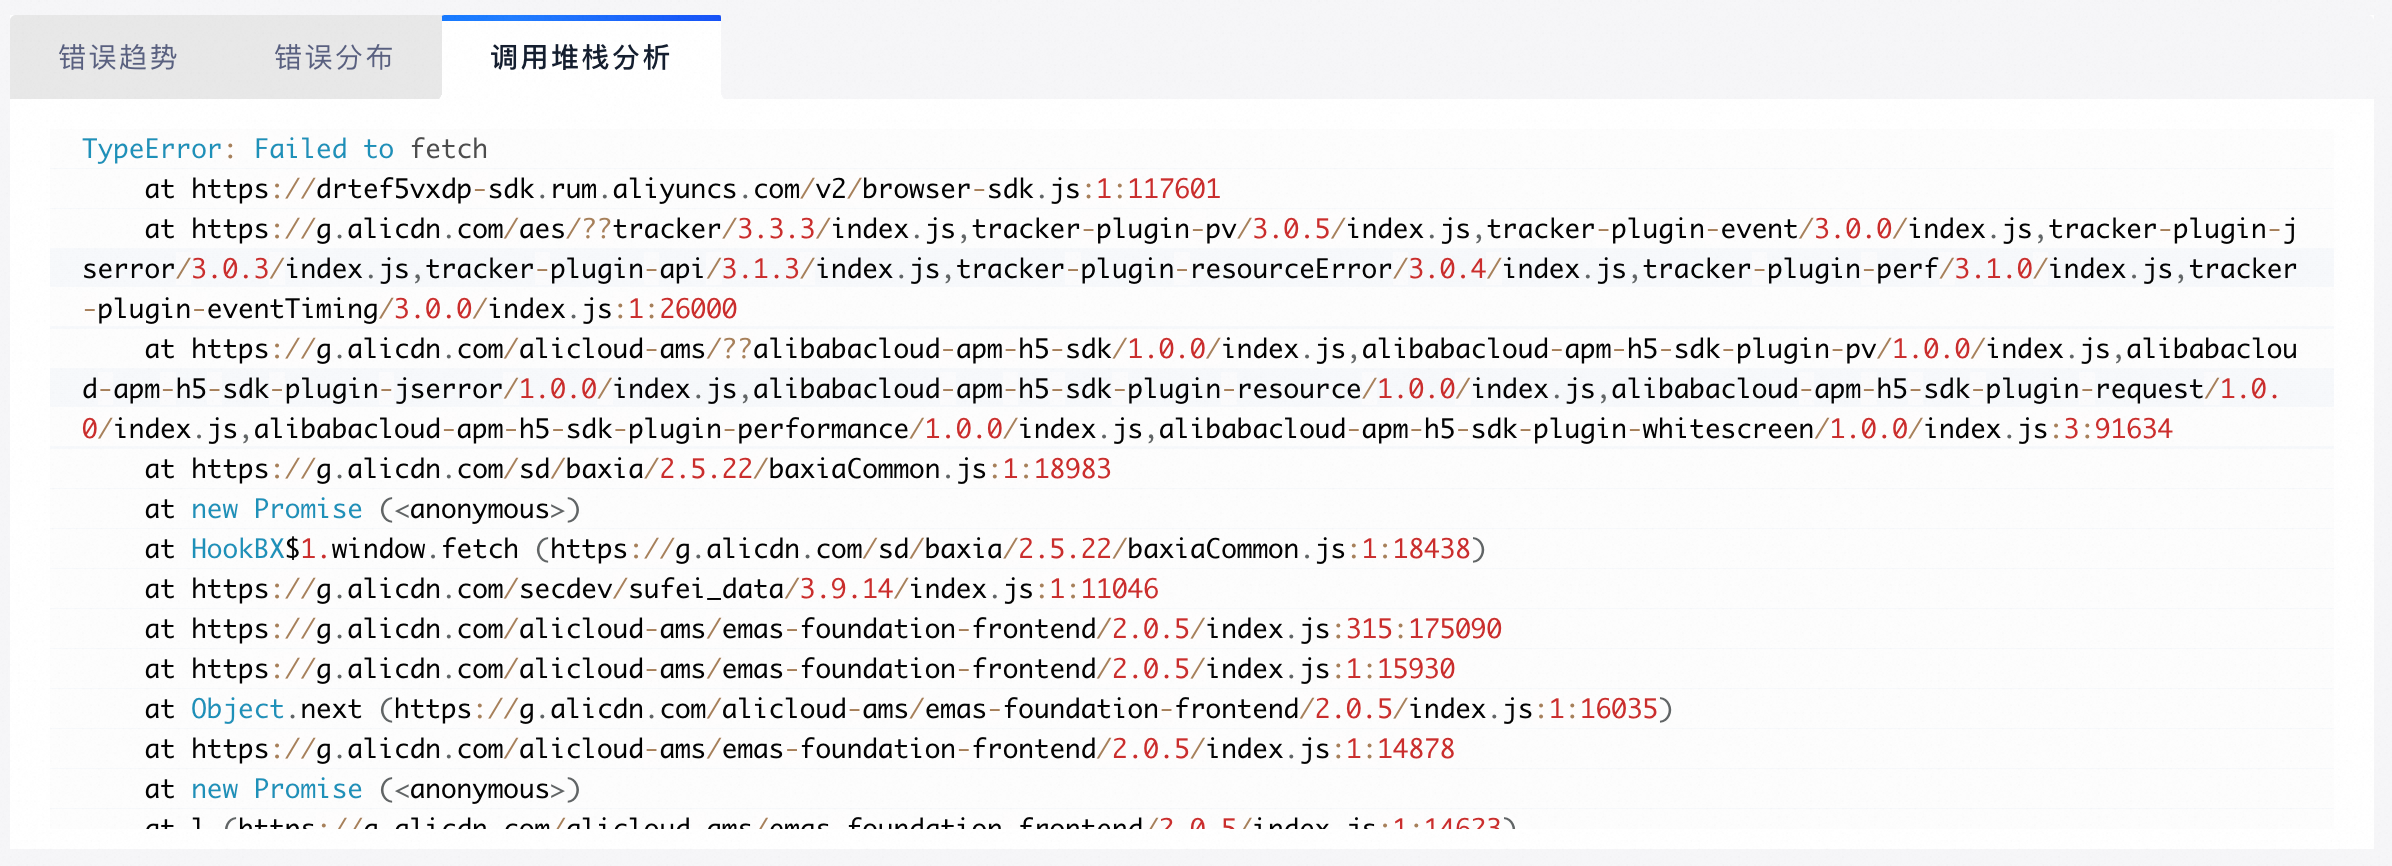
In some scenarios, the stack cannot be collected. For more information, see FAQ > JS errors.
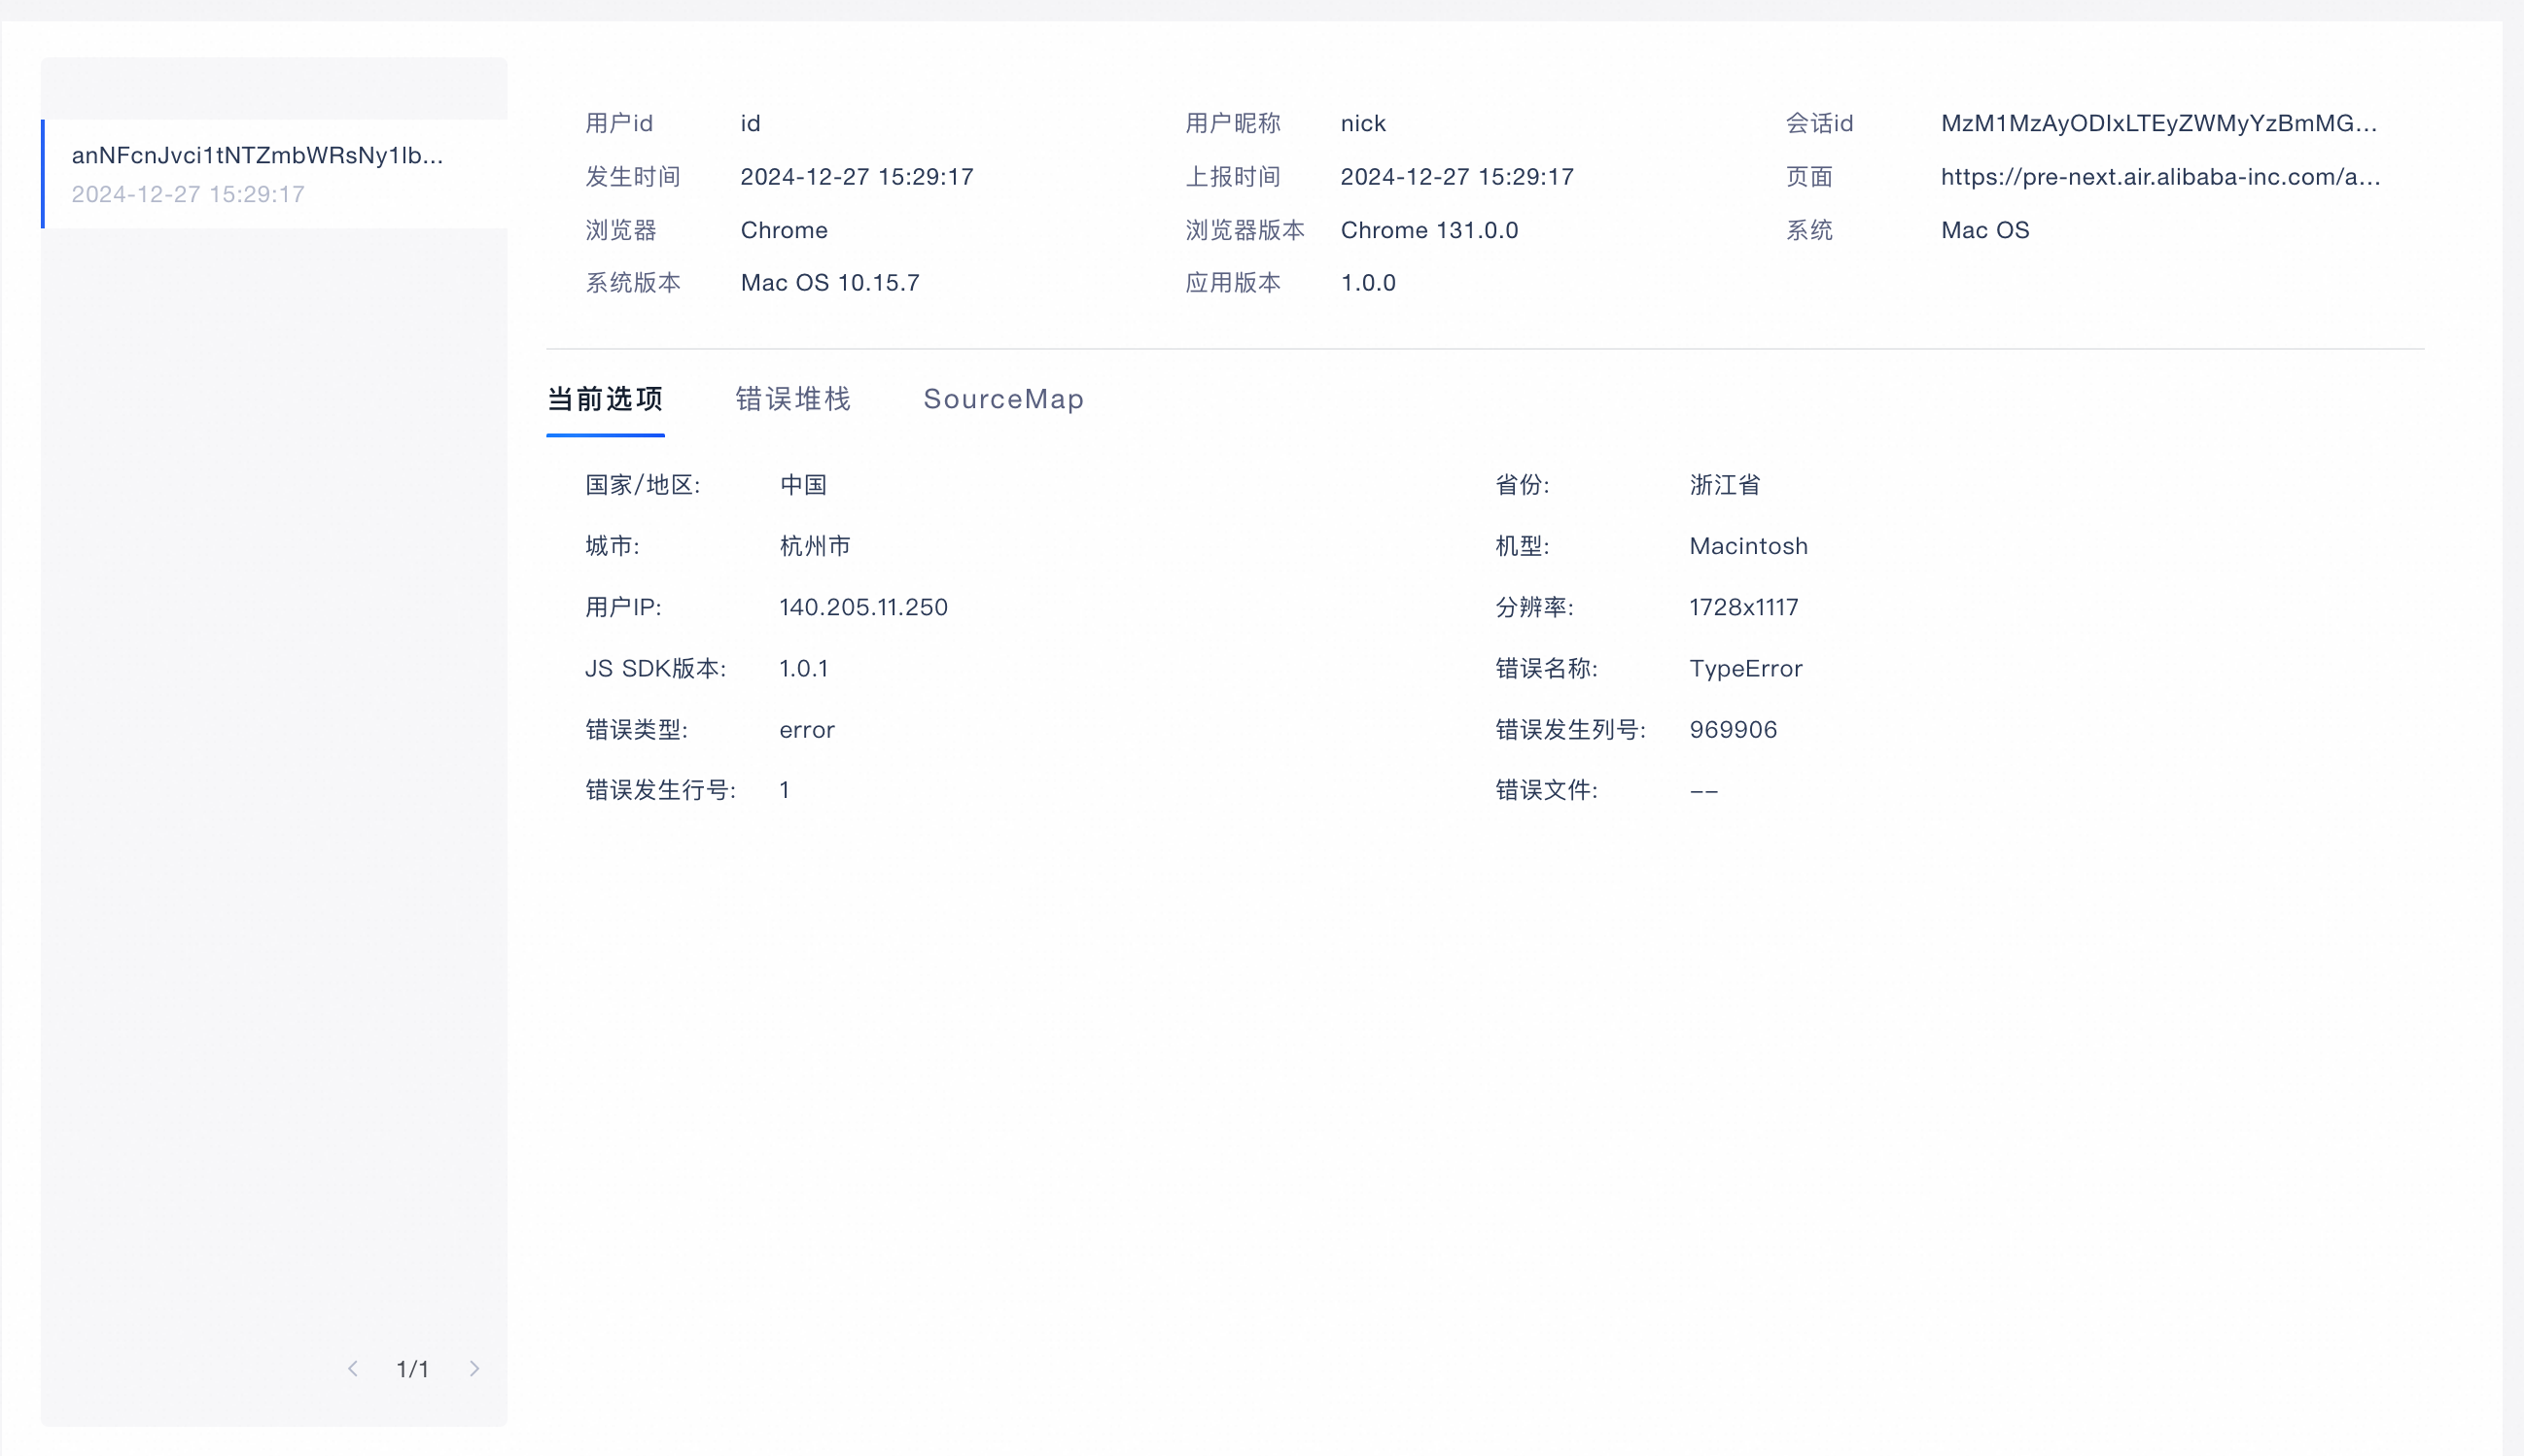
Details
This section displays all client-reported instances for the same JS error. The left side lists instances in chronological order. You can click an instance to view its basic information, detailed reported fields, error stack, symbol table, and other related information on the right.
Reparse: Reparse the stack.
Download Stack: Download the original stack information.
Basic information
Basic information shows the basic device information for each JS error. For more information, see Basic information.
Current options
Current options show the detailed information for each JS error.
Parameter |
Description |
Country/Region |
The geographical location of the device, estimated from the IP address. |
Province |
The province where the device is located. |
City |
The city where the device is located. |
Model |
The model identifier of the device. |
User IP |
The public IP address of the device. |
Resolution |
The resolution of the device. |
JS SDK version |
The version number of the SDK used. |
Error name |
The specific name of the JS error. |
Error type |
The type of the JS error. |
Error column number |
The column number where the JS error occurred. |
Error line number |
The line number where the JS error occurred. |
Error file |
The JS file where the error occurred. |
Error stack
This section displays the detailed error stack log from the reported data when the error occurred.
Symbol table
You can upload the symbol table file to the JS error console. You can use the symbol table file to deobfuscate the error call stack, which helps with problem analysis and resolution.
The symbol table can be re-uploaded and downloaded.
Administration techniques
Based on Alibaba's extensive experience in managing JS errors, this section summarizes some common error situations and administration strategies. These techniques can help you better analyze data and take effective measures.
Script Error
A "Script Error" is a common and tricky JS error. As shown in the following figure, the error message is simply "Script Error." and provides no other details, which makes it difficult to investigate further.
This type of error is mainly caused by cross-domain issues. When an error occurs in a script loaded from a different domain, the browser does not report the details of the error to prevent information leakage. Instead, it reports a simple "Script error". For more information, see Script-error.
Solution:
For all imported JS files, whether through a script tag or dynamic import, add the
crossorigin='anonymous'attribute. For example:
<script src="http://another-domain.com/index.js" crossorigin="anonymous"></script>Use path analysis with instrumentation. By analyzing instrumentation samples, you can identify commonalities among users who experience the error, which helps you reproduce or locate the error. For example, if the top-level error is "Script Error.", you can first ignore this error and then perform path analysis on the remaining errors.
XXX is not a function
In older browser versions, you might encounter errors related to new ES6 syntax, such as "Object.assign is not a function" or "Set is not defined". This usually happens because these browsers do not support ES6 features, and the project's Babel configuration does not include the necessary polyfills. Solution:
Confirm the cause of the error: Use the browser error message and the reported details in the EMAS console to confirm that the error is caused using ES6 features that are not supported by older browsers.
Check the Babel configuration: Verify that the project's Babel configuration includes the necessary polyfills to support older browser environments.
Add necessary polyfills: Update the project configuration to ensure that the Babel polyfill is imported in the entry file to provide compatibility for all necessary ES6 features.
By following these steps, you can effectively resolve the error and improve the application's compatibility with older browser versions.
Use SourceMaps effectively
Manage SourceMap files securely. Source code, especially comments, must not be exposed in the production environment. Separate SourceMaps from the frontend resource artifacts during the build process. You can host SourceMap files on an internal network or locally.
When you encounter a production issue and obtain the original stack trace, you can use the platform's SourceMap feature to quickly locate the problem.
You can use third-party plugins with SourceMaps to easily debug production code. This is useful for resolving complex issues that are difficult to reproduce.
Additional information
Exception monitoring is used to monitor your application's stability from the user's perspective. It is especially useful for quickly analyzing and locating the cause of customer complaints. Therefore, we recommend 100% sampling. If you have cost control requirements, you can flexibly configure sampling rules and rates in Reporting configuration > JS errors.