Asight Compute quick start
1. Overview
Asight Compute is a kernel analyzer for PPU applications. It helps you optimize kernel performance by collecting and displaying metrics during kernel execution. Asight Compute consists of two tools:
The acu command-line tool: Collects kernel metrics and generates a report. It runs on the Linux platform.
The Asight Compute GUI tool: Visualizes reports. It supports Windows and macOS. The Asight Compute GUI provides multiple views to display metrics, such as Roofline Chart, Bar Chart, and Memory Table. It also supports baseline comparison and has a simple, intuitive interface.
The workflow for using Asight Compute is as follows:
Use the acu command-line tool to profile the target application and generate a report.
Open the report in the Asight Compute GUI for analysis.
2. Installation and setup
The tool is pre-installed on the official image, so no additional installation is required.
2.1 Configure the acu command-line tool
Configure environment variables
Navigate to the PPU SDK directory and run the script to configure the required environment variables:
source envsetup.shVerify the runtime environment
To view the acu help documentation, run the following command:
acu -hTip: You can also display the help by running
acuwithout any arguments.To check the installed version of acu, run the following command:
acu -v
2.2 Installing the Asight Compute GUI tool
The Asight Compute GUI tool supports the following operating systems:
Windows 10, Windows 11
macOS 10.15 and later
Click the download link, select the version you need, and download the appropriate installer: MSI for Windows or DMG for macOS.
You need an account and password to download the software package. Contact your account manager to obtain access.
3. Quick start
In this guide, the machine that runs the PPU application is the target machine, and the machine used to view the report is the host machine. The Asight Compute workflow is to use the acu command-line tool on the target machine to collect a report, then use the Asight Compute GUI tool on the host machine to open and analyze the report.
3.1 Collect reports with the acu tool
Use the acu command-line tool to launch your target application and collect its performance data. When the application finishes, acu outputs a report file.
The command syntax is as follows: acu [options] <application> [application args]
For example, to collect performance data for all kernel launches in the target application, run the following command:
acu -o test_report -f python test_linear.py-o test_reportspecifies the name for the output report. You do not need to specify a file extension.-fforces an overwrite of an existing file.python test_linear.pyruns the application.
After the application finishes running, acu generates a report file, which in this example is test_report.acurep.
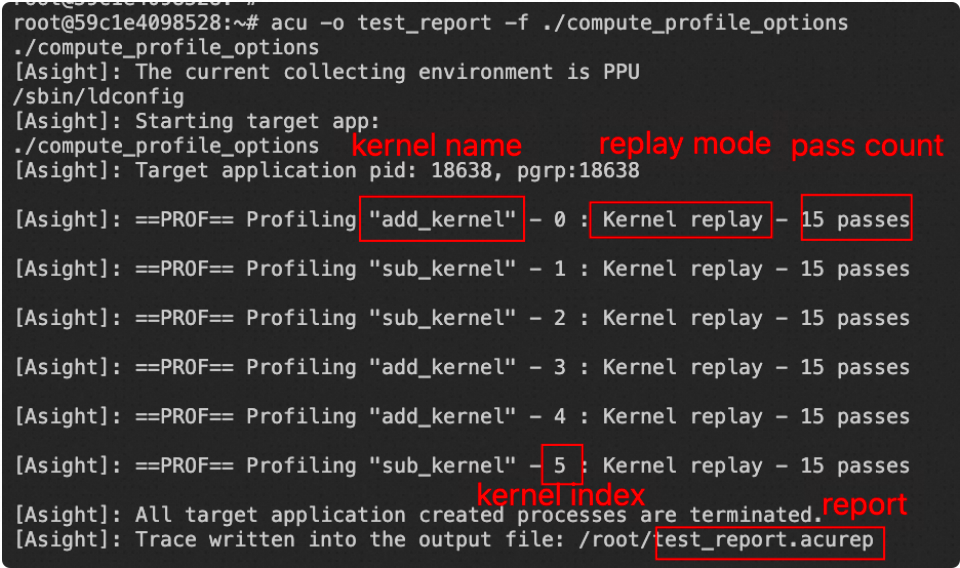
You can specify which kernel data to collect using several options: the -c, --launch-count option limits the number of kernel launches to profile, -s, --launch-skip skips a specified number of initial launches, and -k, --kernel-name filters kernels by name using regular expressions. For more information, see Filter Kernels.
To limit the content collected for each kernel launch, you can use --set to specify a collection set (by default, the sections associated with the 'default' set are collected). Use --list-sets to view the available sets. To specify exact section files by their identifiers, use --section and run --list-sections to view the available sections. Similarly, to collect a specific group of metrics, use --metrics, and run --query-metrics to query the available metrics. For more information, see Specify Metric Sets for Collection.
The acu tool also supports multiple replay modes. For more information, see Specify the Replay Mode.
In addition to saving results in a report file, the acu tool can print results to the console using different pages. These pages correspond to the pages in the GUI report. If you do not specify an output file with -o, the details page is printed by default. To select a different page, or to print a page while also saving to a file, use the --page=<Page> option. Supported pages currently include details and raw.
3.2 Viewing the report
Reports collected by acu have the .acurep file extension and can be viewed in the Asight Compute GUI. You can open a file in the GUI tool in the following ways:
From the main menu: Select File > Open...
Drag and drop the file into the main Asight Compute GUI window.
In the Project Explorer, right-click a blank area and select Open...
Open from the command line of the GUI tool, such as
acu-uireport.acurep.
The report file (.acurep) is self-contained and can be shared with other users. However, the Asight Compute GUI version used to view a report must be the same as or newer than the acu version that generated it. The GUI tool displays a notification if you open a report collected with a newer version of the command-line tool.