Asight Compute GUI
Generate an .acurep report file on the target using the acu command-line tool, copy the file to the host, and open it with the Asight Compute GUI tool.
UI feature highlights
Configure metrics for various visualizations, such as tables and charts.
View detailed hierarchical charts and tables for memory workloads.
Use the Baselines feature to compare performance results across different kernels and reports to pinpoint differences.
Export data from the Raw Page in PDF, PNG, or CSV format. Use the Export CSV option for post-processing analysis.
Use the project explorer to manage reports, including opening and deleting selected reports in batches.
The Dock Widget feature lets you drag reports out of the main window to view them in separate windows or on different screens, as shown in the following figure.
To dock a report, drag its Tab:
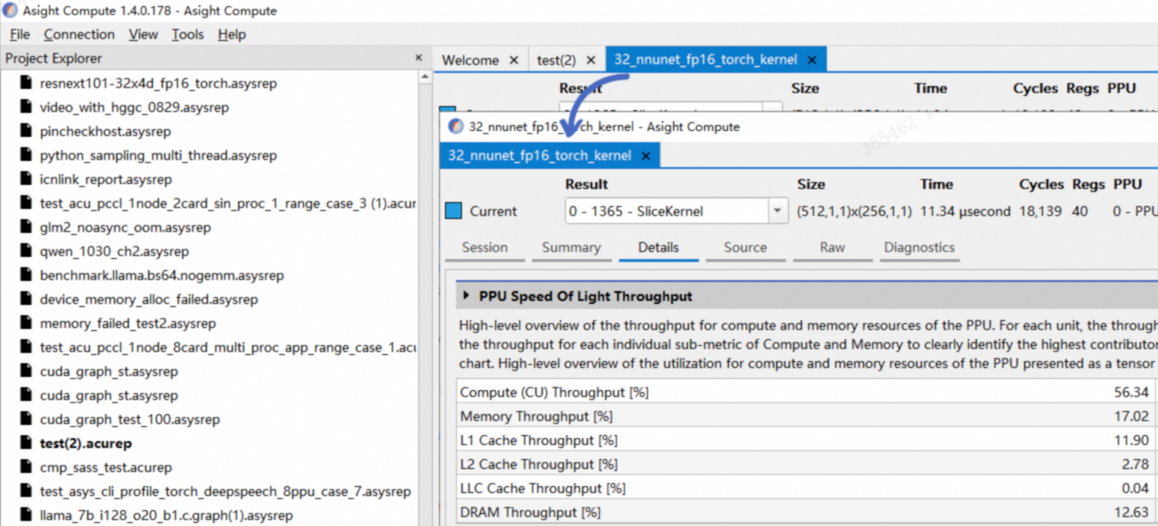
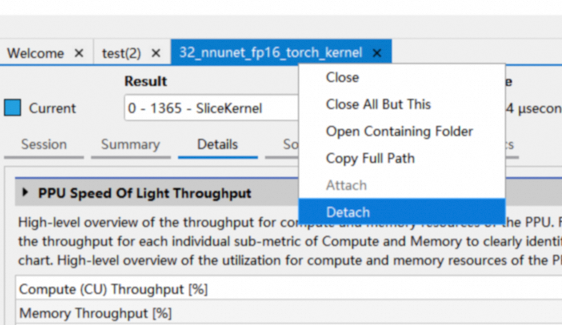
Alternatively, use the Detach and Attach options in the context menu:
1. Details
The Details page displays all metrics collected during kernel startup. The page is organized into separate sections. Each section has a header table that displays its key metrics. Sections also typically include at least one expandable and collapsible section body, which presents more detailed metrics in tables or charts, as shown in the following figure:

Expand/collapse section body
Section description
Table header
Toggle section body
Section body
Hover over a table or chart to view the metric's value, detailed information, and definitions of related terms.

The sections on the details page covering compute load, cache hits, and Warp scheduling help you understand kernel execution, identify bottlenecks, and find opportunities for optimization.
This topic describes each section.
1.1 Speed of light throughput
This section outlines PPU compute and memory resource utilization during kernel execution. It shows the kernel throughput as a percentage of the theoretical value for both compute and memory access. Start your analysis here to determine if a kernel is compute-bound or memory-bound.

1.1.1 Header table

The Header table summarizes key metrics, such as the throughput utilization of each PPU and the kernel execution cycle count. These metrics are defined as follows:
Parameter | Description |
Compute (CU) throughput | The ratio of achieved compute throughput to the theoretical maximum. |
Memory throughput | The ratio of achieved memory throughput to the theoretical maximum. |
L1 cache throughput | The ratio of achieved L1 cache throughput to the theoretical maximum. |
L2 cache throughput | The ratio of achieved L2 cache throughput to the theoretical maximum. |
LLC cache throughput | The ratio of achieved LLC cache throughput to the theoretical maximum. |
DRAM throughput | The ratio of achieved DRAM throughput to the theoretical maximum. |
Duration | The kernel's execution time. |
Elapsed cycles | The total number of PPU clock cycles during kernel execution. |
Active cycles | The number of active PPU clock cycles during kernel execution. |
CU active cycles | The number of active CU clock cycles during kernel execution. |
CE frequency | The operating frequency of the CE. |
DRAM frequency | The operating frequency of the DRAM. |
1.1.2 PPU throughput bar chart

The bar chart shows the throughput of compute units and memory, corresponding to Compute (CU) Throughput and Memory Throughput in the header table.
The chart helps you identify whether a kernel is compute-bound or memory-bound, so you can apply appropriate optimization strategies. Kernels are typically classified into the following three types based on their performance bottleneck:
compute-bound kernel
A kernel is considered compute-bound when its throughput on a PPU compute unit approaches the unit's theoretical maximum (typically over 80%), as shown in the following figure:

A compute-bound kernel has significantly more compute instructions than memory accesses. To further improve performance, examine the compute workload analysis section to identify the most utilized compute unit pipeline:
Consider converting this type of computation to another type.
Eliminate redundant computations to reduce the computational load.
Use a lookup table instead of computation.
Memory-bound kernel
When a kernel drives the throughput of a PPU memory unit toward its theoretical maximum (typically over 80%), it becomes a memory-bound kernel because its performance is limited by memory access, as shown in the figure below.

Memory-bound kernels spend most of their runtime waiting for data. To improve performance, examine the Memory Workload Analysis section to optimize the use of memory subsystems:
Ensure coalesced access to global memory.
Maximize use of the memory hierarchy, including shared memory and caches.
Maximize data reuse to reduce memory access instructions.
Replace lookup tables with real-time computing.
Latency-constrained kernel
A kernel is considered latency-bound when its performance in both compute and memory access fails to approach theoretical peaks, as shown in the following figure:

For latency-bound kernels, first examine the launch configuration in the Launch Statistics section to ensure the grid is sufficiently large. Additionally, review the Scheduler Statistics section and the Warp State Statistics section to identify other potential reasons why each thread spends most of its time waiting rather than executing.
To improve the performance of latency-bound kernels:
Ensure a sufficient number of blocks to saturate the PPU and maximize occupancy.
Increase the workload per thread, for example, by having each thread process multiple input elements.
1.1.3 Breakdown tables
Breakdown Tables display throughput percentages for two types of units: PPU compute and memory, as shown in the figure below.

The breakdown table shows the throughput percentage for each unit in the current subsystem, sorted in descending order, to help you identify which unit is limiting the kernel. The bar chart displays the throughput of the busiest unit, which represents the subsystem's overall throughput.
1.1.4 Roofline chart
A kernel needs data to compute, so its performance depends on both the PPU's computational speed and its data supply rate. To visualize kernel performance intuitively, Asight Compute offers a roofline chart. This chart combines the PPU's peak compute performance and memory bandwidth with a metric called arithmetic intensity—the ratio of computational work to memory traffic. The following figure shows a typical roofline chart:
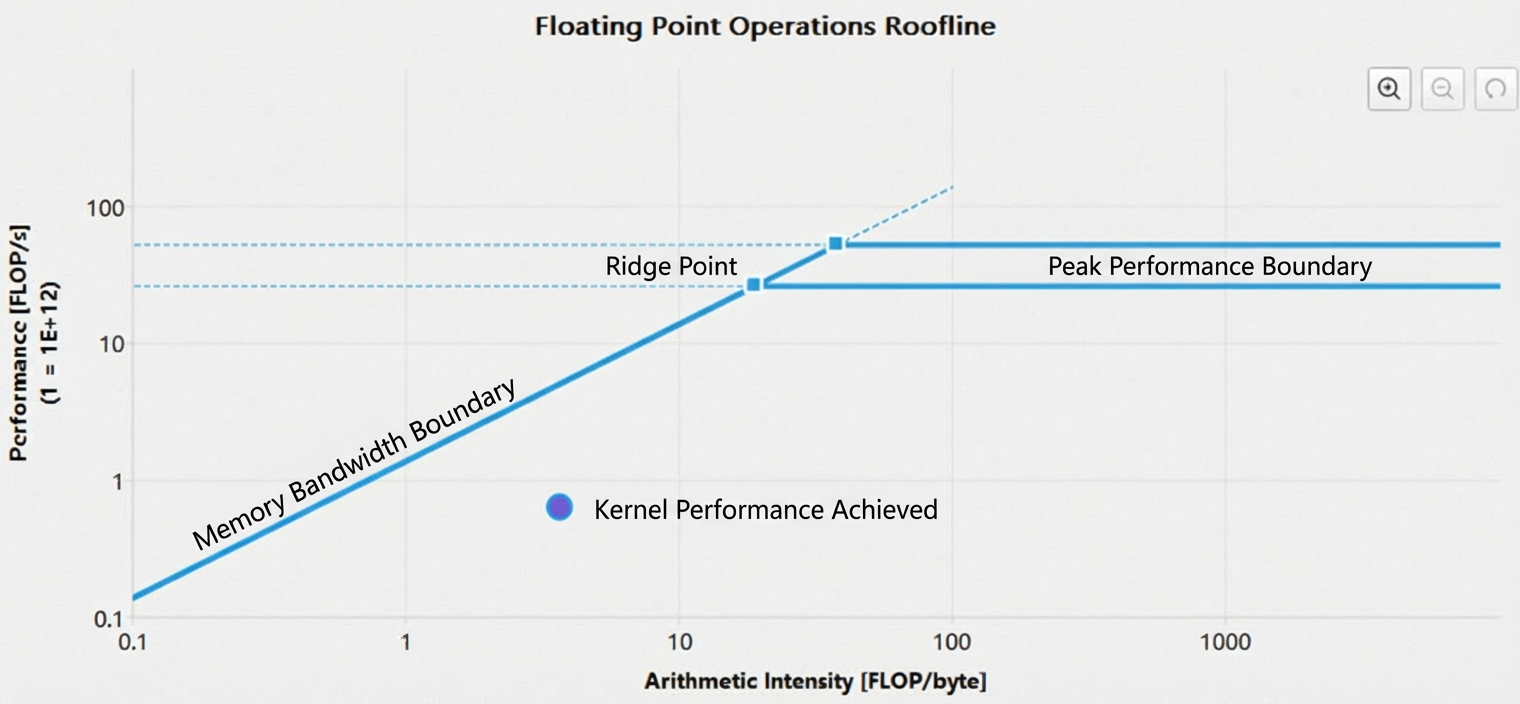
y-axis: The y-axis represents floating-point operations per second (FLOPS). Since this value can be very large for a PPU, the axis uses a logarithmic scale for clarity.
x-axis: The x-axis represents arithmetic intensity, which is the ratio of work (FLOP/s) to memory traffic (byte/s), measured in FLOP/byte. This axis also uses a logarithmic scale.
memory bandwidth boundary: The sloped portion of the roofline. The PPU's memory bandwidth determines this boundary.
peak performance boundary: The flat portion of the roofline. The PPU's peak compute performance determines this boundary.
ridge point: The intersection of the memory bandwidth boundary and the peak performance boundary. This point is a reference for analyzing kernel performance.
achieved performance: A kernel's performance at a given arithmetic intensity. For baseline comparisons, the chart also displays performance values for each baseline. The outline color of a point indicates which baseline it belongs to.
A roofline chart shows whether a kernel is compute-bound or memory-bound.
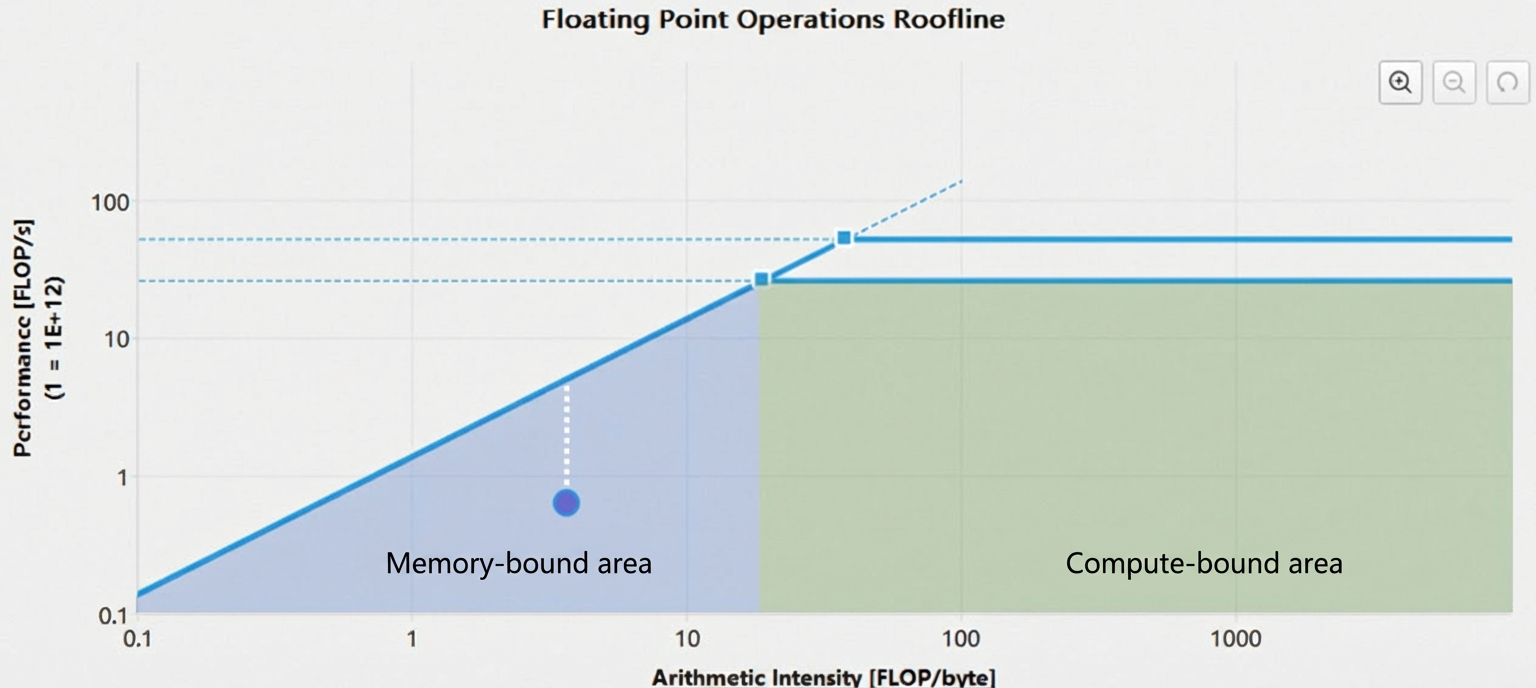
In the figure above, the ridge point divides the roofline into two regions: the blue shaded area below the memory bandwidth boundary is the memory-bound region, and the green shaded area below the peak performance boundary is the compute-bound region. The kernel's performance-limiting factor is determined by where its performance falls.
The gap between the achieved performance value and the upper boundary (the dashed white line in the preceding figure) indicates the potential for performance optimization. The closer this value is to the upper boundary, the better the kernel performs. Once a kernel's achieved performance value reaches the memory bandwidth boundary, you can only further improve performance by increasing arithmetic intensity.
You can zoom and pan the roofline chart:
Zoom in:
Ctrl + scroll wheel
Click and drag with the left mouse button.
Click the zoom-in button.
Press the Plus (+) key.
Zoom out:
Ctrl + scroll wheel
Right-click.
Click the zoom-out button.
Press the Minus (-) key.
Reset:
Click the reset button.
Press the Esc key.
Pan:
Hold Ctrl and drag with the left mouse button.
1.2 Compute workload analysis
The Compute Workload Analysis section details the performance data for the PPU's compute resources:
Instructions per clock (IPC): Measures the number of instructions the CU issues per clock cycle.
Pipeline utilization: Measures the activity of various pipelines in the CU.

1.2.1 Header table

The header table displays key kernel execution metrics, such as CU utilization and instruction count per active cycle. These metrics are defined as follows:
Parameter | Description |
Executed Ipc Elapsed | Instructions executed per cycle during all elapsed compute unit cycles. |
Executed Ipc Active | Instructions executed per cycle during active compute unit cycles. |
Issued Ipc Active | Instructions issued per cycle during active compute unit cycles. |
CU Busy | Compute unit utilization. |
Issue Slots Busy | Issue slot utilization. |
1.2.2 Pipe utilization bar chart

The pipe utilization bar chart shows the utilization of each PPU compute pipe during kernel execution. The most common pipelines are:
Pipe | Description |
SALU | scalar arithmetic logic unit |
VALU | vector arithmetic logic unit, including IALU and FALU |
IALU | integer arithmetic logic unit |
FALU | floating-point arithmetic logic unit |
sls | scalar load/store unit |
SFU | special function unit |
tensor unit | tensor computation unit |
lsu | vector load/store unit |
ffma | FP32 fused multiply-add operation |
fadd | FP32 addition operation |
fmul | FP32 multiplication operation |
hfma | FP16 fused multiply-add operation |
hadd | FP16 addition operation |
hmul | FP16 multiplication operation |
Low utilization across all compute pipes (typically below 60%) suggests that the kernel launch configuration is too small or the warp scheduler lacks sufficient warps. Refer to the Launch Statistics and Scheduler Statistics sections for details.
High pipe utilization (typically above 80%) in a computing unit can be a performance bottleneck. To improve performance, consider balancing utilization across all pipes.
1.3 Memory workload analysis
The Memory Workload Analysis section details the performance data for each PPU memory unit. When PPU memory units are highly utilized, memory access can become a performance bottleneck for the kernel. This occurs when memory unit utilization is too high, memory bandwidth is saturated, or the throughput of memory access instructions is at its maximum. This section contains two section bodies:
Memory chart
Memory table
1.3.1 Header table

The header table displays the following utilization metrics for each PPU memory unit: cache hit rate, bandwidth, and memory access pipe utilization.
Parameter | Description |
Memory Throughput | DRAM throughput, measured in bytes/second |
Mem Busy | memory throughput utilization |
KVD Hit Rate | vector data cache hit rate |
KSD Hit Rate | scalar data cache hit rate |
Max Bandwidth | maximum memory bandwidth utilization |
L2 Hit Rate | L2 cache hit rate |
LLC Hit Rate | last level cache hit rate |
Mem Pipes Busy | memory pipe utilization |
LLC Compression Success Rate | last level cache compression success rate |
LLC Compression Ratio | last level cache compression ratio |
1.3.2 Memory chart
1.3.2 Memory chart

The Memory Chart shows data transfers between memory units, including the cache hit rate, instruction count, and memory request count.
Logical units (green sections) include:
Kernel: The kernel running on the PPU.
Global: HGGC global memory.
Local: HGGC local memory.
Shared: HGGC shared memory.
Load Global Store Shared: Instructions that load data directly from global memory to shared memory.
Physical units (blue sections) include:
L1 cache: Includes units such as KSD, KVD, and TSM.
L2 cache and L2 compression.
LLC cache and LLC compression.
System memory: System (CPU) memory.
Device memory: Device (PPU) memory.
Peer memory: Memory on other PPU devices.
Links
Links between the kernel and other logical units represent the number of instructions executed by each logical unit. For example, the link between the kernel and Global represents the number of global memory load/store instructions.
Links between logical units and physical units represent the number of requests (Req) issued by the corresponding instructions.
Links between physical units represent the volume of data transferred between them.
The arrows on the links indicate the direction of data transfer. A link's color indicates its utilization percentage. The legend on the right maps colors to utilization levels from 0% to 100%. Some links share a data port. In the chart, colored trapezoids represent ports, and their color indicates the port's utilization.
Use the combo box in the upper-right corner to switch between transfer size and throughput views.
1.3.3 Memory table

The memory table details metrics for memory units such as shared memory, cache, and device memory. Hover over a table entry to view specific metrics and additional details.
1.4 Scheduler statistics
The Scheduler Statistics section shows the scheduling activity of the warp scheduler. Each warp scheduler maintains a warp pool and issues instructions for the warps within it. The kernel launch configuration limits this pool to a maximum of 16 warps. Each cycle, the warp scheduler checks the state of every warp. Based on this state, the scheduler classifies the warps into the following four categories:
Active warp: A warp is active from the time it can be scheduled by the
warp scheduleruntil it has executed its finalinstruction.Eligible warp: An active
warpready to issue its nextinstruction. This happens, for example, when the data required for a computeinstructionis available.Stalled warp: An active
warpunable to issue its nextinstructiondue to a dependency, such as waiting for abarrieror for the result of a previousinstruction.Selected warp: An
eligible warpselected by thewarp schedulerto execute its nextinstruction.
This figure illustrates the relationships among the various warp states:
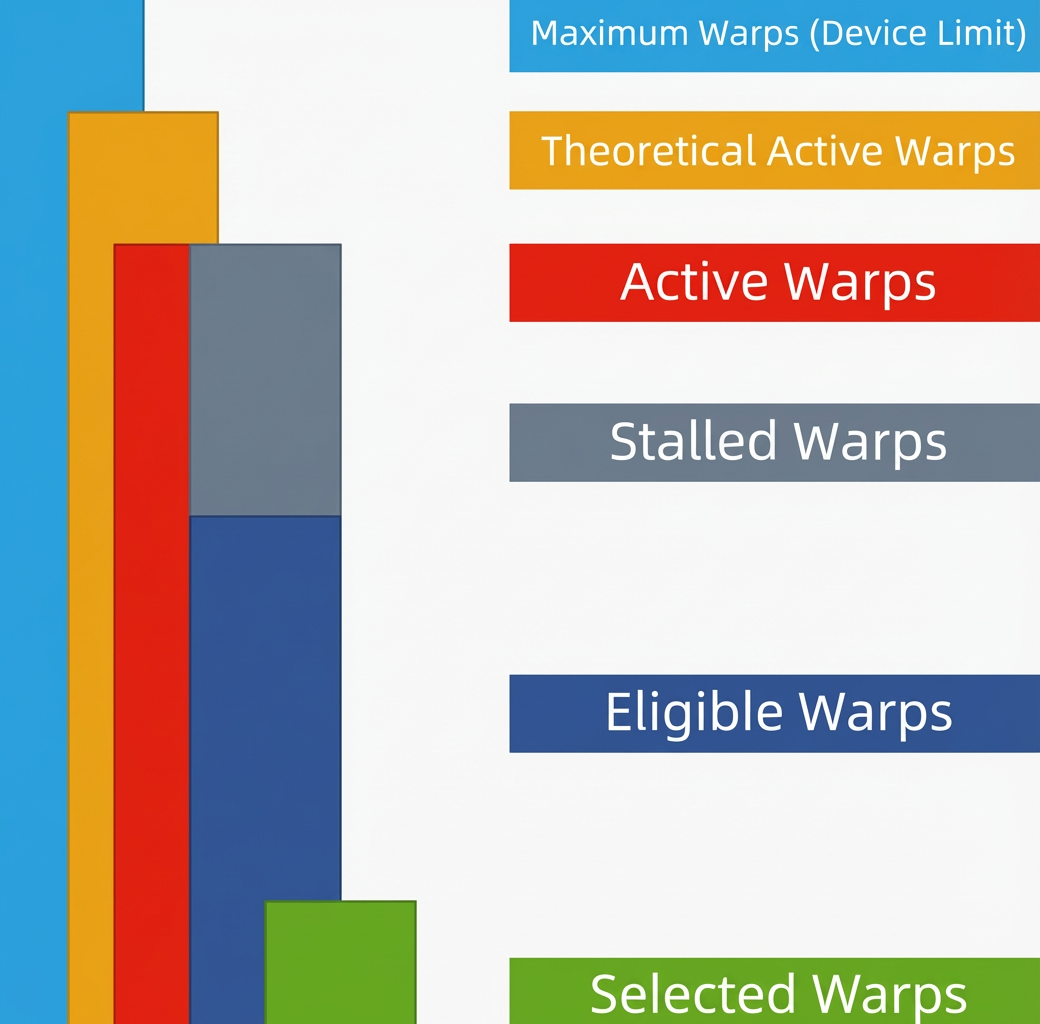
The preceding figure shows that the number of active warps cannot exceed the number of theoretical active warps: device limit >= theoretical active warps >= active warps.
An active warp is either a stalled warp or an eligible warp, depending on whether it can issue the next instruction: active warps = stalled warps + eligible warps.
Each cycle, the warp scheduler selects an eligible warp and issues the next instruction. If no warps are eligible, no instruction is issued, degrading kernel performance.
1.4.1 Header table

The header table shows how the warp scheduler issues instructions:
Parameter | Description |
Active Warps Per Scheduler | The average number of active warps per warp scheduler per cycle. This value ranges from 0 to 16. |
Eligible Warps Per Warp Execution | The average number of eligible warps per warp scheduler per cycle. This value is less than or equal to |
Issued Warps Per Scheduler | The average number of issued warps per warp scheduler per cycle. The ideal value is 1. |
No Eligible | The percentage of active cycles in which no eligible warps are available. During these cycles, the warp scheduler does not issue an instruction. |
One or More Eligible | The percentage of active cycles in which at least one eligible warp is available. The ideal value is 100%.
|
1.4.2 Warps per scheduler bar chart

The Warps Per Scheduler bar chart displays the average warp count per cycle for each state on each warp scheduler.
Ideally, the warp scheduler issues one instruction per cycle. A low Issued Warps Per Scheduler value (typically below 0.6) indicates that PPU resources are underutilized, which degrades kernel performance. This low value is directly caused by an insufficient number of eligible warps. To improve kernel performance:
Review the Occupancy section to ensure high kernel occupancy, aiming for 16 theoretical active warps.
Review the Warp State Statistics section to identify the primary stall reason, minimize the associated stall time, and increase the number of eligible warps.
Avoid load imbalance to prevent significant variations in warp execution time.
1.5 Warp state statistics
The Warp State Statistics section shows the average number of cycles a warp takes to execute each instruction during kernel execution. This cycle count determines the latency between instructions. The higher the cycle count, the more warp-level parallelism is required to hide this latency. The section also provides statistics on the state of active warps. Warp state indicates whether a warp is ready to issue its next instruction in a given cycle and the reasons for this state.
1.5.1 Warp stall reasons
The PPU classifies active warps into the following 15 states:
Warp state | Description |
Instruction Fetch | Waiting for an instruction to be fetched. This stall is common for small kernels that do not constitute a full wave. It can also occur if frequent branching leads to a low instruction cache hit rate. |
Compute Dependency | Waiting for a dependent compute instruction to complete. |
Memory Dependency | Waiting for a dependent memory instruction to complete. |
Memory Throttle | Stalled because the memory instruction queue is full. This stall typically occurs when memory pipeline utilization is high. |
Not Selected | Waiting to be scheduled by the warp scheduler. A warp in this state is eligible for execution, but another eligible warp was selected instead. A high number of warps in this state indicates sufficient parallelism to hide latency. |
Selected | Selected by the warp scheduler to issue its next instruction. |
Stall Pipe Busy | Stalled because the required functional unit is busy. |
Stall Sleeping | Stalled because the warp is in a sleep state. |
Stall Sync | Stalled waiting for other warps to reach a synchronization point. This stall is often caused by a branch before a barrier, causing some warps to wait longer for others. If possible, minimize branching within a block. |
Stall SALU Control | Stalled waiting for a previous scalar control instruction or because the SCTL pipe is busy. |
Stall SIMT Control | Stalled waiting for a previous SIMT instruction. |
Stall SREG Read | Stalled waiting for an SREG read or because the SREG port is busy. |
Stall Fence Sys | Stalled waiting for a fence.sys instruction. |
Stall AMC | Stalled due to AMC power management. |
Stall Others | Stalled for other hardware-related reasons. |
1.5.2 Header table

The items in the header are as follows:
Parameter | Description |
warp cycles per issued instruction | The average number of cycles per issued instruction for a warp. |
warp cycles per executed instruction | The average number of cycles per executed instruction for a warp. |
average active threads per warp | The average number of threads in a warp that are not idle. |
Cycles per issued instruction (CPI) is a key kernel performance metric.
1.5.3 Warps per scheduler bar chart

The Warps Per Scheduler bar chart lists all warp stall reasons in descending order. The Warp Cycles Per Issued Instruction metric is the sum of the cycles for all warp stall reasons. Since warp stalls are unavoidable, you should investigate their causes only if the No Eligible value in the Warp State Statistics section is high.
1.6 Instruction statistics
This section shows execution statistics for low-level assembly instructions (SASS).
1.6.1 Header table

The header table contains the following items:
Parameter | Description |
Executed instructions | The number of instructions executed by the kernel. |
Issued instructions | The number of instructions issued by the kernel. |
Avg. executed instructions per scheduler | The average number of instructions executed per warp scheduler. |
Avg. issued instructions per scheduler | The average number of instructions issued per warp scheduler. |
1.6.2 Executed instruction mix bar chart

The Executed Instruction Mix bar chart lists the instructions executed by each kernel, sorted in descending order of execution count. This bar chart shows the counts of fused instructions, such as fma, and non-fused instructions, such as add and mul. If non-fused instructions account for a high percentage, consider converting them to fused instructions to improve instruction throughput.
1.7 ICNlink
This section provides an overview of ICNlink utilization, including the total amount of data received and sent and the peak link utilization.

The following describes the items in the header table:
Parameter | Description |
Received Bytes | The number of bytes received over the ICN link. |
Received Peak Utilization | The peak utilization of incoming traffic on the ICN link. |
Received Overhead Bytes | The number of overhead bytes received over the ICN link. |
Received User Bytes | The number of user bytes received over the ICN link. |
Transmitted Bytes | The number of bytes transmitted over the ICN link. |
Transmitted Peak Utilization | The peak utilization of outgoing traffic on the ICN link. |
Transmitted Overhead Bytes | The number of overhead bytes transmitted over the ICN link. |
Transmitted User Bytes | The number of user bytes transmitted over the ICN link. |
The topology diagram visualizes the connections and data transmission between devices:

The property table lists ICNlink properties, including peak bandwidth and the number of physical connections.

The throughput table shows ICNlink throughput, bandwidth utilization, and idle time during the current range execution:

The throughput details table lists the transmitted and received data for each device port:

1.8 Launch statistics
This section lists the launch configuration for the kernel: grid size, block size, and the required PPU resources.

The header table contains the following items:
Parameter | Description |
Grid size | The number of blocks in the grid. |
Block size | The number of threads per block. |
Threads | The total number of threads the kernel launches, calculated as grid size × block size. |
Waves per CU | The average number of waves per compute unit (CU). |
Registers per thread | The number of registers each thread uses. |
Static shared memory per block | The size of statically allocated shared memory per block. |
Dynamic shared memory per block | The size of dynamically allocated shared memory per block. |
Kernel startup configuration directly affects utilization. For optimal kernel performance, consider the following:
A
Warpcontains 32threads, so theblock sizeshould be a multiple of 32.The
grid sizeshould be significantly greater than the number ofCUs. If the number ofblocks is smaller than the number ofCUs, someCUs will remain idle. Consider reducing theblock sizeor increasing thegrid size.Use the
waves per CUmetric to identify atail effect. Awaveis a set ofblocks that execute concurrently on thePPU. If thewaves per CUvalue is not an integer, it indicates that the finalwavedoes not fully utilize thePPU. This underutilization reducesoccupancyand degradesperformance. Consider adjusting theblock sizeto bring thewaves per CUvalue closer to an integer.
1.9 Occupancy
The Occupancy section shows occupancy data for kernel execution. Occupancy is the ratio of active warps on a compute unit (CU) to the maximum number of warps that can run concurrently. When sufficient warps are available, the PPU can hide latency by switching between them. High occupancy is essential for efficient kernel execution. Currently, the theoretical maximum number of active warps per CU is 64. Three factors limit the number of active warps on a CU:
Block size
Registers per thread
Shared memory per block
1.9.1 Header table

The header table contains the following items:
Parameter | Description |
Theoretical occupancy | The theoretical value calculated from the kernel's launch configuration. |
Theoretical active warps per CU | The theoretical number of active warps per Compute Unit (CU), calculated from the kernel's launch configuration. |
Achieved occupancy | The measured occupancy, averaged across all Compute Units (CUs). This value may differ from the theoretical value. |
Achieved active warps per CU | The measured number of active warps per CU, averaged across all CUs. This value may differ from the theoretical value. |
Block limit registers | The maximum number of resident blocks per CU, determined by the available registers. |
Block limit shared mem | The maximum number of resident blocks per CU, determined by the shared memory size. |
Block limit warps | The maximum number of resident blocks per CU, based on the hardware limit of 64 active warps per CU. |
Block limit CU | The maximum number of resident blocks per CU, based on the CU's hardware limit for managing blocks. |
1.9.2 Occupancy line chart
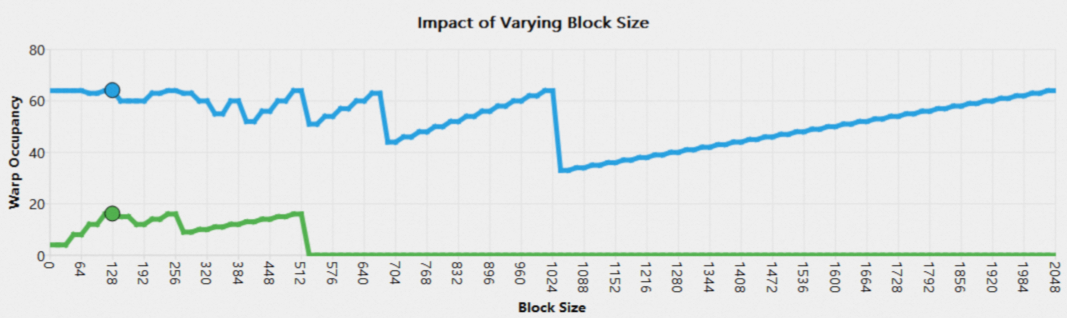
The Occupancy Section uses three line charts to show how each of the three conditions affects Occupancy. In each line chart, the x-axis represents the theoretical upper limit of one condition, while the y-axis shows the theoretical Occupancy for that condition with the other two conditions held at their actual values. The point on the line indicates the actual value. Hover over the point to view its value.


1.10. Source counters
The Source Counters section helps you identify performance issues in kernel code. It displays three tables that list the assembly code lines from the current kernel with the highest values for specific metrics: stall reasons, instructions executed, or thread instructions executed. Clicking an entry opens its source page, which helps you quickly pinpoint the performance bottleneck.
Warp Stall Sampling (All Samples)
Most Instructions Executed
Most Thread Instructions Executed

The first column lists the address and function name for each code line. Click an entry to view details on the Source Page.
The second column shows the metric value for each line of code. Hover over a cell to view the metric's breakdown in a tooltip. For example, in the Warp Stall Sampling table, the tooltip shows each stall reason's value and percentage.
The third column shows each line's percentage of the total metric.
2. Source page
The Source page correlates source code with assembly code. It also displays metrics associated with the source code, including various stall reasons collected through PC sampling and instruction execution count metrics derived from instruction statistics.
If an application is compiled with the -G or -lineinfo compilation flags, it includes debug information. This allows the tool to correlate source code with assembly code when parsing the report.

In the Source and PASM view, you can click a source code line on the left to highlight the corresponding assembly code lines on the right. Conversely, clicking an assembly code line on the right highlights the corresponding source code line on the left.


The Warp Stall Sampling (All Cycles) metric aggregates various types of stall reasons. You can hover over a code line to view a breakdown of the corresponding stall reasons.

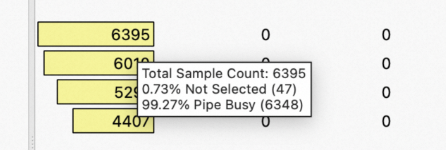
The Instruction Executed and Thread Instruction Executed metrics summarize the number of warps and threads that execute each instruction.

Vector Live Register and Scalar Live Register show the number of live vector and scalar registers that each line of code uses.

2.1 Basic features
View dropdown menu
You can use this dropdown menu to switch between the Source, PASM, and Source and PASM views.
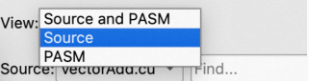
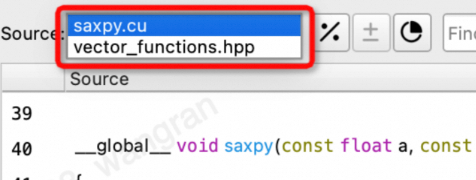
Source dropdown menu
You can use this dropdown menu to switch between different source code files.
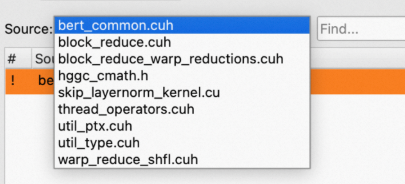
Metric display format buttons
Three buttons adjust the display style for metric columns, such as those for instruction statistics and stall reasons:

Relative/Absolute value button
By default, Relative value is selected, and metrics are displayed as a percentage of a total value. Whether this total is global or local depends on the third option.

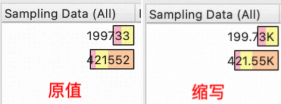
Abbreviated/Full value button
This option is enabled only when Absolute value is selected.
By default, Abbreviated is selected. For example, the full value 23456 displays as 23K.
Local/Global scope button
Local: When calculating a relative value, the denominator is the total metric value for all code lines in the current source.
Global: When calculating a relative value, the denominator is the total metric value for all code lines across all sources.
By default, Global is selected.

Note: In the Source view, a source refers to a source code file. In the PASM view, a source refers to a function.
For example, assume a kernel has two source files: saxpy.cu and vector_functions.hpp. For a specific line of code in saxpy.cu, the value for the inst_executed metric is 5. The total value for inst_executed across all lines in saxpy.cu is 40, and the total for vector_functions.hpp is 60. In Local + Relative mode, the table displays 5/40 = 12.5%. In Global + Relative mode, it displays 5/(40+60) = 5%. In Absolute mode, this setting is ignored, and the table displays the original value, 5.
Each time you open a report, the default settings for these options apply. You can change the default values for the first two options in the Options dialog:

Changes to these default values in the Options dialog do not affect any currently open Source page.
Find bar
The Find bar helps you quickly locate lines in the source code that contain a specific keyword. Enter a keyword to highlight all matching results in yellow. Use the up and down arrow buttons to navigate to the previous or next match.


Navigation bar
The Navigation bar helps you quickly jump to source code lines that correlate with assembly code. Use the up and down arrow buttons to navigate to the previous or next correlated line.


Metric sorting buttons
Use the metric sorting buttons to find the lines of code with the highest, next-highest, next-lowest, or lowest value for a selected metric. For example, to find the line with the highest value for a metric, select the metric from the dropdown list and click the "find maximum" button. You can then click the "find next-lowest" button to find a line with a smaller value.
From left to right, the buttons find the highest, next-highest, next-lowest, and lowest values, respectively.

Context menu
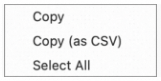
The table in the Source page supports the following context menu commands:
Copy: Copies the selected content to the clipboard.
Copy as CSV: Copies the selected content to the clipboard in CSV format.
Select All: Selects all content in the table.
Jump to branch target
Clicking the address or offset in a branch instruction jumps to the line of the destination instruction. For example, for the instruction s.cbr.az emsk, 0x2 at line 236 in the figure, clicking 0x2 skips the next two assembly instructions and jumps to line 239.

2.2 Import source code
Resolve
By default, acurep reports do not include the associated source code. When you open the Source Page, the tool attempts to import the source code from the path where it was located during collection. If the import fails, a message indicates that the source code file was not found. You then need to click Resolve to specify the source code directory. After you click the Resolve button, the Source Page first attempts to import the code from the Source Lookup list. If that fails, you can select a directory or file, and the tool then attempts to import other files based on their relative paths.


When a source file has been imported, the Source View provides a Redo Resolve button to reselect and import the current single source file.

If you want to specify a fixed directory for importing source code, such as a library location, you can use the Source Lookup feature. After you click the resolve button, the tool prioritizes importing source code from the directories in Source Lookup. Go to Tools > Options... > Source Lookup to open the Source Location management menu. In this interface, you can enable or disable an added Source Location by selecting or clearing its checkbox.

You can also use the menu button to add, delete, and adjust the loading order of the source code.

Raw Page
The Raw Page displays metrics from all kernel launches.

Sort
Click a metric column header to sort by that column.
Filter
Enter a keyword in the Filter box to hide columns that do not contain the keyword.
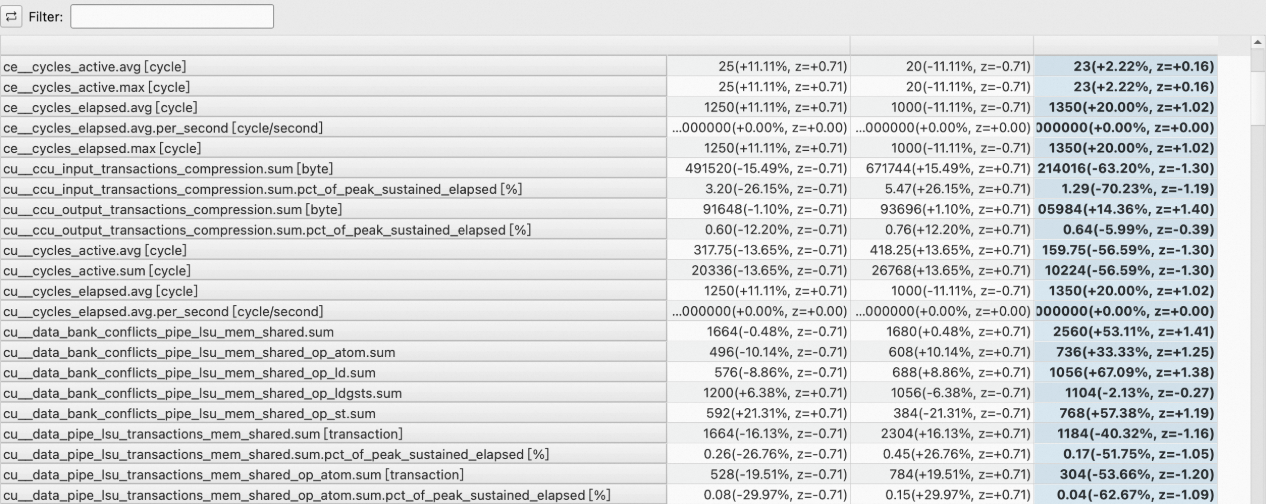
Transpose
The Raw Page lets you transpose the table, showing metrics as rows and kernels as columns.
Compare kernels
Double-click a table cell to set its kernel as the current one.
After you add baselines, the table values change to a difference format:
<focus value> (<difference to baselines average [%]>, z=<standard score>) (<number of values>)

Export
Use the menu in the upper-right corner to export the Raw Page table to formats such as CSV.

Change multi-instance metric formatting
Multi-instance metrics have two display modes, which you can configure in the Options menu:
Not instanced: totalValue {instanceCount}, for example, 12 {3}
After you add a baseline, the format updates to include the difference from the baseline average. For example, 12 (+0.00%){3}
Instanced: totalValue {value1; value2; ...}, for example, 12 (2; 4; 6).
After you add a baseline, the format updates to include the difference from the baseline average. For example, 12 (+0.00%)(2; 4; 6)


Multi-instance metrics currently fall into three categories:
Instruction execution count: inst_executed, thread_inst_executed
Instruction classification: sass__inst_executed_per_opcode
Stall reason: pu__pcsamp_warps_issue_stalled*
4. Summary page
The Summary Page displays key metrics for all collected kernel launches, helping you identify which kernels require deeper analysis.
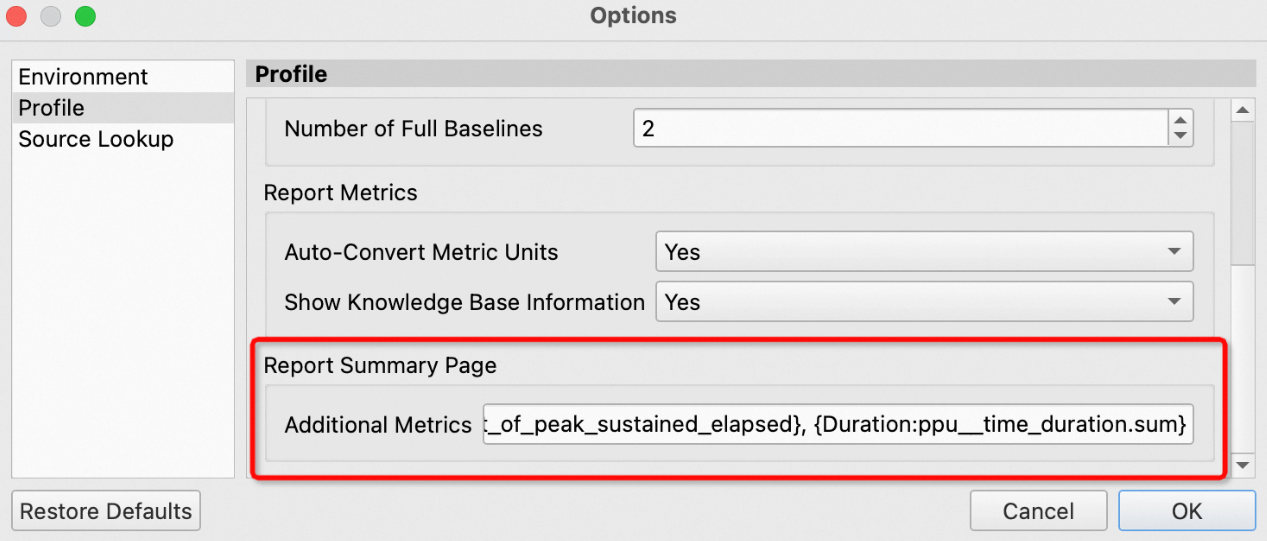
By default, this page displays ID, Time, API call ID, function name, demangled name, Process, device name, grid size, and block size. You can add additional metrics by navigating to Tools > Options > Profile > Report Summary Page. Use the format {customized_name:metric_name}, where metric_name is the original name of the metric and customized_name is the display name. Separate multiple metrics with commas.
The Summary Page offers the same sorting, filtering, transposition, kernel comparison, and export features as the Raw Page. Double-click a table entry to open the Details Page for more detailed metrics.
5. Session page
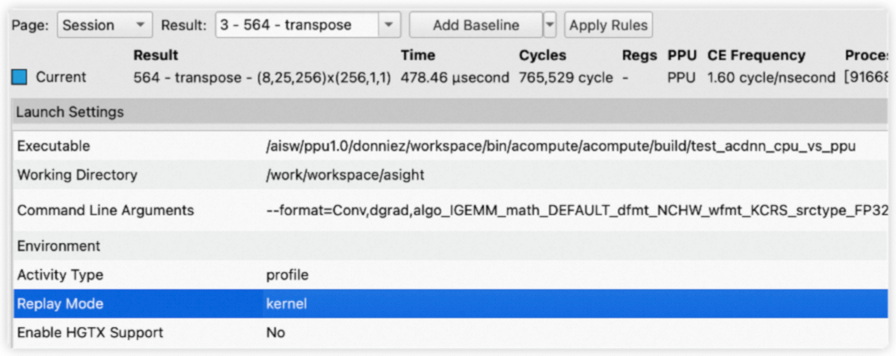
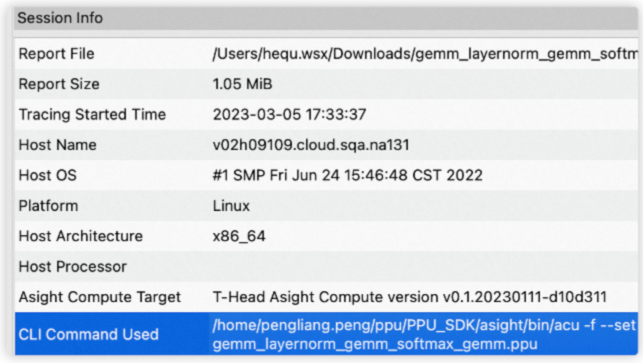
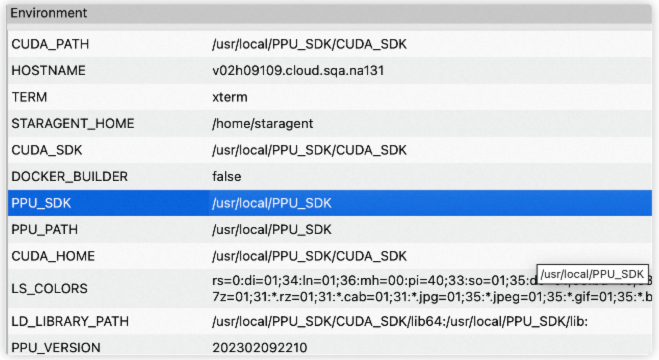
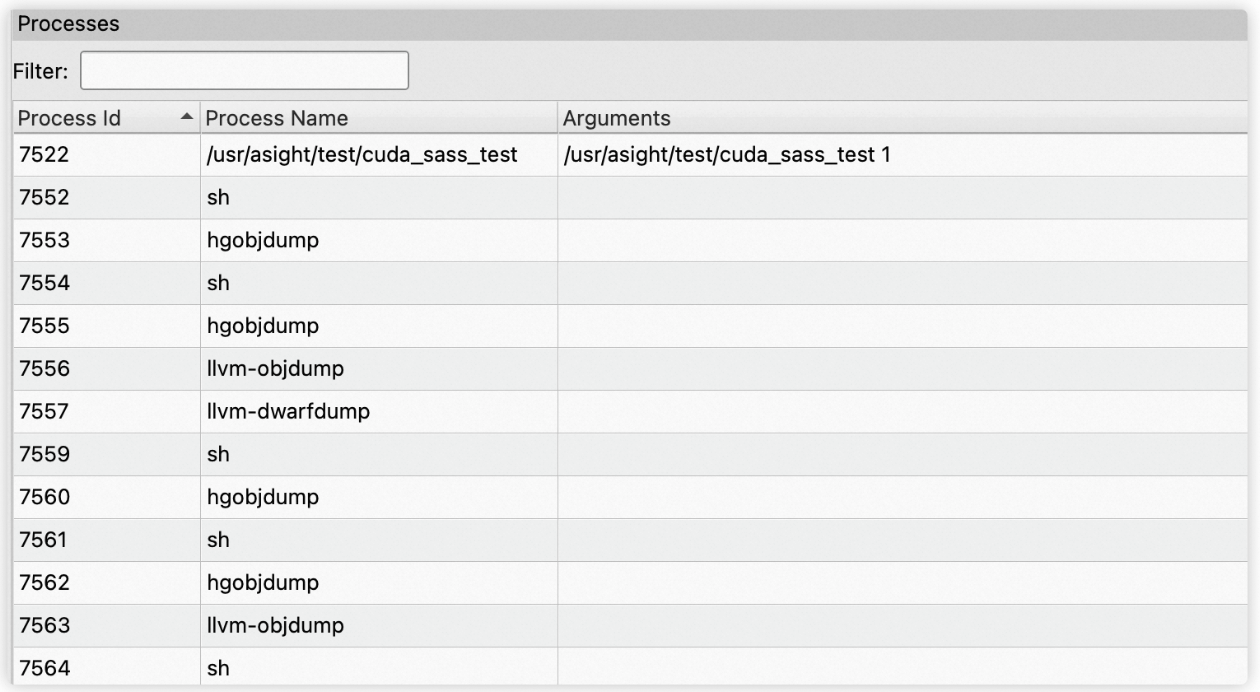
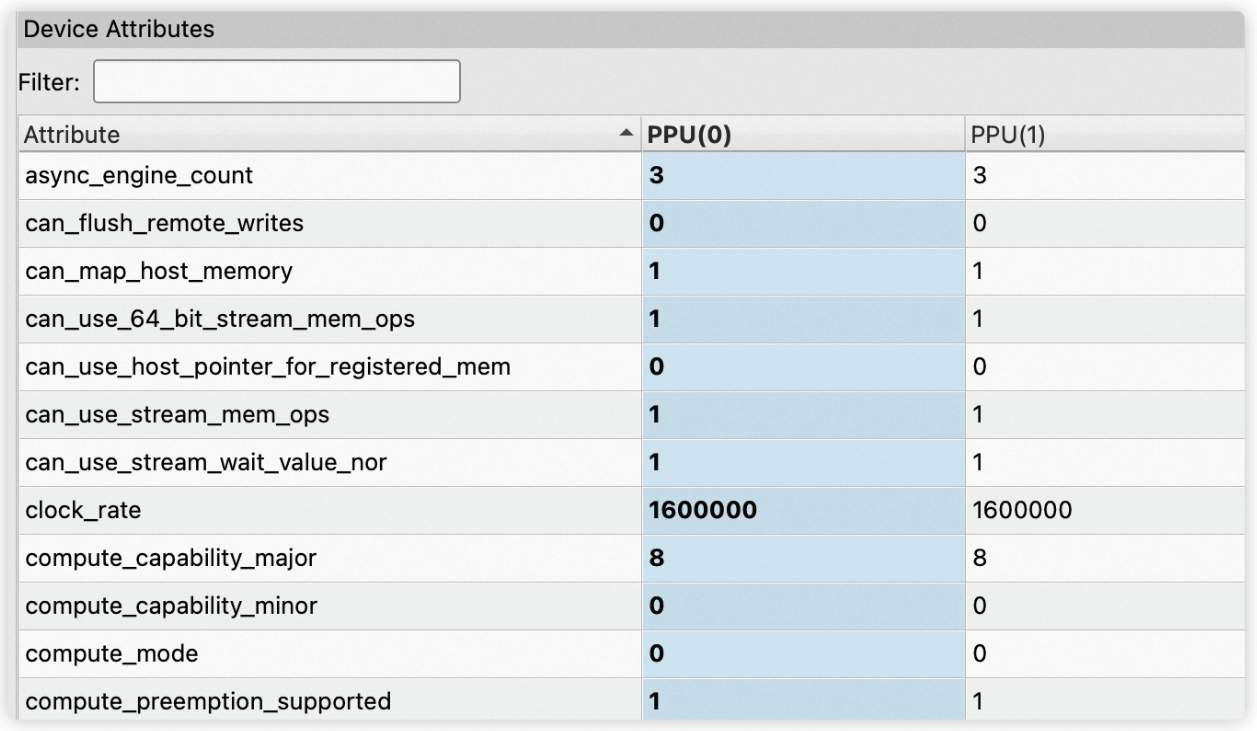
The session page displays basic report information, organized into five groups: launch settings, session info, processes, environment, and device attributes. When you switch between kernels, the session page highlights the device attributes for the selected kernel.
Launch settings
Session info
Environment
Processes
Device attributes
6. Baseline
Asight Compute provides a baseline comparison feature that allows you to compare the profile results of multiple kernels, including those from different reports. The following figure shows the baseline management interface:

The legend for the baselines. In a chart, a baseline's color matches its color in the legend.
The name of the baseline. Hover over the name to rename it.
Add current kernel as baseline
Clear all baselines
Baselines are displayed differently in various UI components.
Baselines in charts
In charts, baselines appear alongside the current kernel. Each baseline's color matches its color in the legend, as the following figures show:

A chart's tooltip also provides detailed information for each baseline.
Baselines in tables
When you have a single baseline, the table displays the percentage difference between the current kernel's metrics and the baseline's corresponding metrics, as shown in the following figure:

When you have more than one baseline, the table displays the standard score in addition to the percentage difference, as shown in the following figure:

7. Occupancy calculator
The Occupancy Calculator page lets you calculate occupancy for a specified configuration and save the results. It contains an input form and a results section with three tabs: Tables, Graphs, and GPU Data:
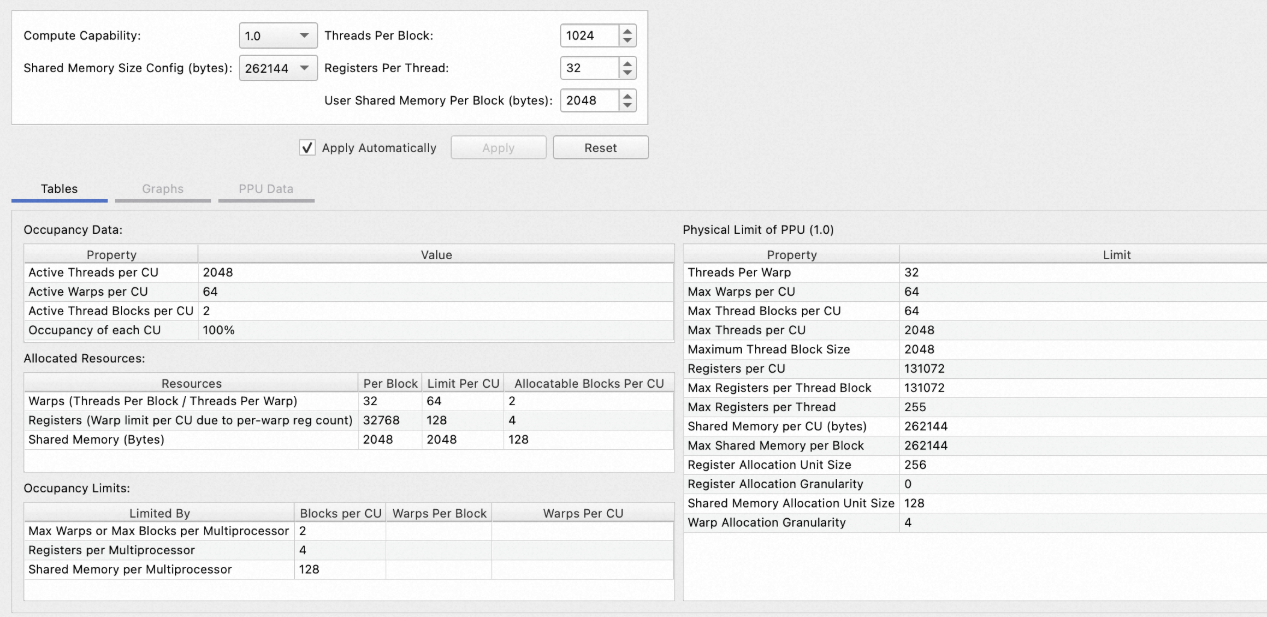
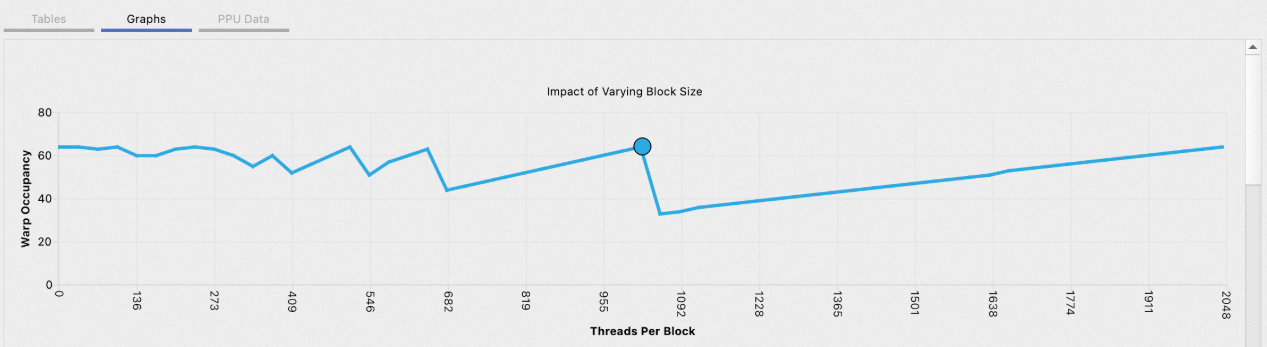

You can create or open a calculator in three ways:
Click the Occupancy Calculator button at the top of the report.
Click the calculator button next to the Occupancy section.
Navigate to File > Open and select a saved .ncu-occ file.


8. Metric details widget
To open the Metric Details Widget on the right, select View > Metric Details from the main menu or click the Metric Details button at the top of the report. In an open report, click a metric on the Details page, Raw page, or Summary page to view its details in the Metric Details Widget. The widget also lets you search for details of a specific metric in the current report.
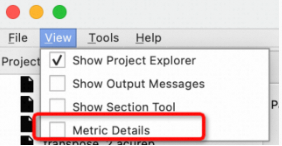

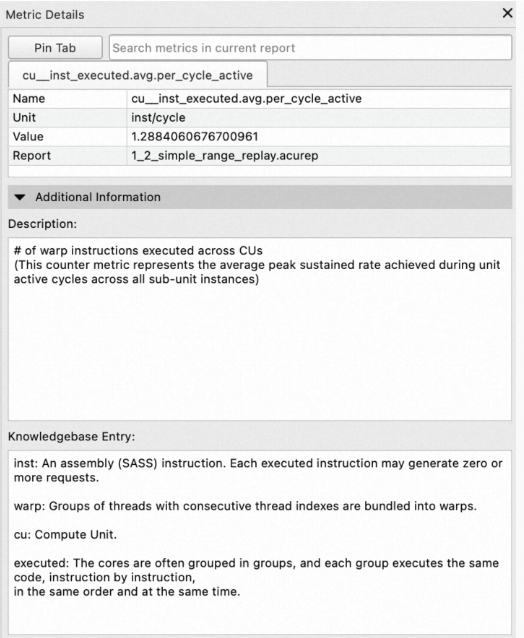
The metric details include the following sections:
Metric information: Includes themetric name,unit,value, andreport.Additional information: Includes themetric descriptionandknowledgebase entry.Instance List: Formetricswith multipleinstances, theInstance Listdisplays thevalueof eachinstance. For example, on theRaw page, select theinst_executedmetricto see theinstruction execution countfor eachassembly code address. In addition toinstruction execution countmetrics, such asinst_executedandthread_inst_executed, other multi-instancemetricsinclude instruction statisticsmetrics, such assass__inst_executed_per_opcode, andstall reasonmetrics, such aspu__pcsamp_warps_issue_stalled*.
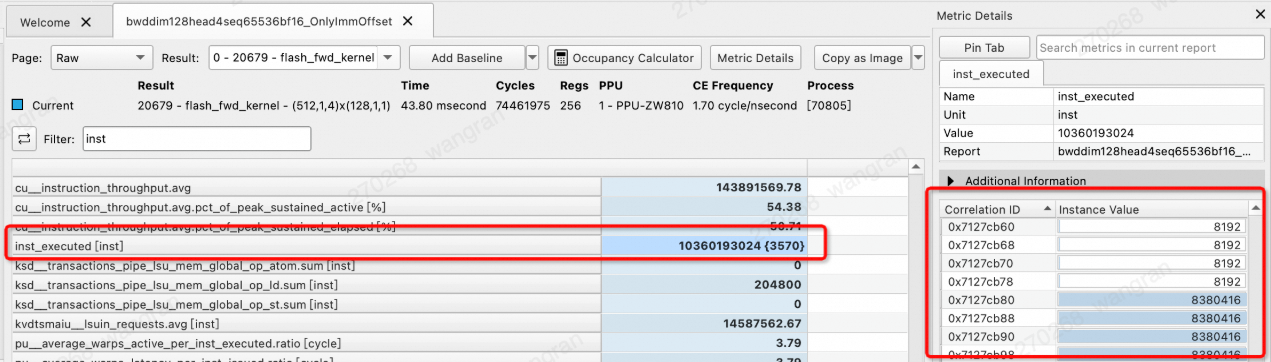
When you click a metric in the report or search for one, its details appear by default in the Default Tab. You can click the Pin Tab button to pin the metric from the Default Tab to a new tab (a Pinned Tab). This lets you temporarily store multiple metrics and easily switch between them for comparison.