On the Region tab, you can query the average startup time, average page load time, device distribution, and device percentage for a mobile application based on specified conditions.
Terms
Aggregate data is data for a specific time period, which is displayed in aggregation dimensions of 1 minute, 5 minutes, 1 hour, or 1 day.
For example, if you select a 1-day aggregation dimension, the data for the last 7 days is displayed.
For the 1-minute and 5-minute dimensions, the default time range is the last 15 minutes.
For the 1-hour dimension, the default time range is the last day.
For the 1-day dimension, the default time range is the last 7 days.
Data description
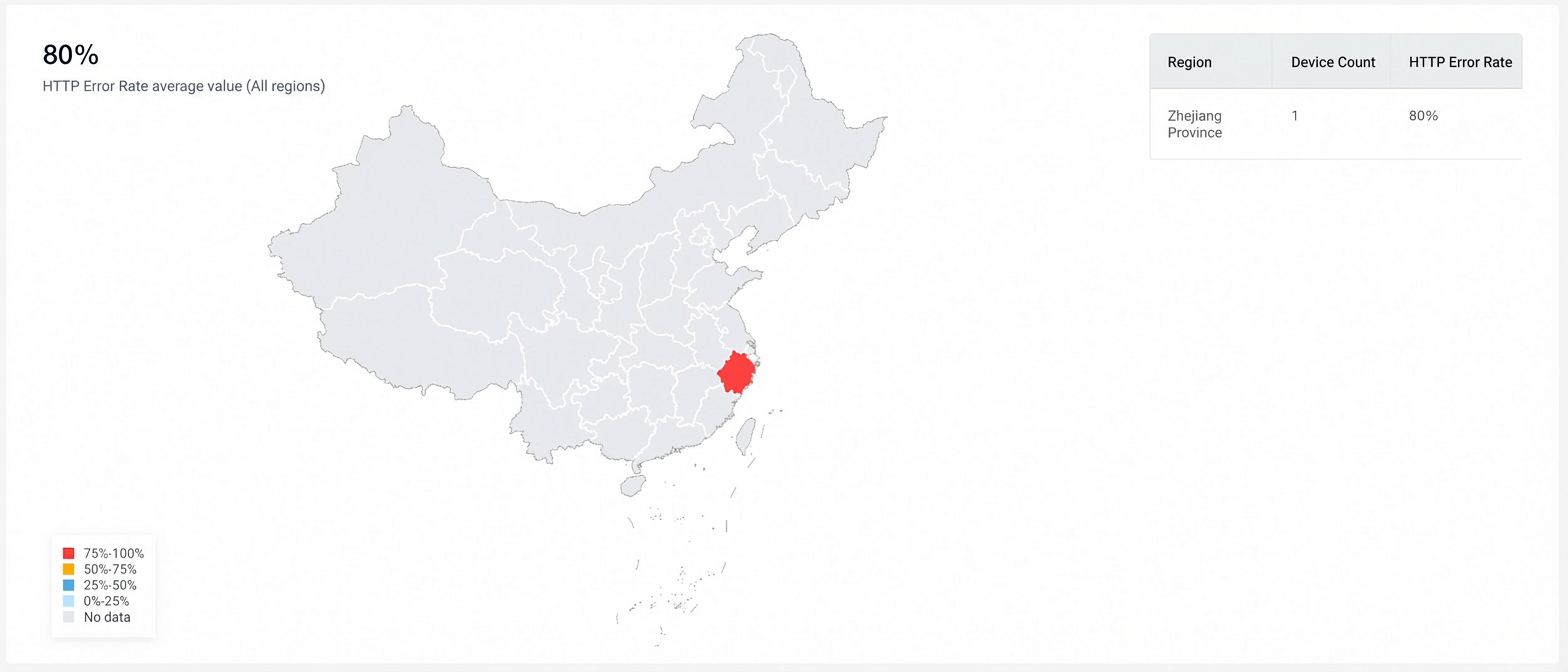
The data displayed on the Region tab includes:
Data | Description |
Region list | Shows the number of devices and the selected metric for each region. |
Metric heatmap | Shows the average metric for each region on a map. Darker colors indicate a larger time metric. Lighter colors indicate a smaller metric. |
Hover over a region on the heatmap to view its metrics and device count.