Analyzing reports with an expert system
1. Expert system
The expert system is an intelligent analysis system in Asight Systems that helps identify common performance issues. It analyzes events in the report and provides optimization recommendations to tune performance more effectively.
1.1 Use the expert system from the CLI
Run theasys analyze subcommand to analyze an .asysrep file and generate analysis reports. Theasys analyze subcommand uses the following syntax:asys analyze [option] <file.asysrep>.
1.1.1 Specify the analysis rule
asys analyze supports multiple analysis rules. To view detailed descriptions of the available rules, runasys analyze --help-rules ALL.
Use the--rule option to specify an analysis rule. You can specify this option multiple times or provide a comma-separated list to specify multiple rules. If an analysis rule is not specified, asys uses the default rules to generate the report.
For example, to generate a report using theppu_gaps andppu_time_util analysis rules:
asys analyze --rule ppu_gaps,ppu_time_util report.asysrep1.1.2 Specify the output format
asys analyze lets you specify the report output format using the--format option. To view the supported output formats and help information, runasys analyze --help-formats ALL.
column: The default format for console output. It presents data in a human-readable column layout. The following options are supported:
Unit settings: Specifies the unit and precision for the output data.
csv: The default format for file output. It presents data in CSV format, which can be easily exported for further processing. The following options are supported:
Unit settings: Specifies the unit and precision for the output data.
xlsx: Outputs a spreadsheet in .xlsx format, which can be opened in applications such as Microsoft Excel, WPS Office, or LibreOffice. This format makes statistical results easier to read. The following options are supported:
Unit settings: Specifies the unit and precision for the output data.
The Unit Settings option allows you to specify the unit used to display a specific type of data. The supported types and unit options are listed below:
ratio: For ratio or percentage data. The supported units are:%or.1%: One decimal place..2%: Two decimal places..3%: Three decimal places.
For example, you can specify the output in a list format, with ratio type data accurate to three decimal places:
asys analyze -r ppu_time_util --format column:ratio=.3% report.asysrepTip: If a report has many columns, the column output format hides some of them by default. To control which columns are displayed, use thecolumn option for the specific analysis rule.
1.1.3 Specify the output destination
Use the--output option to specify the output destination. Three destinations are available: print to the console, output to a file, or pipe to a command. By default, asys prints the output to the console.
Use--output % to print to the console. For example:
asys analyze --output % --rule ppu_gaps report.asysrepUse--output <directory> to save the report to a file in the specified directory. asys generates a filename based on the report name, analysis rule, and output format:<report_name>_<rule_name>.<format>. For example, the following command generates theppu_gaps analysis report forreport.asysrep and saves it asreport_ppu_gaps.csv in the current directory (.):
asys analyze --output . --rule ppu_gaps report.asysrepUse--output @post_command to pipe the output to anotherpost_command for post-processing. asys analyze sends the analysis report content to the specified command through a pipe. For example, to usegrep 1142417 to find results that contain the keyword1142417:
asys analyze --output "@grep 1142417" --rule ppu_gaps report.asysrep1.1.4 Specify the output columns
The asys analyze command supports specifying the output columns for each report type. The statistical results will then include only the specified columns. To specify the columns, use the column option and separate multiple column names with a forward slash (/). For example:
asys analyze -r "ppu_gaps:column=Duration/Device ID" -r "ppu_time_util:column=In-Use/Device ID" report.asysrepThe
ppu_gapsanalysis report will include only theDurationandDevice IDcolumns.The
ppu_time_utilanalysis report will include only theIn-UseandDevice IDcolumns.
1.1.5 Specify the time range
Use the--filter-time option to specify the analysis time range. The format isstart_time/end_time, with time measured in nanoseconds as an offset from the start of the collection. You can omit either the start or end time. For example, to analyze trace data from 10 to 20 seconds:
asys analyze --filter-time 10000000000/20000000000 --rule ppu_gaps report.asysrepAlternatively, use the--filter-hgtx option to specify the time range using HGTX annotations. If the--filter-hgtx option is specified, the--filter-time option has no effect.
With--filter-hgtx, you can specify the name, domain, and index of the HGTX range to match. The format isrange_name@domain/index. If the matched HGTX range has no domain, you can omit @domain. Otherwise, @domain is mandatory.
By default, asys uses the first matching HGTX range as the analysis time range. In this case, you can omit /index. To specify a match by its index, use /index. The index is 0-based.
For example, to specify the time range using an HGTX range named self_attention (no domain) and use the first match:
asys analyze --filter-hgtx self_attention --rule ppu_gaps report.asysrepFor example, to specify the time range using an HGTX range named pcclGroupEnd with the domain NCCL, and use the ninth match (index 8):
asys analyze --filter-hgtx "pcclGroupEnd@NCCL/8" --rule ppu_gaps report.asysrepTips:
The timestamp format in the
asys analyzeoutput depends on the selected--ruleoption. To normalize timestamps, specify the--ts-normalize trueoption to convert them to UTC time.asys analyzelets you manually adjust the timestamp offset using the--ts-shiftoption. You can use this option in conjunction with--ts-normalize.
1.2 Expert system rules
1.2.1 PPU gap analysis
Analyzes and summarizes PPU gaps (long PPU idle periods, also known as PPU bubbles) from an .asysrep report. The results are sorted by duration in descending order.
For each PPU device, this rule inspects each process to find idle periods that meet a specified threshold. The analysis covers the time range from the first PPU activity to the last PPU activity on that device.
Required asys collection option:--trace hggc
Analysis rule
A PPU is idle when none of the following activities are occurring:
Executing a kernel
Executing a memcpy or memset operation
Performing video encoding or decoding
The rule identifies PPU idle periods on a per-process, per-PPU basis. If an idle period exceeds the threshold specified by the gap parameter, the rule includes it in the statistical results.
The results are sorted by duration in descending order.
The ppu_gaps table contains the following columns:
Row# : Row number of the PPU gap
Duration [ns] : Duration of the PPU gap
Start [ns] : Start time of the PPU gap
PID : Process identifier
Device ID : PPU device identifier
Command-line usage
asys analyze --rule ppu_gaps report.asysrepWhen using the--rule option to selectppu_gaps, you can specify analysis parameters by appending multiple:option arguments. For detailed help information, runasys analyze --help-rules ppu_gaps. Supported options include:
rows=<limit>: Limits the number of PPU gap results in the output.gap=<threshold>: Sets the time threshold for a long idle period, in milliseconds.
For example, to analyze PPU gaps with an idle time threshold of 20 ms and output the 10 longest gaps:
asys analyze --rule ppu_gaps:rows=10:gap=20 report.asysrepThe following is an example of the report output:
Row#,Duration,Start,PID,Device ID,
1,1232895501,126020393150,1142419,6,
2,1219910832,126016153086,1142417,4,
3,1219804936,126017799911,1142416,3,
...
GUI guide
Settings
Maximum number of results: Limits the maximum number of PPU gap results to output. Default: 50.
Minimum duration of PPU gaps in ms: Specifies the time threshold for a long idle period. The unit is
milliseconds. The default value is 500.
Table right-click menu
Highlight or zoom to the selected range in the Timeline View.
Pie chart statistics: Summarizes the total duration of PPU gaps for each process and device. Use the pie chart to identify which process or device has more gaps.
1.2.2 PPU time utilization analysis
Analyzes and summarizes PPU time utilization from an .asysrep report and outputs periods of low utilization in ascending order. For each PPU device, the rule inspects each process based on the selected range mode. It divides the time range into equal-sized chunks and calculates the PPU time utilization for each chunk.
If you select PPU Active Time Range mode, the analysis covers the time range from the first PPU operation to the last PPU operation on that device. If you select Filtered Time Range mode, the analysis uses the specified filter time range. Note that this rule measures time utilization, not resource utilization. Therefore, a simple memcpy operation has the same "utilization" as a complex kernel that uses all available resources. If multiple operations run concurrently within the same chunk, their busy time is combined, and the total utilization cannot exceed 100%. The results show chunks where the utilization percentage is below the specified threshold. If multiple consecutive chunks have low utilization, they are merged into a single entry, and a weighted average is used to calculate the utilization. As a result, the duration of each entry may vary.
Required asys collection option:--trace hggc
Analysis rule
A PPU is busy when any of the following activities are occurring:
Executing a kernel
Executing a memcpy or memset operation
Performing video encoding or decoding
On a per-process, per-PPU basis, the total active time of a PPU is calculated from the start of the first activity to the end of the last activity.
The total active time is divided into equal-length time segments based on the chunks parameter. For each time segment, the time utilization of the PPU is calculated as follows: Active time/Time segment length.
Time periods in which the time utilization is lower than the threshold parameter are included in the statistical results. If multiple adjacent time periods have a time utilization lower than the threshold parameter, these periods are merged and their combined utilization is output as a single statistical result.
The statistical results are sorted by time utilization in ascending order.
Tips:
The time of overlapping activities, such as concurrent kernels or memcpy operations, is not double-counted. The time utilization for any segment cannot exceed 100%.
In the GUI, you can select a time range on the timeline, right-click, and select
Filter and zoom into specify the time range for filtering.You can calculate the PPU time utilization for the entire report by adjusting the
chunksandthresholdparameters, for example:asys analyze --rule ppu_time_util:threshold=100:chunks=1:range-mode=full report.asysrep.
The columns of the ppu_time_util table are described as follows:
Row# : Row number of the chunk
In-Use [%] : Percentage of time the PPU is being used
Duration [ns] : Duration of the chunk
Start [ns] : Start time of the chunk
PID : Process identifier
Device ID : PPU device identifier
Command-line usage
asys analyze --rule ppu_time_util report.asysrepWhen using the--rule option to selectppu_time_util, you can specify analysis parameters by appending multiple:option arguments. For detailed help information, runasys analyze --help-rules ppu_time_util. Supported options include:
rows=<limit>: Limits the number of low-utilization period results in the output.threshold=<percent>: Sets the PPU busy time percentage threshold.chunks=<number>: The number of segments to divide the total active time into.range-mode=<mode>: The selection mode for the statistics time range, supporting theactiveandfullmodes.active: Default mode. The time range is from the first PPU activity to the last PPU activity.full: The time range is the user-specified analysis time range. If no time range is specified, the time range of the entire report is used.
compute-pipe=<index_list>: Specifies the list of Compute Pipes to include in the statistics. Separate multiple pipe indexes with a/character. If this parameter is not specified, statistics for all Compute Pipes are collected by default. You can use this parameter to analyze time utilization when MPS mode is enabled.merge-process-id: Merges the statistical results for all processes to provide a per-device time utilization summary.
For example, to analyze PPU time utilization with a threshold of 60%, divide the time into 80 segments, and output the 20 results with the lowest utilization:
asys analyze --rule ppu_time_util:rows=20:threshold=60:chunks=80 report.asysrepThe following is an example of the report output:
Row#,In-Use,Duration,Start,PID,Device ID,
1,0.000000,12411,124667294244,1142418,5,
2,0.000000,7648,124667369358,1142419,6,
3,0.000000,7648,124667378918,1142419,6,
4,2.425268,7092,124667285970,1142418,5,
5,4.258319,7092,124667278287,1142418,5,
...
GUI guide
Settings
Maximum number of results: Limits the maximum number of low-utilization period results to output. Default: 50.
MPS compute pipe index: Sets the MPS compute pipe index to be included in the analysis. Default: All (includes all compute pipes).
Minimum percentage of PPU time utilization: Sets the PPU busy time percentage threshold. The rule outputs intervals where the PPU time utilization is below this value. Default: 50.
Number of equal-duration chunks: The number of segments to divide the total active time into. Default: 100.
Time Range Mode: Sets the mode for the analysis time range:
PPU Active Time Range: Default mode. The time range is from the first PPU activity to the last PPU activity.Filtered Time Range: The time range is the user-specified analysis time range. If no time range is specified, the time range of the entire report is used.
Table right-click menu
Highlight or zoom to the selected range in the Timeline View.
Pie chart statistics: Summarizes the total duration of low-utilization periods for each process and device. Use the pie chart to identify which process or device has lower utilization.
2. Statistics
The statistics system is a key feature of Asight Systems. It analyzes data from reports to give you a complete picture of your program's performance.
2.1 Using the statistics console
Similar to Function View, you can switch to the Statistics System page using the tabs at the bottom, as shown below:
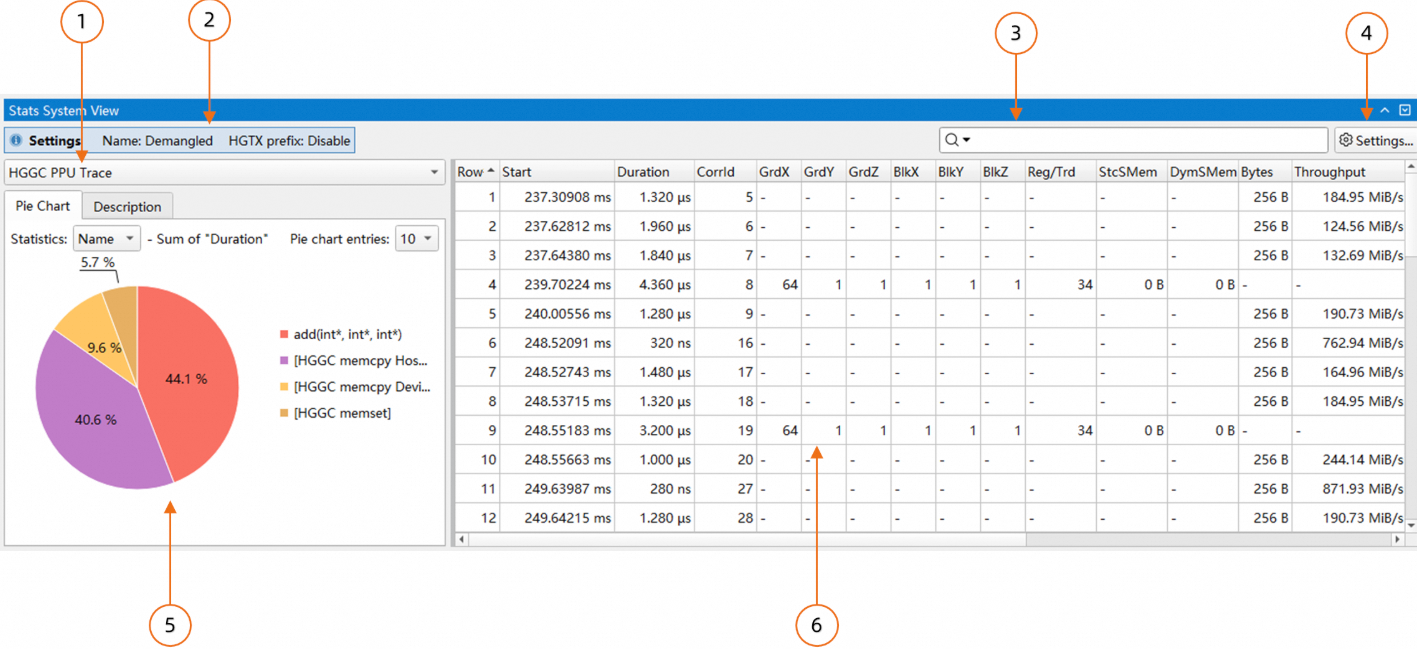
rule list: Select a statistics rule.
Current parameter configuration: Displays the current parameters. Hover over a parameter to view its details.
search box: Supports both search and filter modes.
parameter configuration dialog box: Change the parameters for the current statistics rule.
statistics results pie chart and optimization suggestions: Use the tabs at the top to switch between the pie chart and related optimization suggestions.
statistics results table: Displays the analysis results for the current rule. You can export the results from the context menu.
2.1.1 Setting a time range
Use the filter in Timeline View to set a time range. The Statistics System calculates statistics only for events within this range. To set the time range, press and hold the left mouse button and drag to select an area in the Timeline View. Then, open the context menu for the selected area and click "Filter and Zoom in".
2.1.2 Jumping to Timeline View
For some rules, such as Trace and Detail rules, you can jump from the statistics table to the corresponding location in Timeline View. To do this, open the context menu on a table row and select the jump option.
2.1.3 Statistics results pie chart
In addition to a table, the Statistics System also displays statistics results as a pie chart:
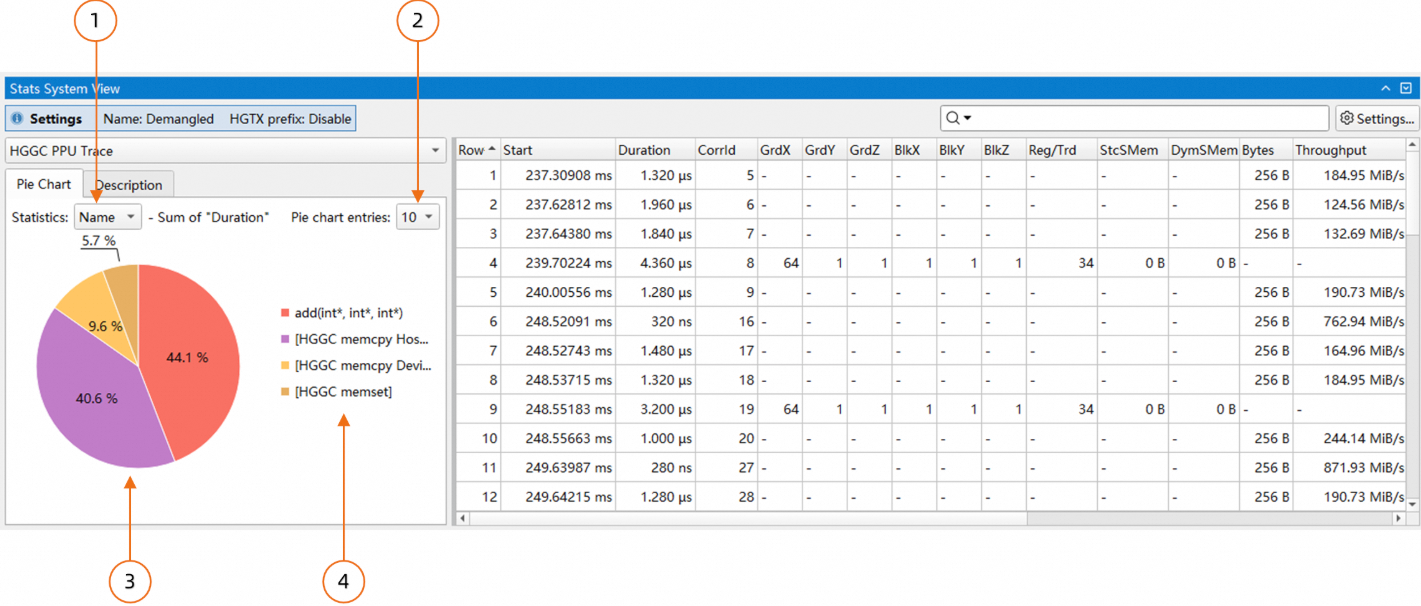
In the figure above:
The pie chart groups the data from the table on the right using
Nameas the key. For each group, it sums the values from theDurationcolumn and displays the group's percentage of the total duration. You can select a different key from the combo box.Set the number of sectors to display.
The pie chart. Each sector's percentage represents a
Namecategory's share of the totalDurationacross all categories.The legend lists the
Namevalues for each category, sorted in descending order byDuration.
You can click a sector in the pie chart to filter the table. Clicking a sector updates the table to show only the rows for that key, as shown in the following figure:
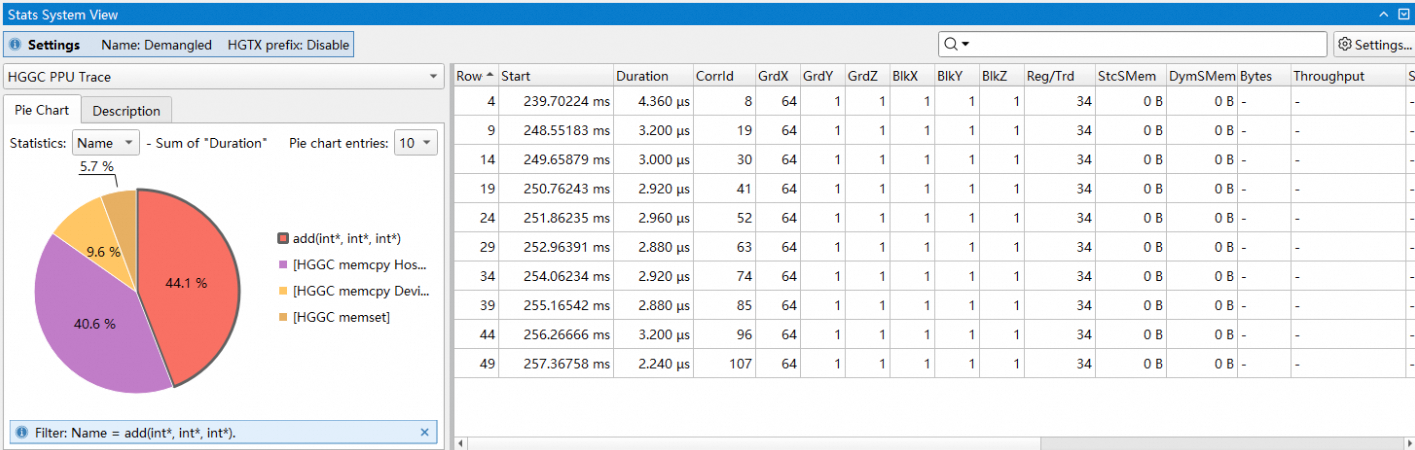
In the figure above, the sector for add(int*,int*,int*) was clicked. As a result, the table on the right displays only items with this name, hiding all others. To reset the table, click the selected sector again or click any empty area of the pie chart.
2.1.4 Calculating column sums for selected rows
In the Statistics System, some rules let you calculate the column sum for selected rows. The result appears in the table header, as shown in the following figure:
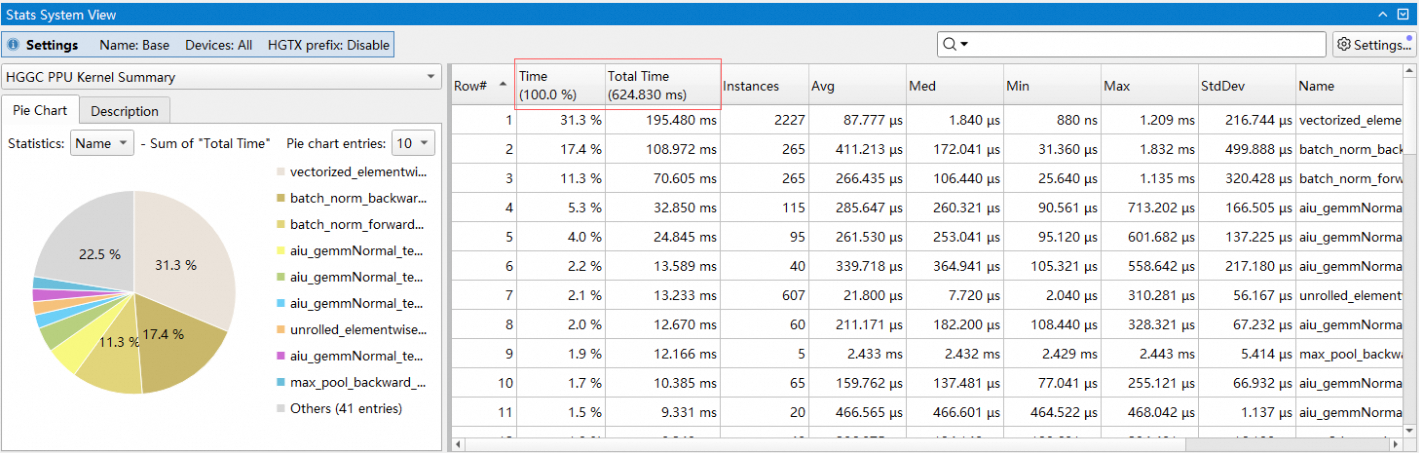
In the figure above, the first three rows are selected. The table header displays the sum of the Time and Total Time columns for the selected rows.
2.2 Use the command-line statistics system
Run the asys stats command to perform statistical analysis on a report. This command provides efficient statistical and trace export functions. You can output the analysis results to the console, a file, or a command pipeline for easy review and post-processing. You can also view some statistical and analysis results in the Asight Systems GUI.
The stats subcommand is used as follows:
asys stats [option] <file.asysrep>When you use the asys profile command to collect a trace, you can specify the --stats true option to output statistical results after the report is generated. The output is similar to that of asys stats report.asysrep. For example:
asys profile --stats true python test_linear.py--stats true: Outputs a report with statistical results after the collection is complete.
2.2.1 Specify the statistics report type
asys stats supports various statistics report types. Run asys stats --help-reports ALL to view detailed descriptions of the statistics report types.
You can use the --report option to specify the statistics report type. You can specify this option multiple times or use a comma-separated list to specify multiple report types. If you do not specify this option, the default statistics report type is used to generate the report.
For example, use the hggc_ppu_kern_sum and device_memory_usage_summary statistics report types to generate a report:
asys stats --report hggc_ppu_kern_sum,device_memory_usage_summary report.asysrepThe report type specified by the --report option may contain configuration options. In these configuration options, you must escape commas (,) and colons (:) with a backslash (\). In a command-line environment such as bash, enclose the value of the configuration option in double quotes ("). For example:
asys stats --report ppu_op_sum:range-include="seqlen_q\:1\,is_fixed_seqs\:0\,head_dim\:128/data_type\:fp8\,groups\:1\,m\:925":range-exclude="em\:0\,gpu\:1" report.asysrep2.2.2 Specify the report output format
asys stats supports multiple output formats. You can run asys stats --help-formats ALL to view the supported output formats and help information.
You can use the --format option to specify the output format for the statistical report. You can specify this option multiple times or use a comma-separated list to specify multiple output formats.
If you do not specify an output format, the default is column for console output and csv for file output.
column: Presents data in a human-readable column layout. The following options are supported:
Unit Settings: Sets the unit and precision of the output data.
csv: Presents data in CSV format, ideal for post-processing. The following options are supported:
Unit Settings: Set the unit and precision of the output data.
xlsx: Outputs an .xlsx spreadsheet that you can open with an office suite, such as Microsoft Excel, WPS Office, or LibreOffice, for better readability. The following options are supported:
Unit Settings: Sets the unit and precision of the output data.
The Unit settings option allows you to specify the unit used to display a specific type of data. The supported types and unit options are as follows:
ratio: Ratio or percentage data. Supported units:%or.1%: Accurate to one decimal place.2%: Accurate to two decimal places.3%: Precise to three decimal places
For example, if you specify the output in a list format, the ratio data is accurate to three decimal places:
asys stats -r hgtx_ppu_proj_sum --format column:ratio=.3% report.asysrepTips:
If a report has a large number of output columns, the column output format hides some columns by default. You can specify the
columnoption of the statistics report type to control which columns are displayed.The XLSX format does not support output to the terminal. If you specify the terminal as the output destination, the output is in the
columnformat.
2.2.3 Specify the report output type
asys stats supports multiple report output types, including output to the console, a file, and a command.
You can use the --output option to specify the output type for the report. You can specify this option multiple times or use a comma-separated list to specify multiple report output types. If you do not specify this option, the output is sent to the console by default.
If the specified output name is
"%", the analysis results are displayed on the console.If the output name starts with
"@", the output target is a command to be executed.Any other output name is considered a combination of the
output directoryand thefilename prefixin the format<output_dir>/<prefix>. The prefix can be empty. The path before the last/is considered the output directory.
The following table describes the output types:
Output type | Syntax | Description |
Console output |
| Prints the analysis results directly to the console (stdout) without generating a file. |
Default file output |
| Outputs to the same directory as the asysrep report, using a default base filename with the format:
|
Custom file output |
| The output is saved to the
|
Command pipeline output |
| Pipes the analysis results to the standard input of a specified command. The stdout/stderr of the command is still printed to the console. |
You can use --output % to directly output the analysis results to the console. For example:
asys stats --output % --report hgtx_sum report.asysrepUsing --output . saves the analysis results to the directory that contains the asysrep report. The asys tool then generates a filename for the output report based on the filename of the asysrep report, the specified statistics report type, and the output format.
For example, specifying --output . generates a statistical report of the hggc_api_sum type for report.asysrep in its directory, and saves the report as report_hggc_api_sum.csv.
asys stats --output . --report hggc_api_sum report.asysrepFor example, if you specify --output /test/mytest, a statistical report of type hggc_api_sum for report.asysrep is generated in the /test directory and saved as a local file named mytest_hggc_api_sum.csv.
asys stats --output /test/mytest --report hggc_api_sum report.asysrepYou can use --output @post_command to pipe the output of a statistical report to the specified post_command command for post-processing.
For example, use grep 1142417 to filter for results that contain the keyword 1142417:
asys stats --output "@grep 1142417" --report device_memory_usage_summary report.asysrep2.2.4 Specify report output columns
The asys stats command supports specifying the columns to output for each statistics report type. Only the specified columns are then included in the statistical results. To specify the columns, use the column option and separate multiple column names with a forward slash (/). For example:
asys stats -r "hggc_ppu_kern_sum:column=Time/Name" -r "hgtx_ppu_proj_sum:column=Range/Total Proj Time" report.asysrepThe
hggc_ppu_kern_sumreport outputs only theTimeandNamecolumns.The
hgtx_ppu_proj_sumreport only outputs theRangeandTotal Proj Timecolumns.
2.2.5 Specify operator recognition rules
The statistical results of the asys stats command include comparisons of PPU operators. The command identifies operators in the report and collects performance statistics by using built-in PPU operator identification rules. You can use the --ppu-op-config option to create custom operator identification rules. A custom rule allows you to specify a regular expression to identify an operator type by matching an HGTX range name or a kernel name. The format is Operator Type=Match Type:Filter Rule. You can specify the --ppu-op-config option multiple times to create multiple operator identification rules. For example:
asys stats --ppu-op-config GEMM=kernel:gemv --ppu-op-config Pytorch=hgtx:aten report.asysrep--ppu-op-config GEMM=kernel:gemv: Matches kernels whose kernel name contains the keywordgemv, and classifies them as theGEMMoperator type.--ppu-op-config Pytorch=hgtx:aten: Matches HGTX range names that contain the keywordatenand classifies the PPU activities associated with these ranges as thePytorchoperator type.
2.2.6 Specify the statistics time range
You can use the --filter-time option to specify a time range for statistics. The time is specified in the start time/end time format, where the value is the offset time from the start of collection in nanoseconds. You can omit either the start time or the end time. For example, you can specify statistics for trace data from the 10th second to the 20th second.
asys stats --filter-time 10000000000/20000000000 --report device_memory_usage_summary report.asysrepYou can use the--filter-hgtx option to specify the time range for statistics by using HGTX annotations. When the--filter-hgtx option is specified, the--filter-time option is ignored.
Use the --filter-hgtx option to specify the name, domain, and match index of a matching HGTX range in the format range_name@domain/index. If the matching HGTX range does not have a domain, @domain can be omitted. Otherwise, @domain must be specified.
By default, asys uses the first matched HGTX range as the time range for statistics. In this case, the /index part can be omitted. If you need to specify a match index, use /index. The index starts from 0.
For example: Use the self_attention HGTX range to specify the statistics time range. If no domain is specified, the time range of the first matching HGTX range is used.
asys stats --filter-hgtx self_attention --report device_memory_usage_summary report.asysrepFor example, use the HGTX range named pcclGroupEnd to specify the statistics time range, where the domain is NCCL and the time range of the 9th matching HGTX range (index 8) is used.
asys stats --filter-hgtx "pcclGroupEnd@NCCL/8" --report device_memory_usage_summary report.asysrep2.2.7 Parameter matching rules
To generate reports with the expert system, you must specify three types of parameters:
1) Report type (and its related parameters)
2) Report format (and its related parameters)
3) Output type (filename, console, or command)
You can specify each of these three parameters multiple times or as a comma-separated list.
The first report uses the first specified format and the first specified output type; the second report uses the second format and second output type, and so on.
If you specify more reports than formats or output types, the system extends the format and/or output lists to match the number of reports by repeating the last specified element in the list (or the default value, if none was specified).
For example:
The following command generates three reports. It outputs the "hggc_api_sum" report in CSV format to the file "report1_hggc_api_sum.csv", and the "osrt_sum" and "hgtx_sum" reports to the console as CSV data. Although three reports are specified with only one format and two output types, the system extends both lists by repeating their last element.
asys stats --report hggc_api_sum --report osrt_sum --report hgtx_sum --format csv --output .,% report1.asysrepTips:
The timestamp information in the asys stats output may vary depending on the
--reportoption. To normalize the timestamp information, you can specify the--ts-normalize trueoption to convert the timestamps to UTC time.The asys stats command supports the
--ts-shiftoption, which manually adjusts the timestamp offset value and can be used with--ts-normalize.
2.3 Statistics system rules
2.3.1 Grouping device memory usage
Analyzes and summarizes PPU device memory usage records from an asysrep report across various data types. This feature groups memory usage by categories such as operator library and framework, and outputs a summary and details for each group.
Required asys collection option: --hggc-memory-usage device
Statistical rules
Summarizes PPU device memory usage records that have been allocated but not released at the per-process, per-PPU level.
For each memory record that was allocated but not released, the tool matches it to a group based on its call stack at the time of allocation, considering the order of frames and keywords matched within each frame.
A memory record can match multiple groups. The output lists all of a record's matching groups, separated by a forward slash (/).
The tool aggregates the memory usage for each combination of groups and sorts the results in descending order of total memory usage.
The following list describes the columns in the device_memory_usage_detail table:
Row# : Row number of the device memory usage
PID : Process identifier
Device ID : PPU device identifier
Group List : The group(s) the memory usage belongs to, separated by '/'
Time [ns] : Memory usage timestamp
TID : Thread identifier
Context ID : Context identifier
Memory : Memory identifier
Size [bytes] : Memory usage size
Access Flag : Memory access flag
Event ID : Memory usage event identifier
The following list describes the columns in the device_memory_usage_summary table:
Row# : Row number of the device memory usage
PID : Process identifier
Device ID : PPU device identifier
Group List : The group(s) the memory usage belongs to, separated by '/'
Memory Usage [bytes] : Device memory usage
Command-line usage
Use the -r <rule>:usage-mode=<mode> option to specify the data type.
The device_memory_usage_detail rule supports two data types:
'all': Exports the All Alloc and Free Trace.
'unreleased': Exports the Unreleased Alloc Trace (default).
The device_memory_usage_summary rule supports four data types:
'alloc-count': Summarizes the Total Alloc Count.
'alloc-size': Summarizes the Total Alloc Size.
'unreleased-count': Summarizes the Unreleased Alloc Count.
'unreleased-size': Summarizes the Unreleased Alloc Size (default).
Use the --callstack-group-config option to add grouping rules. Use the :match-first-group option to assign allocations to only the first matching group. By default, an allocation is assigned to all matching groups.
Use the --report option to specify a group statistics report. For example:
asys stats -r device_memory_usage_summary:usage-mode=unreleased-size:match-first-group \
--callstack-group-config "acompute=(libacblas|libacdnn)" \
--callstack-group-config "launch_kernel=libtorch/LaunchKernel" \
--callstack-group-config "loss=loss.py" \
report.asysrep
-r device_memory_usage_summary: Specifies the device memory usage summary report.:usage-mode=unreleased-size: Specifies the summary for Unreleased Alloc Size.:match-first-group: Assigns a record to only the first matching group.--callstack-group-config "acompute=(libacblas|libacdnn)":Creates a group named
acompute.The regular expression
(libacblas|libacdnn)matches memory usage where the call stack contains either thelibacblasorlibacdnnkeyword.
--callstack-group-config "launch_kernel=libtorch/LaunchKernel":Creates a group named
launch_kernel.The regular expression
libtorch/LaunchKernelmatches memory usage where the call stack shows a hierarchical relationship: a parent function frame contains the keywordlibtorch, and a child function frame contains the keywordLaunchKernel.Unmatched call stack frames can appear between the matching parent and child function frames.
--callstack-group-config "loss=loss.py":Creates a group named
loss.The regular expression
loss.pymatches memory usage where the call stack contains theloss.pykeyword.Matching also works for Python call stacks.
The following is an example of the group statistics output in CSV format. Use the --output option to direct the output to a CSV file.
PID,Device ID,Group List,Memory Usage,
1873,0,launch_kernel,213174,
1873,0,others,48674898730,
1873,0,acompute,1610624066,
1873,0,loss,28591
The report provides a summary of the allocated but not freed memory for the
acompute,launch_kernel, andlossgroups, inbytes.Memory usage that does not match any user-defined group is aggregated into the default
othersgroup.
The device memory usage grouping feature provides the following two report types. You can specify one or more reports by using the --report option:
device_memory_usage_summary: Outputs a summary of unreleased memory for each process, device, and group.device_memory_usage_detail: Outputs each unreleased memory record, along with its assigned group(s).
For a detailed description of the device memory usage grouping feature, including its functionality and output format, run --help-reports. For example, executing asys stats --help-report device_memory_usage_summary produces the following sample output:
root@eb4c64fd3401:~# asys stats --help-report device_memory_usage_summary
device_memory_usage_summary -- Device Memory Usage Summary

    Options:
        match-first-group
            Optional argument. When used with --callstack-group-config:
            If given, only matching the first callstack group.
            Default is matching all callstack group.
        usage-mode=<mode>
            Possible values are 'alloc-size', 'unreleased-size', 'alloc-count' or 'unreleased-count'.
            Specify the memory usage mode.
            If 'alloc-size', statistic overall allocated device memory usage.
            If 'unreleased-size', statistic allocated but not freed device memory usage.
            If 'alloc-count', statistic overall allocated device memory count.
            If 'unreleased-count', statistic allocated but not freed device memory count.
            Default is 'unreleased-size'.
        Use --filter-time / --filter-hgtx to specify report time range.
        Use --callstack-group-config to create report group configuration.
        Try 'asys stats --help' for more information.

    Output:
        Row# : Row number of the device memory usage
        PID : Process identifier
        Device ID : PPU device identifier
        Group List : Memory usage belonged group list, splited by '/'
        Memory Usage [bytes] : Device memory usage

    Group and statistic device memory usage of specified mode,
    If 'alloc-size' mode,  display allocated device memory usage summary.
    If 'alloc-count' mode, display allocated device memory count summary.
    If 'unreleased-size' mode, display allocated but not freed device memory usage summary.
    If 'unreleased-count' mode, display allocated but not freed device memory count summary.
When the group matching policy is set to match multiple groups, the report output shows all groups to which a record belongs, separated by a forward slash (/). For example:
acompute/launch_kernelThe memory usage belongs to both the
acomputeandlaunch_kernelgroups.If the policy is set to 'first match only', the usage is assigned only to the first matching group.
The order of the
--callstack-group-configoptions on the command line determines the group order.
You can use the --callstack-group-config option to create a group and specify matching rules with regular expressions. The format is group_name=frame_filters, where frame_filters specifies the matching regular expressions for multiple frames in the format frame_regex1/frame_regex2/.... The regular expressions for the frames are separated by a forward slash (/), and the frames are ordered from the parent function to the child function. The matching rules for the group are described as follows:
A frame is considered a match if a regular expression can
partially matchthelibrary nameorfunction signatureof the call stack.A group is considered a match if the hierarchical relationship of the matched frames in the call stack matches the hierarchy specified in
frame_filters.
The following is an example of the --callstack-group-config option: you can use --callstack-group-config multiple times to create multiple groups, and each group specifies rules for matching multiple frames:
--callstack-group-config "torch=libtorch" --callstack-group-config "acompute=(libacblas|libacdnn)" --callstack-group-config "buffer_init=_to_copy/empty_strided"Tips:
If you do not add grouping rules by using
--callstack-group-config, the tool uses a set of default built-in rules.If you use multiple
--callstack-group-configoptions to create groups with the same name, a memory record that matches any of the rules for that group name is assigned to that group.
GUI usage guide
Settings
Usage Mode: Specifies the data type for statistics. For the Device Memory Usage Detail report, two data types are available:
Unreleased Alloc Trace: Exports a trace of unreleased memory (default).
All Alloc and Free Trace: Exports a trace of all memory allocations and frees.
For the Device Memory Usage Summary report, four data types are available:
Unreleased Alloc Size: Summarizes the size of unreleased memory (default).
Total Alloc Size: Summarizes the total size of all allocated memory.
Unreleased Alloc Count: Summarizes the number of unreleased allocations.
Total Alloc Count: Summarizes the total number of all memory allocations.
Group Config: Creates groups and specifies matching rules with regular expressions. The format is
group_name=frame_filters, whereframe_filterscan specify one or more regular expressions for frames in the formatframe_regex1/frame_regex2/.... The frame expressions are separated by a forward slash (/) and are ordered from parent function to child function.Only match the first group in order: When checked, assigns a record only to the first matching group in the list (ordered top to bottom). By default, this is unchecked, meaning a record is assigned to all matching groups.
Table Context Menu
In the Device Memory Usage Detail table, the context menu allows you to highlight or zoom to the selected memory trace in the Timeline View.
Pie Chart Statistics: Summarizes unreleased memory usage for each group, process, and device. Use the pie chart to identify potential memory leaks in each category.
2.3.2 HGGC API
This rule summarizes the time spent in HGGC API calls from an asysrep report.
Analysis rule
The statistics are aggregated by HGGC API name, the durations of APIs with the same name are summed, and the results are output in descending order of total time.
The hggc_api_sum table includes the following columns:
Note: The 'Time' column represents this function's execution time as a percentage of the total execution time for all functions in the table, not the entire application.
Row# : Row number of the HGGC API summary
Time [%] : Percentage of 'Total Time'
Total Time [ns] : Total time used by all executions of this function
Num Calls : Number of calls to this function
Avg [ns] : Average execution time of this function
Med [ns] : Median execution time of this function
Min [ns] : Minimum execution time of this function
Max [ns] : Maximum execution time of this function
StdDev [ns] : Standard deviation of the time of this function
Name : Name of the function
Command-line usage
Required asys collection option: --trace hggc
asys stats -r hggc_api_sum report.asysrepTo view detailed help information, run asys stats --help-report hggc_api_sum.
Example output:
Row#,Time (%),Total Time (ns),Num Calls,Avg (ns),Med (ns),Min (ns),Max (ns),StdDev (ns),Name,
1,84.9,393100090,342,1149415,98746,3981,11001565,2011747,"hgMemcpyHtoDAsync_v2",
2,4.3,19851112,1297,15305,5351,2893,3860175,147778,"hgLaunchKernel",
3,2.9,13492044,1486,9079,2861,613,3707197,108998,"hgEventQuery",
4.2.9,13487638,1495,9021,6027,3191,222379,14733,"hggcLaunchKernel",
...
GUI guide
Settings
This rule has no configurable settings.
Pie chart statistics: Summarizes the time spent in each HGGC API.
2.3.3 HGGC API trace
This rule exports the HGGC API trace data from an asysrep report. The results are sorted in ascending order by API call start time.
Required asys collection option: --trace hggc
Statistics rule
This rule exports one row for each HGGC API call.
The following list describes the columns in the hggc_api_trace table:
Row# : Row number of the HGGC API trace
Start (ns) : Start time of the API call
Duration (ns) : Duration of the API call
Name : API function name
CorrID : Correlation ID used to map to other HGGC traces
Pid : Process ID that made the call
Tid : Thread ID that made the call
thread name : Name of the thread that made the API call
Command-line usage
asys stats -r hggc_api_trace report.asysrepTo view detailed help, run asys stats --help-report hggc_api_trace.
Example output:
Row#,Start (ns),Duration (ns),Name,CorrID,Pid,Tid,Thread Name,
1,41550,12737,"cudaProfilerStart",0,104699,104699,"python",
2,938476,28340,"cudaLaunchKernel",130170,104699,104699,"python",
3,999414,9382,"cudaLaunchKernel",130171,104699,104699,"python",
...
GUI usage
Settings
This rule has no configurable settings.
Table right-click menu
Highlight or zoom to the selected HGGC API in the Timeline View.
Pie chart statistics: Summarizes the time spent for each HGGC API. You can also switch to a process-level view for a per-process breakdown.
2.3.4 HGGC kernel execution trace
Exports the execution trace data for HGGC kernels from an asysrep report. The data covers the period from the API launch call to the actual kernel execution and is sorted in ascending order by the start timestamp of the launch API call.
Statistical rules
The exported results are organized as follows: each kernel execution is exported as a single row of data, sorted in ascending order by the start timestamp of its launch API.
If a single HGGC API call, such as an HGGC Graph, is associated with multiple kernels, the report exports a separate row for each kernel.
The queue wait time columns (Queue Start and Queue Dur) are calculated as follows:
A kernel has a wait time if it starts executing after the corresponding HGGC API call finishes.
Wait time = actual kernel start timestamp - HGGC API call end timestamp.
If a kernel begins execution before the HGGC API call finishes, the Queue Start and Queue Dur columns are marked with the invalid value
-.
The hggc_kern_exec_trace table includes the following columns:
Row# : Row number of the kernel trace
API Start [ns] : Start timestamp of the HGGC API launch call
API Dur [ns] : Duration of the HGGC API launch call
Queue Start [ns] : Start timestamp of the queue wait time, if it exists
Queue Dur [ns] : Duration of the queue wait time, if it exists
Kernel Start [ns] : Start timestamp of the HGGC kernel
Kernel Dur [ns] : Duration of the HGGC kernel
Total Dur [ns] : Duration from API start to kernel end
PID : The process ID that made the kernel launch call
TID : The thread ID that made the kernel launch call
DevId : The HGGC device ID that executed the kernel (which PPU)
API Function : Name of the HGGC API call used to launch the kernel
GridXYZ : The grid dimensions for the kernel launch call
BlockXYZ : The block dimensions for the kernel launch call
Kernel Name : Name of the HGGC kernel
Command-line usage
Required asys collection option: --trace hggc
asys stats -r hggc_kern_exec_trace report.asysrepTo view detailed help, run asys stats --help-report hggc_kern_exec_trace. The supported options are listed below:
base: Exports the kernel's base name (function name only, without parameters).
mangled: Exports the kernel's mangled name.
By default, the exported HGGC kernel name is its demangled name.
Example report output:
Row#,API Start (ns),API Dur (ns),Queue Start (ns),Queue Dur (ns),Kernel Start (ns),Kernel Dur (ns),Total Dur (ns),PID,TID,DevId,API Function,GridXYZ,BlockXYZ,Kernel Name,
1,504935256,20348911,525284167,21237024,526172280,357034784,378271808,631660,631660,0,"hggcLaunchKernel","2 1 1","512 1 1","pcclKernel_AllReduce_RING_LL_Sum_int8_t(pcclWorkElem)",
2,845563829,20332834,865896663,20934656,866498485,17898735,38833391,631660,631660,1,"hggcLaunchKernel","2 1 1","512 1 1","pcclKernel_AllReduce_RING_LL_Sum_int8_t(pcclWorkElem)",
3,884469702,40488,884510190,627234,885096936,16944871,17572105,631660,631660,0,"hggcLaunchKernel","2 1 1","512 1 1","pcclKernel_AllReduce_RING_LL_Sum_int8_t(pcclWorkElem)",
...
GUI guide
Settings
Kernel Name Mode: Sets the display mode for the kernel name. The options are:
Base: Displays the kernel's base name (function name only, without parameters).
Mangled: Displays the kernel's mangled name.
Demangled: Displays the kernel's demangled name (default).
Table right-click menu
Highlight or zoom to the selected HGGC API call in the Timeline View.
Highlight or zoom to the selected Device Activity in the Timeline View.
Pie chart statistics: Summarizes the total kernel execution duration aggregated by kernel, process, and device.
2.3.5 HGGC kernel grid and block
Collects statistics from the asysrep report about HGGC kernels, grid sizes, and block sizes, and outputs the statistics for each kernel name, each grid size, and each block size.
Required asys trace option: --trace hgtx,hggc
Statistical rules
Statistics are calculated as follows:
Aggregates kernel execution information for kernels with
same kernel name,same grid size, andsame block size: kernel execution time, instances, etc.If the
hgtx-nameoption is enabled, thekernel namecontains the appended HGTX range name.
The statistical results are organized as follows: one row of data is exported for each unique combination of kernel name, grid size, and block size, and the results are output in descending order by the Total Time column.
The columns of the hggc_ppu_kern_gb_sum table are described as follows:
Note: The 'Time [%]' column shows the kernel's execution time as a percentage of the total execution time for all kernels in this report. This value is calculated from the 'Total Time [ns]' column and is not a percentage of the total application execution time.
Row# : Row number of the kernel summary
Time [%] : Percentage of 'Total Time'
Total Time [ns] : Total time used by all executions of this kernel
Instances : Number of calls to this kernel
Avg [ns] : Average execution time of this kernel
Med [ns] : Median execution time of this kernel
Min [ns] : Smallest execution time of this kernel
Max [ns] : Largest execution time of this kernel
StdDev [ns] : Standard deviation of the time of this kernel
GridXYZ : Grid dimensions for kernel launch call
BlockXYZ : Block dimensions for kernel launch call
Name : Name of the kernel
Command-line usage
asys stats -r hggc_ppu_kern_gb_sum report.asysrepYou can use asys stats --help-report hggc_ppu_kern_gb_sum to view detailed help information. The supported options are as follows:
hgtx-name: The name of the HGTX range closest to the kernel launch is prefixed to the kernel name, separated by
/.base: Aggregates and displays statistics using the kernel's short name (function name only, without parameters).
mangled: Aggregates and displays statistics using the mangled name of the kernel.
device: Specifies the list of PPU device IDs for which to collect statistics. Multiple PPU device IDs are separated by a
/. If this parameter is not specified, statistics for all PPU devices are collected by default.
The following is an example of the report output:
Row#,Time (%),Total Time (ns),Instances,Avg (ns),Med (ns),Min (ns),Max (ns),StdDev (ns),GridXYZ,BlockXYZ,Name,
1,6.7,16337781,65,251350,260801,115520,277681,39767,"960 1 64","256 1 1","[prof_range]: iter 9/_ZN5acdnn4cuda9transposeILNS0_8LoopModeE0ELi32ELi8ELb0ELb0EN7",
2,3.1,7415267,20,370763,370601,366482,374162,1936,"2048 1 1","512 1 1","[prof_range]: iter 8/_ZL35batch_norm_bwd_single_vector_accessILb0EN5acdnn16identity",
3,3.0,7348069,20,367403,366401,361281,375921,3885,"122880 1 1","128 1 1","_ZN2at6native29vectorized_elementwise_kernelILi4EZZZNS0_12",
GUI guide
Settings
Kernel name mode: Sets the display mode for the kernel name. Options include:
Base: Displays the short name of the kernel (function name only, without parameters).
Mangled: Displays the mangled name of the kernel.
Demangled: Displays the demangled name of the kernel (default).
PPU devices: Filters the report to show statistics for only the selected PPU devices. The default value is "All", which includes data from all PPU devices. This field cannot be empty.
Add HGTX name as a prefix: Prepends the name of the HGTX that is closest to the kernel launch, separated by a
/. This option is not selected by default.
Pie chart statistics: Summarizes the total execution time for all kernels.
2.3.6 HGGC kernel, grid, and block trace
Exports trace data for HGGC kernel executions from an asysrep report, including grid size and block size. The results are sorted in ascending order of the execution start time.
Analysis rule
The exported results are organized as follows: one row of data is exported for each kernel execution, and the data is sorted in ascending order by the start time of each kernel.
The hggc_ppu_kern_gb_trace table columns are described as follows:
Row# : Row number of the kernel trace
Start [ns] : Timestamp of start time
Duration [ns] : Length of event
PID : process identifier
Device ID : PPU device identifier
Context ID : context identifier
Stream ID : stream identifier
GridXYZ : grid dimensions for kernel launch call
BlockXYZ : block dimensions for kernel launch call
Name : Name of the kernel
Command-line usage
Required asys collection option: --trace hgtx,hggc
asys stats -r hggc_ppu_kern_gb_trace report.asysrepYou can view detailed help information by running the asys stats --help-report hggc_ppu_kern_gb_trace command. The supported options are listed as follows:
hgtx-name: The name of the HGTX range closest to the kernel launch is prepended to the kernel name by using
/.base: Groups and displays statistics by the kernel's short name (function name only, without parameters).
mangled: Groups and displays statistics by the kernel's mangled name.
Example output:
Row#,Start (ns),Duration (ns),PID,Device ID,Context ID,Stream ID,GridXYZ,BlockXYZ,Name,
1,970508,6240,104699,0,1,1,"3 1 1","128 1 1","[prof_range]: iter 5/unrolled_elementwise_kernel",
2,1014188,44480,104699,0,1,1,"15360 1 1","128 1 1","[prof_range]: iter 5/unrolled_elementwise_kernel",
3,1158469,98480,104699,0,1,1,"960 1 64","256 1 1","[prof_range]: iter 5/transpose",
4,1257269,1880,104699,0,1,1,"1 1 32","256 1 1","[prof_range]: iter 5/transpose",
GUI guide
Settings
Kernel Name Mode: Specifies the display format for kernel names.
Base: Displays the kernel's short name (function name only, without parameters).
Mangled: Displays the kernel's mangled name.
Demangled: Displays the kernel's demangled name (default).
Add HGTX name as a prefix: Adds the name of the HGTX closest to the kernel launch as a prefix, separated by
/. This option is not selected by default.
Table context menu
Highlight or zoom to a selected Device Activity in the Timeline View.
Pie chart statistics: Summarizes the kernel execution duration for all kernels, processes, and devices.
2.3.7 HGGC PPU kernel statistics
This report summarizes HGGC PPU kernel time from an asysrep report. Results are listed in descending order of total kernel time.
Required collection option: --trace hggc
Statistical rules
This report aggregates statistics by HGGC PPU kernel name. The HGGC PPU kernel name used for grouping depends on whether the base or mangled option is specified. By default, the demangled kernel name, which includes the function parameter list, is used. The results are sorted in descending order of total HGGC PPU kernel time.
The following list describes the columns in the hggc_ppu_kern_sum table:
Note: The 'Time' column shows the kernel's execution time as a percentage of the total for all kernels in the table. It is calculated from the sum of the 'Total Time' column, not the total application execution time.
Row# : Row number of the kernel summary
Time [%] : Percentage of 'Total Time'
Total Time [ns] : Total time used by all executions of this kernel
Instances : Number of calls to this kernel
Avg [ns] : Average execution time of this kernel
Med [ns] : Median execution time of this kernel
Min [ns] : Minimum execution time of this kernel
Max [ns] : Maximum execution time of this kernel
StdDev [ns] : Standard deviation of the execution time of this kernel
Name : Name of the kernel
Command line usage
asys stats -r hggc_ppu_kern_sum report.asysrepFor detailed help information, run asys stats --help-report hggc_ppu_kern_sum. The following options are supported:
rows=<limit>: Limits the number of rows in the output.
hgtx-name: Prepends the kernel name with the name of the HGTX range closest to the kernel launch, separated by a forward slash (/).
base: Groups and displays statistics by the short name of the kernel (function name only, without parameters).
mangled: Groups and displays statistics by the mangled name of the kernel.
device: Specifies a list of PPU device IDs to analyze. Separate multiple PPU device IDs with a
/. If this option is omitted, all PPU devices are analyzed by default.
Example output:
Row#,Time (%),Total Time (ns),Instances,Avg (ns),Med (ns),Min (ns),Max (ns),StdDev (ns),Name,
1,81.6,826473830,28,29516922,17075623,16812011,357034784,64193935,"_Z39pcclKernel_AllReduce_RING_LL_Sum_int8_t12ncclWorkElem",
2,13.9,141273640,4,35318410,34326818,31248932,41371071,4288359,"_Z9deltaKernIaLi256EEvPvS0_mPd",
3,2.3,23263744,4,5815936,5866699,4743763,6786583,1087875,"_Z14InitDataKernelIaEvPT_mii",
4,2.2,22033972,4,5508493,5461251,4528464,6583005,1031905,"_Z20InitDataReduceKernelIaXadL_Z9ncclOpSumIaET_S1_S1_EEEvPS1_mmii",
GUI usage
Column sums for selected rows
The GUI automatically sums the 'Time' and 'Total Time' columns for selected rows. The sum appears in the second header row. If no rows are selected, the GUI calculates the sum for all rows.
Settings
Kernel Name Mode: Controls how kernel names are displayed. The following modes are available:
Base: Shows the kernel's short name (function name only, without parameters).
Mangled: Shows the kernel's mangled name.
Demangled: Shows the kernel's demangled name (default).
PPU Devices: Filters statistics by PPU device. The default is "All". This field cannot be empty.
Pie chart: Summarizes the total execution time for all kernels.
2.3.8 HGGC PPU trace
This report exports trace data from an asysrep report for PPU executions of the HGGC kernel, Memcpy, and Memset operations.
Rules
This report exports one row of data for each kernel, Memcpy, or Memset execution, and sorts the output by start time in ascending order.
Since the output columns contain information for kernel, Memcpy, and Memset operations, a hyphen (-) marks inapplicable cells.
The following list describes the columns in the hggc_ppu_trace table:
Row# : Row number of the PPU trace
Start [ns] : Timestamp of start time
Duration [ns] : Length of event
CorrId : Correlation ID
GrdX : Grid X values
GrdY : Grid Y values
GrdZ : Grid Z values
BlkX : Block X values
BlkY : Block Y values
BlkZ : Block Z values
Reg/Trd : Registers per thread
StcSMem [bytes] : Size of Static Shared Memory
DymSMem [bytes] : Size of Dynamic Shared Memory
Bytes [bytes] : Size of memory operation
Throughput [B/s] : Memory throughput
SrcMemKd : Memcpy source memory kind or memset memory kind
DstMemKd : Memcpy destination memory kind
Device : PPU device name and ID
Ctx : Context ID
Strm : Stream ID
Name : Trace event name
Command-line usage
Required asys collection option: --trace hggc
asys stats -r hggc_ppu_trace report.asysrepTo view detailed help information, run asys stats --help-report hggc_ppu_trace. The command supports the following options:
hgtx-name: Prepends the kernel name with the name of the HGTX range closest to the kernel launch, separated by a forward slash (/).
base: Exports the short name of the kernel (the function name without parameters).
mangled: Exports the mangled name of the kernel.
By default, the tool exports the HGGC kernel name as its demangled name.
The following example shows the report output. A hyphen (-) marks inapplicable cells:
Row#,Start (ns),Duration (ns),CorrId,GrdX,GrdY,GrdZ,BlkX,BlkY,BlkZ,Reg/Trd,StcSMem (bytes),DymSMem (bytes),Bytes (bytes),Throughput (B/s),SrcMemKd,DstMemKd,Device,Ctx,Strm,Name,
1,193282492,3009,5,"-","-","-","-","-","-","-","-","-",256,85078016,"Device","-","",1,1,"Memset",
2,193329286,1332,6,"-","-","-","-","-","-","-","-","-",256,192192000,"Pageable","Device","",1,1,"Memcpy HtoD (device)",
3,193380562,3415,7,"-","-","-","-","-","-","-","-","-",256,74963200,"Pageable","Device","",1,1,"Memcpy HtoD (device)",
4,231829389,4562345,8,64,1,1,1,1,1,32,0,0,"-","-","-","-","",1,1,"add(int*, int*, int*)",
GUI usage
Settings
Kernel name mode: The display mode for the kernel name. The following modes are available:
Base: Shows the short name of the kernel (the function name without parameters).
Mangled: Shows the mangled name of the kernel.
Demangled: Shows the demangled name of the kernel (default value).
Table context menu
This menu lets you highlight or zoom to the selected kernel or memory operation in the Timeline View.
Pie chart: Summarizes durations by PPU event and device.
2.3.9 HGTX-correlated kernel
This report aggregates statistics for HGTX ranges and their correlated HGGC kernels from an asysrep report. It provides data for eachHGTX range name, kernel name combination.
Required asys collection option: --trace hgtx,hggc
Statistical rules
An HGGC kernel correlates with an HGTX range if it is launched by an HGGC API call on the same thread and occurs within the duration of that HGTX range.
How statistics are calculated:
For each process and thread, the report aggregates the execution time, number of HGTX range instances, and number of kernel instances for kernels that share the same
HGTX range nameandkernel name.
The results are organized as follows: one row is exported foreach thread, HGTX range name, and HGGC kernel name. If thestandalone option is enabled, HGTX-related information for uncorrelated HGGC kernels is marked with a hyphen (-). The results are sorted as follows:
Sorted in ascending order by HGTX range name, process ID, and thread ID.
Kernels with the same thread and HGTX range name are sorted in descending order by the Total Time column.
Thehgtx_kern_sum table includes the following columns:
Row# : Row number of the HGTX range kernel summary
HGTX Range : Name of the range
Style : Range style; Start/End or Push/Pop
PID : Process ID for this set of ranges and kernels
TID : Thread ID for this set of ranges and kernels
HGTX Inst : Number of HGTX range instances
Kern Inst : Number of HGGC kernel instances
Total Time [ns] : Total execution time for all kernel instances in this range
Avg [ns] : Average execution time of this kernel
Med [ns] : Median execution time of this kernel
Min [ns] : Minimum execution time of this kernel
Max [ns] : Maximum execution time of this kernel
StdDev [ns] : Standard deviation of this kernel's execution time
Kernel Name : Name of the kernel
Command-line usage
asys stats -r hgtx_kern_sum report.asysrepTo view detailed help, runasys stats --help-report hgtx_kern_sum. The following options are available:
base: Exports the kernel's short name (function name only, without parameters).
mangled: Exports the kernel's mangled name.
standalone: Includes uncorrelated HGGC kernels in the output.
device: Specifies a list of PPU device IDs to analyze. Separate multiple IDs with a
/. If this option is not specified, all PPU devices are analyzed by default.no-graph-mapping: Excludes HGTX range information mapped through HGGC graph nodes from the output.
range-include=<regex_list>: Specifies an allowlist of regular expressions to filter HGTX ranges for analysis. Separate multiple expressions with a
/. If this option is omitted, the analysis includes all HGTX ranges.range-exclude=<regex_list>: Specifies a denylist of regular expressions to filter HGTX ranges for analysis. Separate multiple expressions with a
/. If this option is omitted, the analysis includes all HGTX ranges.
Example report output:
Row#,HGTX Range,Style,PID,TID,HGTX Inst,Kern Inst,Total Time (ns),Avg (ns),Med (ns),Min (ns),Max (ns),StdDev (ns),Kernel Name,
1,"DoProcess","PushPop",3588556,3588556,2,2,8036961,4018480,4018480,3474616,4562345,543864,"add(int*, int*, int*)",
2,"Loop1","PushPop",3588556,3588556,1,1,4562345,4562345,4562345,4562345,4562345,0,"add(int*, int*, int*)",
3,"Loop2","PushPop",3588556,3588556,1,1,3474616,3474616,3474616,3474616,3474616,0,"add(int*, int*, int*)",
4,"profile","PushPop",3588556,3588556,1,2,8036961,4018480,4018480,3474616,4562345,543864,"add(int*, int*, int*)",
GUI guide
Rule settings (Settings)
Kernel name mode: Controls the display format of kernel names. The following modes are available:
Base: Shows the kernel's short name (function name only, without parameters).
Mangled: Shows the kernel's mangled name.
Demangled: Shows the kernel's demangled name (default).
Include standalone kernel: When enabled, includes information for uncorrelated kernels. The HGTX-related information for these kernels is marked with a hyphen. This option is disabled by default.
HGTX graph node mapping: Maps HGTX ranges from the HGGC graph capture phase to PPU-side activities. This mapping uses HGGC graph nodes created within the HGTX range. Enabled by default.
PPU devices: Filters statistics by PPU device. The default is "All", which includes data from all devices in the analysis. This field is required.
Pie chart statistics: Summarizes kernel execution time across all HGTX ranges, processes, and kernel names.
2.3.10 HGTX-correlated kernel trace
Establish an association between HGTX and the HGGC kernel, and export the association at the per HGTX range, per HGGC kernel level.
Statistical rules
An HGGC kernel correlates with an HGTX range if an HGGC API call on the same thread launches the kernel within that HGTX range.
The exported results are organized as follows: for each HGTX range and each HGGC kernel, one row of data is exported. If the standalone option is enabled, the HGTX range information for HGGC kernels that are not associated with an HGTX range is marked with the invalid symbol -.
Export Order:
The report first sorts HGGC kernels by their PPU execution start time in ascending order.
Then, for each HGGC kernel, it sorts the correlated HGTX range rows by the HGTX range start time in ascending order.
The columns of the hgtx_kern_trace table are described as follows:
The
API StartandAPI durationcolumns output invalid values for scenarios where HGTX is associated with a kernel via an HGGC graph node.
Row# : Row number of the HGTX range kernel trace
Range name : Name of the HGTX range
Style : Range style; Start/End or Push/Pop
PID : Process identifier
TID : Thread identifier
Device ID : PPU device identifier
Context ID : Context identifier
Stream ID : Stream identifier
HGTX range ID : HGTX range identifier
Kernel exec ID : Kernel execution identifier
Kernel start [ns] : Start timestamp of the HGGC kernel
Kernel duration [ns] : Duration of the HGGC kernel
API start [ns] : Start timestamp of the API call
API duration [ns] : Duration of the API call
GridXYZ : grid dimensions for the kernel launch call
BlockXYZ : block dimensions for the kernel launch call
Correlation ID : Correlation identifier
Graph ID : HGGC graph identifier
Graph node ID : HGGC graph node identifier
Kernel name : Name of the kernel
Mangled name : Mangled name of the kernel
Command-line usage
Required asys collection options: --trace hgtx,hggc
asys stats -r hgtx_kern_trace report.asysrepRunasys stats --help-report hgtx_kern_trace for detailed help. This report supports the following options:
base: Exports the kernel's base name (the function name without parameters).
mangled: Exports the kernel's mangled name.
standalone: Includes HGGC kernels that are not correlated with any HGTX range.
no-graph-mapping: Excludes HGTX range information that is mapped through HGGC graph nodes.
range-include=<regex_list>: Specifies a whitelist of regular expressions to filter HGTX ranges for analysis. Separate multiple regular expressions with
/. By default, all HGTX ranges are analyzed.range-exclude=<regex_list>: Specifies a blacklist of regular expressions to filter HGTX ranges for analysis. Separate multiple regular expressions with
/. By default, all HGTX ranges are analyzed.
The following example shows the report output:
Row#,Range Name,Style,PID,TID,Device ID,Context ID,Stream ID,HGTX Range ID,Kernel Exec ID,Kernel Start (ns),Kernel Duration (ns),API Start (ns),API Duration (ns),GridXYZ,BlockXYZ,Correlation ID,Graph ID,Graph Node ID,Kernel Name,Mangled Name,
1,"profile","PushPop",4010376,4010376,0,1,1,6,23,85579190,11136752,80913269,4025776,"64 1 1","1 1 1",8,"-","-","add(int*, int*, int*)","_Z3addPiS_S_",
2,"Loop1","PushPop",4010376,4010376,0,1,1,7,23,85579190,11136752,80913269,4025776,"64 1 1","1 1 1",8,"-","-","add(int*, int*, int*)","_Z3addPiS_S_",
3,"DoProcess","PushPop",4010376,4010376,0,1,1,8,23,85579190,11136752,80913269,4025776,"64 1 1","1 1 1",8,"-","-","add(int*, int*, int*)","_Z3addPiS_S_",
...
GUI
Settings
Kernel name mode: Sets the display mode for kernel names. The available modes are:
Base: Shows the kernel's base name (the function name without parameters).
Mangled: Shows the kernel's mangled name.
Demangled: Shows the kernel's demangled name (default).
HGTX graph node mapping: Maps HGTX ranges from the HGGC graph capture phase to PPU-side activities. This mapping uses HGGC graph nodes created within the HGTX range. The default is "Yes".
Include standalone kernel: Includes information for kernels that do not match any HGTX range. If enabled, the HGTX-related information for these kernels contains an invalid value. This option is disabled by default.
Table context menu
Highlight or zoom to the selected HGTX range in the Timeline View.
Highlight or zoom to the selected Device Activity in the Timeline View.
Pie chart statistics: Summarizes the kernel execution duration for all HGTX ranges, kernel names, processes, and devices.
2.3.11 HGTX to PPU projection
Projects the CPU side HGTX ranges from an asysrep report to the PPU side and outputs statistics on the actual active time of these ranges on the PPU.
Required asys collection option: --trace hgtx,hggc
How it works
An HGGC kernel correlates with an HGTX range if the kernel is launched by an HGGC API call on the same thread and occurs within the duration of that HGTX range.
A CPU side HGTX range is projected to the PPU side by defining its active time on the PPU. This active time spans from the start of the earliest correlated PPU operation to the end of the latest one. PPU operations include the execution of HGGC kernels, memcpy, and memset.
How statistics are aggregated:
Information from HGTX ranges with the same
range nameandstyleis aggregated to summarize metrics such as CPU side duration and PPU side projected duration.The total active time on the PPU side for a given HGTX range name,
Proj Active Time, is the union of the projected time intervals. If the projections of multiple HGTX range instances overlap in time, the overlapping duration is counted only once.The PPU side utilization for a given HGTX range name,
In-Use, is calculated asProj Active Timedivided byPPU-side analysis time range. ThePPU-side analysis time rangeis determined by therange-modeoption.
The tool sorts the results in descending order by In-Use and then in ascending order by HGTX range name.
The following list describes the columns in the hgtx_ppu_proj_sum table:
Row# : Row number of the HGTX PPU projection summary
Range : Name of the HGTX range
Style : Range style; Start/End or Push/Pop
In-Use [%] : Percentage of projected active time to time range
Proj Active Time [ns] : Total projected time excluding overlapping for this range name
Total Proj Time [ns] : Total projected time used by all instances of this range name
Total Range Time [ns] : Total original HGTX range time used by all instances of this range name
Range Instances : Number of instances of this range
Proj Avg [ns] : Average projected time for this range
Proj Med [ns] : Median projected time for this range
Proj Min [ns] : Minimum projected time for this range
Proj Max [ns] : Maximum projected time for this range
Proj StdDev [ns] : Standard deviation of projected times for this range
Total PPU Ops : Total number of PPU operations
Avg PPU Ops : Average number of PPU operations
Avg Range Lvl : Average range stack depth
Avg Num Child : Average number of child ranges
Command-line usage
asys stats -r hgtx_ppu_proj_sum report.asysrepTo view detailed help information, run asys stats --help-report hgtx_ppu_proj_sum. The following options are supported:
device=<device_list>: Specifies a list of PPU device IDs for analysis. Separate multiple IDs with a/. If you do not specify this option, the tool analyzes all PPU devices by default.range-mode=<mode>: Sets the mode for the PPU side analysis time range. Supported modes areactiveandfull.active: The default mode. The time range is from the first PPU operation to the last PPU operation.
full: The time range is the user-specified analysis time range. If you do not specify a time range, the tool uses the time range of the entire report.
range-include=<regex_list>: Specifies an allowlist of regular expressions to filter HGTX ranges for analysis. Separate multiple regular expressions with a/. If you do not specify this option, the tool analyzes all HGTX ranges by default.range-exclude=<regex_list>: Specifies a blocklist of regular expressions to filter HGTX ranges for analysis. Separate multiple regular expressions with a/. If you do not specify this option, the tool analyzes all HGTX ranges by default.no-graph-mapping: Excludes HGTX range information mapped through HGGC graph nodes.
GUI guide
Settings
PPU Devices: Filters results by the selected PPU devices. The default value is "All", which includes all PPU devices. This field is required.
Time Range Mode: Sets the mode for the analysis time range:
PPU Active Time Range: The default mode. The time range is from the first PPU operation to the last PPU operation.Filtered Time Range: The time range is the user-specified analysis time range. If you do not specify a time range, the tool uses the time range of the entire report.
HGTX graph node mapping: Determines whether to project HGTX ranges from the HGGC graph capture phase to the PPU side. The association is established through HGGC graph nodes created within the HGTX range. The default value is "Yes".
Range Name Filter: Filters the HGTX range names in the results using a Perl-compatible regular expression. By default, the tool displays all HGTX ranges. The tool checks the syntax of the regular expression. If the syntax is incorrect, an error message appears and you cannot save the settings.
Pie Chart Statistics: Summarizes the projected active time on the PPU side for all CPU side HGTX ranges. This allows you to visualize the time consumption percentage of each HGTX range's projection on the PPU.
2.3.12 HGTX to PPU projection trace
This trace projects CPU-side HGTX ranges from an asysrep report onto the PPU. This shows the actual active time of each HGTX range on the PPU and exports HGTX stack information.
Required asys collection option: --trace hgtx,hggc
How it works
An HGGC kernel is associated with an HGTX range if it is launched by an HGGC API call on the same thread and occurs within the duration of that range.
A CPU-side HGTX range is projected onto the PPU. Its projected active time on the PPU spans from the start of the earliest associated PPU operation to the end of the latest. PPU operations include HGGC kernel, memcpy, and memset.
The PPU active time for an HGTX range is the total time during which one or more of its associated PPU-side activities are running. If multiple activities overlap, the overlapping duration is counted only once.
The output contains one row for each HGTX range and is sorted in ascending order by projected start time.
The following list describes the columns in the hgtx_ppu_proj_trace table:
Row# : Row number of the HGTX PPU projection trace
Name : Name of the HGTX range
Projected start [ns] : Projected range start timestamp
Projected duration [ns] : Projected range duration
PPU active time [ns] : Total PPU active time excluding overlapping for this range
Orig start [ns] : Original HGTX range start timestamp
Orig duration [ns] : Original HGTX range duration
Style : Range style; Start/End or Push/Pop
PID : process identifier
TID : thread identifier
NumPPUOps : Number of enclosed PPU operations
Lvl : stack level, starts at 0
NumChild : Number of children ranges
RangeId : Arbitrary ID for range
ParentId : Range ID of the enclosing range
RangeStack : Range IDs that make up the push/pop stack
Command-line usage
asys stats -r hgtx_ppu_proj_trace report.asysrepTo view detailed help information, run asys stats --help-report hgtx_ppu_proj_trace. The following options are supported:
device=<device_list>: Specifies a list of PPU device IDs to analyze. Separate multiple IDs with a/. If this option is not specified, all PPU devices are analyzed by default.range-include=<regex_list>: Specifies an allowlist of regular expressions to select which HGTX ranges to analyze. Separate multiple expressions with a/. If not specified, all HGTX ranges are analyzed by default.range-exclude=<regex_list>: Specifies a denylist of regular expressions to exclude HGTX ranges from the analysis. Separate multiple expressions with a/. If not specified, no HGTX ranges are excluded from the analysis.no-graph-mapping: Excludes HGTX range information that is mapped through HGGC graph nodes from the output.
Example output:
Row#,Name,Projected Start (ns),Projected Duration (ns),PPU Active Time (ns),Orig Start (ns),Orig Duration (ns),Style,PID,TID,NumPPUOps,Lvl,NumChild,RangeId,ParentId,RangeStack,
1,"profile",777876074,53206947,21448563,776113485,56055065,"PushPop",295684,295684,50,0,10,6,"-",":6",
2,"Loop1",777876074,14961664,10470590,776142784,28572367,"PushPop",295684,295684,5,1,1,7,6,":6:7",
3,"DoProcess",777876074,14961664,10470590,776146124,27485685,"PushPop",295684,295684,5,2,0,8,7,":6:7:8",
...
GUI guide
Settings
PPU Devices: Filters the results by the selected PPU devices. The default is "All", which includes all PPU devices. This field is required.
HGTX graph node mapping: Determines whether to project HGTX ranges from the HGGC graph capture phase to the PPU. The mapping is established through HGGC graph nodes created within the HGTX range. The default value is "Yes".
Range name filter: Filters the HGTX range names in the results using a Perl-compatible regular expression. By default, all HGTX ranges are displayed. The tool validates the regular expression syntax. If the syntax is incorrect, an error message appears and you cannot save the settings.
Table context menu
Highlight or zoom to the selected HGTX range in the Timeline View.
Highlight or zoom to the selected Device Activity in the Timeline View.
Pie chart statistics: Summarizes the projected active time on the PPU for all CPU-side HGTX ranges, categorized by range name or process. This allows you to visualize the runtime percentage of each HGTX range or process after being projected to the PPU.
2.3.13 HGTX range
This report summarizes the time spent in HGTX ranges from an asysrep report and sorts the results in descending order of total time.
Required asys collection option: --trace hgtx
Analysis rules
Statistics are aggregated at the per HGTX range domain and name level by summing the duration of HGTX ranges that have the same domain and name. If an HGTX range contains a domain, the HGTX range name is formatted as domain:range. The output is sorted in descending order of the total duration of the range.
If you use the process or thread options to define the scope, the analysis includes any thread that matches the thread filter or belongs to a process that matches the process filter.
The following list describes the columns in the hgtx_sum table:
Note: The "Time" column shows each range's 'Total Time' as a percentage of the total time for all ranges in the table. It does not represent a percentage of the total application execution time.
Row# : Row number of the HGTX range summary
Time (%) : Percentage of 'Total Time'
Total Time [ns] : total time used by all instances of this range
Instances : number of instances of this range
Avg [ns] : average execution time of this range
Med [ns] : median execution time of this range
Min [ns] : Smallest execution time of this range
Max [ns] : Largest execution time of this range
StdDev [ns] : standard deviation of the time of this range
Style : Range style; Start/End or Push/Pop
Range : Name of the range
Command-line usage
asys stats -r hgtx_sum report.asysrepTo view detailed help information, run asys stats --help-report hgtx_sum. The following options are supported:
rows=<limit>: Limits the number of HGTX range results.process=<pid_list>: Specifies the process IDs (PIDs) for analysis. Separate multiple PIDs with a/. Default: all processes.thread=<tid_list>: Specifies the thread IDs (TIDs) for analysis. Separate multiple TIDs with a/. Default: all threads.
Example output:
Row#,Time (%),Total Time (ns),Instances,Avg (ns),Med (ns),Min (ns),Max (ns),StdDev (ns),Style,Range,
1,25.7,181837947,1,181837947,181837947,181837947,181837947,0,"PushPop","[prof_range]: iter 6",
2,25.1,177622641,1,177622641,177622641,177622641,177622641,0,"PushPop","[prof_range]: iter 9",
3,25.1,177254919,1,177254919,177254919,177254919,177254919,0,"PushPop","[prof_range]: iter 7",
4,24.1,170843422,1,170843422,170843422,170843422,170843422,0,"PushPop","[prof_range]: iter 8",
...
GUI usage
Settings
Processes: Selects the processes to analyze. Default: "All".
Maximum number of results: Sets the maximum number of rows to display. Default: -1 (no limit).
Pie chart: Displays the percentage of total time used by each HGTX range.
2.3.14 OSRT API
This section summarizes the time spent in OS runtime APIs from an asysrep report, listing the results in descending order by Total Time.
Required asys collection option: --trace osrt
How it works
Statistics are aggregated byOS runtime API name, summing the execution time for all calls to a given function. The results are then sorted by Total Time in descending order.
The following list describes the columns in the osrt_sum table:
Note: The
Timecolumn shows a function's percentage of the total execution time. This percentage is calculated relative to the sum of allTotal Timevalues in this table, not the total execution time of the entire application.
Row# : Row number of the OS runtime summary
Time [%] : Percentage of 'Total Time'
Total Time [ns] : Total time used by all executions of this function
Num Calls : Number of calls to this function
Avg [ns] : Average execution time of this function
Med [ns] : Median execution time of this function
Min [ns] : Smallest execution time of this function
Max [ns] : Largest execution time of this function
StdDev [ns] : Standard deviation of the execution time of this function
Name : Name of the function
Command-line usage
asys stats -r osrt_sum report.asysrepTo view detailed help information, run asys stats --help-report osrt_sum.
Example output:
Row#,Time (%),Total Time (ns),Num Calls,Avg (ns),Med (ns),Min (ns),Max (ns),StdDev (ns),Name,
1,85.6,8901500720,255,34907845,4994783,1095,348667026,63811239,"pthread_cond_wait",
2,6.9,721563692,1105,652998,1055069,52083,1072141,485233,"nanosleep",
3,6.7,700892565,7,100127509,100123388,100121020,100143853,8411,"poll",
...
GUI usage
Settings
This report has no configurable settings.
Pie chart: Shows the proportion of Total Time consumed by each OS runtime API.
2.3.15 PCCL transfer stages
This rule analyzes an asysrep report to summarize the duration of each PCCL transfer stage. The results are sorted in descending order of total stage time.
Required asys collection option: --trace pccl
How it works
The system calculates metrics for each transmission stage, such as duration (average, maximum, and minimum) and the number of instances, based on the grouping of per thread, per channel, per direction, and per transmission stage. The results are then output in descending order of the total time of the transmission stage.
The pccl_stage_sum table includes the following columns:
Row# : Row number of the stage summary
PID : Process identifier
Device ID : PPU device identifier
TID : Thread identifier
Channel ID : PCCL channel identifier
Channel Type : PCCL channel type
Name : Stage name
Total Time [ns] : Stage total time
Instances : Number of instances
Avg [ns] : Average of stage duration
Med [ns] : Median of stage duration
Min [ns] : Minimum of stage duration
Max [ns] : Maximum of stage duration
Stdev [ns] : Standard deviation of stage duration
CLI usage
asys stats --report pccl_stage_sum report.asysrepFor detailed help, run asys stats --help-report pccl_stage_sum.
Example output:
Row#,PID,Device ID,TID,Channel ID,Channel Type,Name,Total Time,Instances,Avg,Med,Min,Max,Stdev,
1,631660,0,631712,1,RX,RecvWait,305528068,24,12730336,13761981,9669723,18509164,2407844,
2,631660,1,631711,1,TX,GPUWait,299988851,24,12499535,12786840,9625474,16580086,2217489,
3,631660,0,631712,1,TX,GPUWait,297674072,24,12403086,12579239,9570100,17151019,2208876,
...
GUI usage
Settings
This rule has no configurable settings.
Pie chart statistics: Visualizes the percentage of total time that each PCCL stage consumes, grouped by stage, process, and device.
2.3.16 HGGC PPU memory size
Summarizes the data size of HGGC PPU memory operations (memcpy / memset) from an asysrep report and sorts the output in descending order by the total data size for each operation type.
Required asys trace option: --trace hggc
How it works
The analysis aggregates the data size for each memory operation type and sorts the results in descending order of the total data size.
memcpyoperations are categorized by copy type, such as[HGGC memcpy Host-to-Device]/[HGGC memcpy Device-to-Host].
The following list describes the columns in the hggc_ppu_mem_size_sum table:
Row# : Row number of the memory summary
Total [bytes] : Total memory utilized by this operation
Count : Number of executions of this operation
Avg [bytes] : Average memory size of this operation
Med [bytes] : Median memory size of this operation
Min [bytes] : Smallest memory size of this operation
Max [bytes] : Largest memory size of this operation
StdDev [bytes] : Standard deviation of the memory size of this operation
Operation : Name of the memory operation
command-line usage
asys stats --report hggc_ppu_mem_size_sum report.asysrepFor detailed help, run asys stats --help-report hggc_ppu_mem_size_sum.
Example report output:
Row#,Total (bytes),Count,Avg (bytes),Med (bytes),Min (bytes),Max (bytes),StdDev (bytes),Operation,
1,9896352144,564,17546723,1024,12,556254464,74087070,"[HGGC memset]",
2,536876208,342,1569813,16,4,67108864,10157989,"[HGGC memcpy Host-to-Device]",
3,156,44,3,1,1,16,4,"[HGGC memcpy Device-to-Host]",
4,64,12,5,4,4,8,1,"[HGGC memcpy Device-to-Device]",
GUI guide
Settings
This rule has no configurable settings.
Pie chart: Summarizes the data size for all memory operations, providing a visual comparison across different operations.
HGGC PPU memory time summary
This rule summarizes the time taken by HGGC PPU memory operations (memcpy and memset) from an asysrep report. The results are sorted in descending order by total time.
Required asys collection option: --trace hggc
How it works
Calculates the total duration of operations for each each memory operation type and outputs the results in descending order.
memcpyoperations are categorized by copy type, such as[HGGC memcpy Host-to-Device]or[HGGC memcpy Device-to-Host].
The hggc_ppu_mem_time_sum table includes the following columns:
Note: The
Time (%)column shows an operation'sTotal Time (ns)as a percentage of the sum of allTotal Time (ns)values in the table. This value is not relative to the total application execution time.
Row# : Row number of the memory summary
Time [%] : Percentage of 'Total Time'
Total Time [ns] : Total time used by all executions of this operation
Count : Number of executions of this operation
Avg [ns] : Average execution time of this operation
Med [ns] : Median execution time of this operation
Min [ns] : Minimum execution time of this operation
Max [ns] : Maximum execution time of this operation
StdDev [ns] : Standard deviation of the time of this operation
Operation : Name of the memory operation
Command-line usage
asys stats --report hggc_ppu_mem_time_sum report.asysrepTo view detailed help information, run asys stats --help-report hggc_ppu_mem_time_sum.
The following is an example of the report output:
Row#,Time (%),Total Time (ns),Count,Avg (ns),Med (ns),Min (ns),Max (ns),StdDev (ns),Operation,
1,69.3,19697314,342,57594,1240,1080,2413129,364424,"[HGGC memcpy Host-to-Device]",
2,30.6,8687991,564,15404,720,120,496801,67433,"[HGGC memset]",
3,0.1,20920,44,475,400,320,960,165,"[HGGC memcpy Device-to-Host]",
4,0.1,15600,12,1300,1240,920,1800,293,"[HGGC memcpy Device-to-Device]",
GUI guide
Settings
This rule has no configurable settings.
Pie chart: Summarizes the time taken by each memory operation and shows its percentage of the total time.
2.3.18 PCCL desynchronization trace
This rule groups PCCL kernels from an asysrep report by communication. It calculates the desynchronization rate for the kernels within each group and exports information about the kernel that starts execution last.
Required asys collection option:
--trace hggc
How it works
The rule groups PCCL kernels with overlapping execution times into a communication group. For each group, the following metrics are calculated:
overlap time: The time during which all PCCL kernels in the communication group execute simultaneously.duration: The elapsed time from the start of the first kernel to the end of the last kernel in the communication group.
The desynchronization rate is calculated as (duration - overlap time) / duration. The tool exports one row of trace data for each communication group, sorted in descending order by the desynchronization rate.
The following list describes the columns in the pccl_desync_trace table:
Row# : Row number of the PCCL communication trace
Start [ns] : Start time of the PCCL communication
Duration [ns] : Elapsed duration of the PCCL communication
Overlap [ns] : Overlapping duration of all PCCL kernels
Desync rate [%] : Desynchronization rate of the PCCL communication
Last process : The process ID of the last kernel in this PCCL communication
Last device : The device ID of the last kernel in this PCCL communication
Last kernel : The ID of the last kernel in this PCCL communication
Max duration [ns] : The longest kernel duration in this PCCL communication
Min duration [ns] : The shortest kernel duration in this PCCL communication
Avg duration [ns] : The average kernel duration in this PCCL communication
Instances : The number of kernels in this PCCL communication
Kernel name : The name of the PCCL kernel
Command-line usage
asys stats -r pccl_desync_trace report.asysrepTo view detailed help information, run asys stats --help-report pccl_desync_trace. The following options are supported:
hgtx-name: Prepends the name of the HGTX range closest to the kernel launch to the kernel name, separated by a
/.base: Groups and displays statistics by the base name of the kernel, which is the function name without parameters.
mangled: Groups and displays statistics by the mangled name of the kernel.
device: Specifies a list of PPU device IDs to analyze. Separate multiple PPU device IDs with a
/. If this option is not specified, the tool analyzes all PPU devices by default.
The following is an example of the report output:
Row#,Start (ns),Duration (ns),Overlap (ns),Desync Rate (%),Last Process,Last Device,Last Kernel,Max Duration (ns),Min Duration (ns),Avg Duration (ns),Instances,Kernel Name,
1,113393971366,699213,15256,97.8,1142413,0,38654,697883,15400,538712,8,"pcclKernel_AllReduce_RING_LL_Sum_uint8_t(ncclWorkElem)",
2,113395036610,267497,12450,95.3,1142419,6,38798,266721,14040,191886,8,"pcclKernel_AllReduce_RING_LL_Sum_uint8_t(ncclWorkElem)",
...
GUI
Settings
Kernel Name Mode: Controls how kernel names are displayed. The available modes are:
Base: Uses the base name of the kernel, which is the function name without parameters.
Mangled: Uses the mangled name of the kernel.
Demangled: Uses the demangled name of the kernel (default).
PPU Devices: A filter for PPU devices. The default value is "All", which analyzes data from all PPU devices. This field cannot be empty.
Add HGTX name as a prefix: Prepends the name of the HGTX range closest to the kernel launch to the kernel name, separated by a
/. This is unchecked by default.
Table context menu
Provides options to highlight or zoom to the last kernel of the selected communication group in the Timeline View.
Pie chart statistics: Aggregates data on the process and device that are the last to start execution when PCCL desynchronization occurs. This helps you visually identify which process or device most frequently causes desynchronization by being the last to start its PCCL kernel.
2.3.19 PCCL desynchronization summary
This report groups PCCL kernels from an asysrep report into communication groups. It calculates the desynchronization rate for the kernels within each group and outputs statistics for communication groups that share the same PCCL kernel name.
Required asys collection option: --trace hggc
How it works
PCCL kernels with overlapping execution times are grouped into a communication group. For each communication group, the following metrics are calculated:
overlap duration: The time during which all PCCL kernels in the communication group are executing simultaneously.duration: The elapsed time from the start of the first kernel to the end of the last kernel in the communication group.
The desynchronization rate is calculated as: (duration - overlap duration) / duration.
To calculate the Desync P90 value, the system sorts communication groups with the same kernel name by their desynchronization rate in ascending order and takes the 90th percentile value. This value indicates that 90% of the PCCL communications have a desynchronization rate at or below this P90 value.
The analysis aggregates the duration and desynchronization rate for communication groups, grouped by kernel name. The results are sorted in descending order by the total duration of the communication groups.
The following list describes the columns in the pccl_desync_summary table:
Note: The "Time" column shows a communication group's duration as a percentage of the total duration for all listed communication groups, not its percentage of the total application execution time.
Row# : Row number of PCCL communication summary
Time [%] : Percentage of 'Total Duration'
Count : Number of communications for this PCCL kernel
Desync Avg [%] : Average desynchronization rate of this PCCL kernel
Desync Med [%] : Median desynchronization rate of this PCCL kernel
Desync Min [%] : Minimum desynchronization rate of this PCCL kernel
Desync Max [%] : Maximum desynchronization rate of this PCCL kernel
Desync StdDev [%] : Standard deviation of desynchronization rate of this PCCL kernel
Total Duration [ns] : Total elapsed duration of all communications for this PCCL kernel
Total Overlap [ns] : Total overlap duration of all communications for this PCCL kernel
Kernel Name : Name of the PCCL kernel
CLI usage
asys stats -r pccl_desync_summary report.asysrepTo view detailed help information, run asys stats --help-report pccl_desync_summary. The following options are supported:
hgtx-name: Prepends the kernel name with the name of the HGTX range closest to the kernel launch, separated by a
/.base: Groups and displays statistics by the kernel's short name (the function name without parameters).
mangled: Groups and displays statistics by the kernel's mangled name.
device: Specifies a list of PPU device IDs to analyze. Separate multiple PPU device IDs with a
/. If you omit this option, all PPU devices are analyzed by default.
The following is an example of the report output:
Row#,Time (%),Count,Desync Avg (%),Desync Med (%),Desync Min (%),Desync Max (%),Desync StdDev (%),Total Duration (ns),Total Overlap (ns),Kernel Name,
1,95.4,4,98.3,98.9,95.3,100.0,1.9,931583768,60421,"pcclKernel_AllReduce_RING_LL_Sum_uint8_t(ncclWorkElem)",
2,4.6,1,100.0,100.0,100.0,100.0,0.0,44549251,17168,"pcclKernel_AllReduce_RING_LL_Sum_double(ncclWorkElem)",
GUI usage
Settings
Kernel Name Mode: Sets how kernel names are displayed. Available modes:
Base: Displays the kernel's short name (the function name without parameters).
Mangled: Displays the kernel's mangled name.
Demangled: Displays the kernel's demangled name (default).
PPU Devices: Filters the report to show data only for selected PPU devices. The default, "All", includes all PPU devices. This field is required.
Add HGTX name as a prefix: When selected, prepends each kernel name with the name of the closest HGTX range, separated by a
/. This option is off by default.
Pie chart statistics: Summarizes the total duration for all PCCL kernel communication groups.
2.3.20 Device attributes
This rule exports attribute information for PPU devices from an asysrep report. The output contains the basic parameters for each PPU device, sorted in ascending order by device index.
Required asys collection option: --trace hggc
How it works
This rule lists the attributes for each PPU device. Each device corresponds to a single row in the output table.
The following list describes the columns in the ppu_device_attribute table.
Note:
CU ClockandMemory Clockare the maximum supported frequencies for the device, not the real-time frequencies of the PPU device.
Row# : Row number of the device attribute entry
Device ID : PPU device identifier
Device Name : PPU device name
PCI Bus ID : PCI bus identifier
hostname : The hostname of the machine where the device is located
UUID : Universally unique identifier of the PPU device
Compute capability major : Major version of the compute capability
Compute capability minor : Minor version of the compute capability
CE number : Number of compute engines (CEs)
CU number : Number of compute units (CUs)
Total memory (bytes) : Total device memory in bytes
CU clock (Hz) : Compute unit clock frequency in Hz
Memory clock (Hz) : Memory clock frequency in Hz
Command-Line Usage
asys stats -r ppu_device_attribute report.asysrepExample output:
Row#,Device ID,Device Name,PCI Bus ID,hostname,UUID,Compute capability major,Compute capability minor,CE number,CU number,Total memory (bytes),CU clock (Hz),Memory clock (Hz),
1,0,"PPU-ZW810E","00000001:C9:00.0","na131t-swu141.eng.t-head.cn","-",8,0,16,64,103079215104,1700000000,1800000000,
2,1,"PPU-ZW810E","00000001:C8:00.0","na131t-swu141.eng.t-head.cn","-",8,0,16,64,103079215104,1700000000,1800000000,
...
PPU operator summary
This report groups PPU operators from an asysrep report by their type and parameter values. It summarizes the PPU execution time for each group and estimates the PPU hardware utilization for each operator group.
Required asys collection options:
--trace hggc,hgtx
Tips: Before you collect an asysrep report, we recommend enabling HGTX range annotation for PPU operators:
Run
export PPU_LIB_PERF_INSTRUMENT=1to set an environment variable that enables HGTX range annotation for PPU operators in the base framework.Add the
--pytorch autograd-shapes-hgtxoption to theasyscommand to enable HGTX range annotation for PyTorch operators.
How it works
The execution time of a PPU operator is calculated as follows:
The PPU-side execution time of a PPU operator is the duration from the start of its first correlated PPU activity to the end of its last correlated PPU activity.
ThePPU Active Time for a PPU operator is calculated as follows:
The
PPU Active Timeis the total time during which one or more of a PPU operator's correlated PPU activities are running. If multiple PPU activities overlap, the overlapping duration is counted only once.
When summarizing PPU operator execution information, the tool merges operators with nearly identical parameters. By default, it ignores minor parameter differences that have a small impact on performance.
If you specify theothers operator type, kernels that are not correlated with any PPU operator are also included in the analysis, grouped by kernel name.
The results are organized by PPU operator parameter combinations, and by default, minor parameter differences with little impact on performance are ignored. The tool summarizes the execution time information for each operator and sorts the results in descending order by the Total Time column.
The formula for the estimated PPU compute utilization is:
Floating-point operations of the operator/ (Peak PPU FLOPS*Average execution time of the operator)
The formula for estimating HBM load and store utilization is:
Data size of the operator/ (Peak HBM bandwidth*Average execution time of the operator)
The following list describes the columns in theppu_op_sum table:
Note: The
Percentcolumn is calculated based on the sum of theTotal Timecolumn. It represents the operator'sTotal Timeas a percentage of the total for all operators in the table, not its percentage of the total application execution time.
Row# : Row number of the PPU operator summary
OP type : PPU operator type
Total Time [ns] : Total execution time for all kernel instances of this operator
Percent [%] : The operator's 'Total Time' as a percentage of the total for all operators in the table.
Instances : Number of operator instances.
Avg [ns] : Average execution time of this operator
Med [ns] : Median execution time of this operator
Min [ns] : Minimum execution time of this operator
Max [ns] : Maximum execution time of this operator
PPU Active Time [ns] : Total PPU active time for this operator, with overlapping time counted only once.
Active Percent [%] : 'PPU Active Time' as a percentage of the operator's 'Total Time'.
StdDev [ns] : Standard deviation of the time of this operator
Compute Util [%] : Estimated PPU compute utilization.
HBM Load Util [%] : Estimated PPU HBM load utilization.
HBM Store Util [%] : Estimated PPU HBM store utilization.
OP Name : Operator signature, including its name and key parameters.
Command-line usage
asys stats -r ppu_op_sum report.asysrepTo view detailed help information, runasys stats --help-report ppu_op_sum. The following options are supported:
rows=<limit>: Limits the number of rows in the output.device=<device_list>: Specifies a list of PPU device IDs to analyze. Separate multiple PPU device IDs with a/. If not specified, all PPU devices are analyzed.range-include=<regex_list>: Specifies an allowlist of regular expressions to filter HGTX ranges for analysis. Separate multiple regular expressions with a/. If not specified, all HGTX ranges are analyzed.range-exclude=<regex_list>: Specifies a blocklist of regular expressions to filter HGTX ranges for analysis. Separate multiple regular expressions with a/. If not specified, no ranges are excluded.op=<operator_filter>: Specifies a list of PPU operator types to analyze. Separate multiple PPU operator types with a/. If this option is not specified, all supported PPU operator types are analyzed by default. If you specify theotherstype, kernels not correlated with any PPU operator are also included in the results.order-by=<order_type>: Specifies the sort order for the output. By default, results are sorted by theTotal Timecolumn.no-graph-mapping: If specified, HGTX ranges from the HGGC graph creation phase are not mapped to the HGGC graph execution phase.no-merge-flash-attention-prefill-decode-operator: If specified, does not match and merge prefill and decode flash attention operators.no-merge-flash-attention-parameter: If specified, does not ignore minor parameter differences for flash attention operators.no-merge-communication-parameter: If specified, does not ignore minor parameter differences for communication operators.no-merge-moe-parameter: If specified, does not ignore minor parameter differences for MoE operators.no-merge-pytorch-parameter: If specified, does not ignore minor parameter differences for PyTorch operators.no-merge-gemm-parameter: If specified, does not ignore minor parameter differences for GEMM operators.
You can define custom operator identification rules using the--ppu-op-config option. This option lets you use a regular expression to identify a specific operator type by matching an HGTX range name or a kernel name. The format isoperator_type=match_type:filter_rule. You can specify the--ppu-op-config option multiple times to define multiple operator identification rules. For example:
--ppu-op-config GEMM=kernel:gemv --ppu-op-config Pytorch=hgtx:aten--ppu-op-config GEMM=kernel:gemv: Matches kernels whose name contains the keywordgemvand classifies them as theGEMMoperator type.--ppu-op-config Pytorch=hgtx:aten: Matches HGTX ranges whose name contains the keywordatenand classifies their correlated PPU activities as thePyTorchoperator type.
The following is an example of the report output:
Row#,...GUI guide
Calculate column sums for selected rows
You can automatically sum the
Total TimeandPercentcolumns for selected rows. The sum appears in the second row of the table header. If you do not select any rows, the tool calculates the total for the column.
Settings
PPU devices: A filter for PPU devices. The statistics are filtered by the selected PPU devices. The default value is "All", which includes data from all PPU devices. This field is required.
Merge operator parameters: Ignores minor parameter differences that have a small impact on operator performance and merges them for statistical analysis. This is enabled for all operator types by default.
HGTX graph node mapping: Determines whether to map HGTX ranges from the HGGC graph capture phase to PPU-side activities. The mapping is established through HGGC graph nodes created within the HGTX range. The default value is "Yes".
Range Name Filter: Filters the HGTX range names in the results using a Perl-compatible regular expression. By default, all HGTX ranges are displayed. The GUI validates the expression, and if the syntax is invalid, an error message appears and prevents you from saving the settings.
Show top N results: Limits the output to the top N results. The default,
-1, displays all results.Parse from: Selects the source for parsing operators. All PPU activities are parsed only from the enabled sources. If an activity is successfully parsed, it is included in the operator statistics. The default is "ALL", which parses PPU activities from all supported sources. This field is required.
Custom operator parse config: Defines custom operator parsing rules. You can add rules to parse custom operator types by matching kernel names or HGTX names with regular expressions. These rules override the
Parse fromsetting. This is empty by default.
Pie chart statistics: Summarizes the total time by operator type (
OP Type) or operator name (OP Name). This allows you to visualize the time distribution of each operator type or a specific operator.
MoE operator summary
This report groups MoE operators from an asysrep report by their type and parameter values. It summarizes the execution time of each MoE operator group on the PPU and estimates the PPU hardware utilization for the GEMM operations within each group.
Required asys collection option: --trace hggc,hgtx
Tip: Before collecting an asysrep report, run export PPU_LIB_PERF_INSTRUMENT=1 to set the environment variable. This enables HGTX range annotation for PPU operators.
How it works
The tool calculates the execution time of an MoE operator as follows:
The total PPU-side execution time is the sum of the execution times of all constituent kernels.
The tool calculates the execution time for the first and second GEMM operators of each MoE operator.
When summarizing MoE operator information, the tool merges operators with mostly identical parameters. By default, it ignores minor parameter differences that have a small impact on performance.
Results are grouped by MoE operator parameter combinations and sorted in descending order by the "Total Time" column. The tool also summarizes the execution time for each operator.
The tool calculates the estimated PPU compute utilization of a GEMM operator for the first and second GEMM operators using the following formula:
Floating-point operations of the GEMM operator/ (Peak PPU FLOPS*Average execution time of the GEMM kernel)
The tool calculates the estimated HBM load and store utilization of a GEMM operator as follows:
Data size of the GEMM operator/ (Peak HBM bandwidth*Average execution time of the GEMM kernel)
The following list describes the columns in the moe_op_sum table:
Note: The "Percent" column shows an operator's total time as a percentage of the total for all operators in the table, not as a percentage of the total application execution time.
Row# : Row number of the MoE operator summary
Total Time (ns) : Total time used by all kernel instances of this operator
Percent (%) : Percentage of 'Total Time'
GEMM1 Total Time (ns) : Total time used by GEMM 1 kernel
GEMM2 Total Time (ns) : Total time used by GEMM 2 kernel
Instances : Number of this MoE operator
Avg (ns) : Average execution time of this operator's kernels
Med (ns) : Median execution time of this operator's kernels
Min (ns) : Smallest execution time of this operator's kernels
Max (ns) : Largest execution time of this operator's kernels
StdDev (ns) : Standard deviation of the time of this operator's kernels
GEMM1 Compute Util (%) : GEMM 1 utilization ratio of PPU compute capability
GEMM2 Compute Util (%) : GEMM 2 utilization ratio of PPU compute capability
GEMM1 HBM Load Util (%) : GEMM 1 utilization ratio of PPU HBM load bandwidth
GEMM1 HBM Store Util (%) : GEMM 1 utilization ratio of PPU HBM store bandwidth
GEMM2 HBM Load Util (%) : GEMM 2 utilization ratio of PPU HBM load bandwidth
GEMM2 HBM Store Util (%) : GEMM 2 utilization ratio of PPU HBM store bandwidth
OP Name : Name of the MoE operator
Command-line usage
asys stats -r moe_op_sum report.asysrepTo view detailed help information, run asys stats --help-report moe_op_sum. The following options are supported:
device=<device_list>: Specifies a list of PPU device IDs to analyze. Separate multiple PPU device IDs with a/. If unspecified, all PPU devices are analyzed.range-include=<regex_list>: Specifies an allowlist of regular expressions to filter HGTX ranges for analysis. Separate multiple regular expressions with a/. If unspecified, all HGTX ranges are analyzed.range-exclude=<regex_list>: Specifies a denylist of regular expressions to filter HGTX ranges for analysis. Separate multiple regular expressions with a/. If unspecified, all HGTX ranges are analyzed.no-graph-mapping: If specified, asys does not map HGTX ranges from the HGGC graph creation phase to the HGGC graph execution phase.no-merge-moe-parameter: If specified, asys does not ignore MoE operator parameter differences that have a minimal impact on performance.
Example output:
Row#,Total Time (ns),Percent (%),GEMM1 Total Time (ns),GEMM2 Total Time (ns),Instances,Avg (ns),Med (ns),Min (ns),Max (ns),StdDev (ns),GEMM1 Compute Util (%),GEMM2 Compute Util (%),GEMM1 HBM Load Util (%),GEMM1 HBM Store Util (%),GEMM2 HBM Load Util (%),GEMM2 HBM Store Util (%),OP Name,
1,4400578,0.2,2199129,1617367,6,733429,732642,729163,739724,3299,43.2,29.4,30.2,0.1,20.1,0.9,"MoE:M_876_E_128_H_4096_In_384_topk_8_topkids[136,0,25,167,68,17,3,5...]_unique_102",
2,4377299,0.2,2218248,1581567,6,729549,729244,726804,734042,2398,42.8,30.0,29.9,0.1,20.6,0.9,"MoE:M_876_E_128_H_4096_In_384_topk_8_topkids[0,28,0,17,24,81,10,143,...]_unique_102",
...
GUI
Sum columns for selected rows
The "Total Time" and "Percent" columns in the results table support automatic summing for selected rows. Totals appear in the second row of the table header. If you select no rows, the tool sums all rows in these columns.
Settings
PPU Devices: Filters the results by selected PPU devices. This is a required field. Default: "All".
HGTX graph node mapping: Specifies whether to map HGTX ranges from the HGGC graph capture phase to the PPU side. The tool establishes this mapping through HGGC graph nodes created within the HGTX range. The default is "Yes".
Range Name Filter: Filters HGTX range names in the results using a Perl-compatible regular expression. By default, the results include all HGTX ranges. The field validates syntax as you type. If the regular expression is invalid, an error appears and you cannot save the settings.
Merge MoE parameters: Ignores minor parameter differences that have a small impact on MoE operator performance and merges them for statistical analysis. This option is enabled by default.
Pie chart statistics: Summarizes the total time by operator name (OP Name). Use this chart to visualize the time percentage of each operator.
2.3.23 PCCL operators
This report groups PCCL operators from an asysrep report by type and parameter values, summarizes the communication time of each group across all participating PPU devices, and calculates the resulting transmission bandwidth.
Required asys trace option: --trace hggc,hgtx
Statistical rules
PCCL operators from multiple PPU devices are merged if they belong to the same communication group, have the same PCCL operator type (e.g., AllReduce), and have the same data size.
PCCL operator types fall into two categories:
Collective, such as AllReduce and Broadcast.
Point-to-point, such as Send and Recv.
For collective PCCL operators, the following rules apply:
For each PCCL operator communication, the transmission time
Trans Timeis the shortest execution time of a PCCL kernel among the participating PPU devices, and the value ofTrans Timein the statistical results is the sum of these transmission times.The
Instancescolumn in the statistical results indicates the number of PCCL operator communication instances. In scenarios where a communication involves multiple PPU devices, theInstancesvalue is not incremented multiple times.For each PCCL operator communication, the value of
Trans Sizein the statistical results is the sum of the data transmitted by each PPU device.
For point-to-point PCCL operators, the following rules apply:
The kernel execution time for each PCCL operator communication is considered the operator's transmission time, which serves as the value of
Trans Timein the statistical results.The number of kernel executions for PCCL operator communication is the value of
Instancesin the statistical results.
The output is sorted in descending order by Trans Time.
The pccl_op_sum table includes the following columns:
The
Trans Timecolumn indicates the actual transmission time for this group of PCCL communications, excluding the wait time caused by multiple PPU devices being out of sync.The
Instancescolumn indicates the number of PCCL communication instances for this operator. For example, for theAllReduceoperator, when all PPUs complete oneAllReduceoperation, the value in this column is incremented by 1.The
Device Maskcolumn represents a bitmap of the PPU devices involved in this operator. Each bit represents the index of a participating PPU device.
Row# : Row number of the PCCL operator summary
Trans Time [ns] : Transmission time for all kernel instances of the operator
Trans Percent [%] : Percentage of actual transmission time relative to 'Total Time'
Total Time [ns] : Total time for all kernel instances of the operator
Instances : Number of grouped transmissions for the PCCL operator
Device Mask : PPU device mask of this PCCL operator
Trans Size [bytes] : Total data size transmitted by the operator
Trans Bandwidth [B/s] : Transmission bandwidth
OP Name : PCCL operator name
Command-line usage
asys stats -r pccl_op_sum report.asysrepYou can run the asys stats --help-report pccl_op_sum command to view detailed help information. The supported options are as follows:
device=<device_list>: Specifies the list of PPU device IDs for which to collect statistics. Use a/to separate multiple PPU device IDs. If this parameter is omitted, statistics for all PPU devices are collected by default.range-include=<regex_list>: Specifies an allowlist of regular expressions that determine which HGTX ranges are included in the statistics. Multiple regular expressions are separated by
/. If this parameter is not specified, all HGTX ranges are included in the statistics by default.range-exclude=<regex_list>: Specifies a denylist of regular expressions, separated by a forward slash (
/), to exclude matching HGTX ranges from statistics. If this parameter is not specified, all HGTX ranges are included in the statistics by default.no-graph-mapping: If specified, does not map the HGTX from the HGGC graph creation stage to the HGGC graph execution stage.
Example output:
Row#,Trans Time (ns),Trans Percent (%),Total Time (ns),Instances,Device Mask,Trans Size (bytes),Trans Bandwidth (B/s),OP Name,
1,3899723152,94.0,4149397116,461,"0xF",464057794560,118997625337,"AllReduce, p:0, c:83886080, d:9, r:1, w:4, h:9da3d23b9ccef54c, t:1, b:0x301a000000/0x302d000000",
2,999480648,98.1,1018779730,129,"0xF",118878474240,118940246094,"AllReduce, p:0, c:76794880, d:9, r:1, w:4, h:9da3d23b9ccef54c, t:1, b:0x301a000000/0x3023279800",
3,100490800,68.8,146110859,1419,"0xF",1394933760,13881208628,"AllReduce, p:0, c:81920, d:9, r:1, w:4, h:9da3d23b9ccef54c, t:1, b:0x573c00000/0x573c28000",
...
GUI guide
Sum columns for selected rows
The
Trans Time,Total Time, andTrans Sizecolumns support automatic summation for selected rows. Totals appear in a secondary header row. If no rows are selected, the tool calculates the sum for all rows in the column.
Settings
PPU Devices: Filters the results by the selected PPU devices. Defaults to "All", which includes all devices. This field is required.
HGTX graph node mapping: If enabled, maps HGTX from the HGGC graph capture phase to the PPU execution phase. It associates HGGC graph nodes from an HGTX range with their corresponding PPU-side execution. Defaults to "Yes".
Range Name Filter: Filters results by HGTX range name using a Perl-compatible regular expression. By default, all ranges are shown. The editor validates the syntax as you type. If the expression is invalid, an error appears and you cannot save the settings.
Pie chart statistics: Displays a pie chart summarizing the
Trans Timedistribution byOP Name. This provides a visual breakdown of each operator's contribution to the total transmission time.
2.3.24 PPU metric trace
Exports PPU metric sampling trace data from an asysrep report. The output provides results for each sample, broken down by PPU device and metric name.
Required asys collection option: --ppu-metrics-device all
Report format
The output contains one row of data for each PPU device, PPU metric name, and sampling timestamp. The data is sorted in ascending order by timestamp.
The ppu_metric_trace table contains the following columns:
Row# : Row number of the PPU metric trace
Device ID : PPU device identifier
Start [ns] : Sample start timestamp
Duration [ns] : Sample duration
Name : Name of the PPU metric
Value : Value of the PPU metric
Unit : Unit of the PPU metric
Command line usage
asys stats -r ppu_metric_trace report.asysrepTo view detailed help information, run asys stats --help-report ppu_metric_trace. The following options are supported:
device=<device_list>: Specifies a list of PPU device IDs to analyze. Separate multiple PPU device IDs with a/. If not specified, all PPU devices are analyzed by default.metrics=<regex_filter>: Specifies a regular expression to filter PPU metrics. If not specified, all PPU metrics are analyzed by default.
The following example shows the report output:
Row#,Device ID,Start (ns),Duration (ns),Name,Value,Unit,
1,0,201274082,1089858,"ce__cycles_elapsed.avg.per_second",1600518599.7,"cycle/second",
2,0,201274082,1089858,"ce__cycles_active.avg.pct_of_peak_sustained_elapsed",98.7,"%",
...
16,1,201285295,1100045,"ce__cycles_elapsed.avg.per_second",199990000.4,"cycle/second",
17,1,201285295,1100045,"ce__cycles_active.avg.pct_of_peak_sustained_elapsed",0.0,"%",
18,1,201285295,1100045,"gd__dispatch_count.avg.pct_of_peak_sustained_elapsed",0.0,"%",
...
GUI usage guide
Settings
PPU Devices: Filters the results by PPU device. The default is "All". This field is required.
Metric Name Filter: Filters the PPU metric names in the results using a Perl-compatible regular expression. By default, all metrics are displayed. The tool performs a syntax check on the regular expression. If the syntax is invalid, the tool displays an error message and rejects the settings.
2.3.25 HGTX push pop range trace
This rule exports HGTX push pop range trace data from an asysrep report. The output includes HGTX range stack information and parent-child relationship details.
Required asys collection option: --trace hgtx
How it works
The analysis includes both HGTX domain and non-domain push-pop ranges. The stack information for an HGTX range depends on the stack state of its thread when the range begins.
For each HGTX range, a 'child range' is an immediate child HGTX range nested within it. This does not include more deeply nested ranges.
The results contain one row for each HGTX range trace, sorted by the range's start time.
The hgtx_pushpop_trace table contains the following columns:
Row# : Row number of the HGTX range trace
Start [ns] : Range start timestamp
End [ns] : Range end timestamp
Duration [ns] : Range duration
DurChild [ns] : Total duration of all child ranges
DurNonChild [ns] : Duration of this range minus the total duration of its child ranges
Name : Name of the HGTX range
PID : Process ID
TID : Thread ID
Lvl : Stack level, starts at 0
NumChild : Number of child ranges
RangeId : Arbitrary ID for the range
ParentId : Range ID of the enclosing range
RangeStack : Range IDs that make up the push/pop stack
NameTree : Range name prefixed with a level indicator
Command-line usage
asys stats -r hgtx_pushpop_trace report.asysrepFor detailed help information, run asys stats --help-report hgtx_pushpop_trace. The following options are supported:
range=<regex_filter>: Specifies a regular expression to filter the HGTX ranges for analysis. If omitted, the analysis includes all HGTX ranges.
Example report output:
Row#,Start (ns),End (ns),Duration (ns),DurChild (ns),DurNonChild (ns),Name,PID,TID,Lvl,NumChild,RangeId,ParentId,RangeStack,NameTree,
1,173403462,309023366,135619904,0,135619904,"profile",3730996,3730996,0,0,6,"-",":6","profile",
2,173765782,298721096,124955314,112237187,12718127,"Loop1",3730996,3731078,0,1,7,"-",":7","Loop1",
3,173985240,264616466,90631226,78300490,12330736,"Loop1",3730996,3731079,0,1,9,"-",":9","Loop1",
4,174054855,298794768,124739913,109974015,14765898,"Loop1",3730996,3731080,0,1,11,"-",":11","Loop1",
5,185211331,263511821,78300490,0,78300490,"DoProcess",3730996,3731079,1,0,13,9,":9:13","-DoProcess",
...
GUI guide
Settings
Range Name Filter: Filters HGTX range names using a Perl-compatible regular expression. The tool validates the expression's syntax as you type. An incorrect expression displays an error and prevents you from saving the settings. By default, the tool displays all HGTX ranges.
Pie chart: Displays a summary of the duration for each HGTX range.
2.3.26 PPU operator trace
Identifies PPU operators in an asysrep report and exports a trace of the PPU activities for each operator.
Required asys collection options:
--trace hggc,hgtx
Tip: Before you collect an asysrep report, we recommend enabling HGTX range annotation for PPU operators:
Run
export PPU_LIB_PERF_INSTRUMENT=1to set the environment variable, which enables HGTX range annotation for PPU operators in the base framework.Add the
--pytorch autograd-shapes-hgtxoption toasysto enable HGTX range annotation for PyTorch operators.
Calculation rules
The execution time of a PPU operator is calculated as follows:
A PPU operator's execution time spans from the start of its first associated PPU activity to the end of its last.
The exported trace contains one row per PPU activity. Rows are sorted by the PPU operator's start time, then by the activity's start time within each operator.
The ppu_op_trace table includes the following columns:
Row# : Row number of the PPU operator trace
OP Type : PPU operator type
Start [ns] : Start timestamp of the PPU operator
Duration [ns] : Duration of the PPU operator
PID : Process identifier
Device ID : PPU device identifier
Context ID : Context identifier
Stream ID : Stream identifier
PPU Active Time [ns] : PPU active time excluding overlapping for this operator
Active Percent [%] : Percentage of active time to duration time
OP Name : Name of the PPU operator
Command-line usage
asys stats -r ppu_op_trace report.asysrepFor detailed help, run asys stats --help-report ppu_op_trace. The following options are supported:
device=<device_list>: Specifies the list of PPU device IDs for which to collect statistics. Separate multiple PPU device IDs with a
/. If you do not specify this parameter, statistics for all PPU devices are collected by default.range-include=<regex_list>: Specifies an allowlist of regular expressions to select HGTX ranges for statistics. Multiple regular expressions are separated by a
/. If this parameter is not specified, all HGTX ranges are included in the statistics by default.range-exclude=<regex_list>: Specifies a denylist of regular expressions to exclude HGTX ranges from statistics. Multiple regular expressions are separated by a forward slash (
/). If this parameter is not specified, all HGTX ranges are included in the statistics by default.op=<operator_filter>: Specifies the list of PPU operator types to include in the statistics. Multiple PPU operator types are separated by a
/. If this parameter is not specified, all supported PPU operator types are included in the statistics by default. If you specify theotherstype, kernels that are not associated with a PPU operator are also included in the statistical results.no-merge-flash-attention-prefill-decode-operator: Preventsasysfrom matching and merging the prefill and decode components offlash attentionoperators.
Use the --ppu-op-config option to define custom operator identification rules. This allows you to identify a specific operator type by matching a kernel name or an HGTX range name with a regular expression. The format is operator_type=match_type:filter_rule. You can use the --ppu-op-config option multiple times to create multiple rules. For example:
--ppu-op-config GEMM=kernel:gemv --ppu-op-config PyTorch=hgtx:aten--ppu-op-config GEMM=kernel:gemv: Matches kernels whose kernel name contains thegemvkeyword and classifies them as theGEMMoperator type.--ppu-op-config Pytorch=hgtx:aten: Matches HGTX range names that contain the keywordatenand classifies the PPU activities associated with those ranges as thePytorchoperator type.
Example report output:
Row#,OP Type,OP Name,OP Start (ns),OP Duration (ns),OP ID,Activity ID,PID,Device ID,Context ID,Stream ID,Activity Start (ns),Activity Duration (ns),Activity Name,
1,"PCCL","AllReduce, p:0, c:442368, d:9, r:2, w:4, h:c70515c91cef61c7, t:1, b:0x119e800000/0x119e8d8000",136493999,16760,429199,535257,3790741,2,1,1,136493999,16760,"void pcclKernel_twoShotAllReduceKernel<__ppu_bfloat16, 4, 0, 0, 1, 1>(twoShotDevParams)",
2,"GEMM","ACBLAS:GemmEx,t,n,2048,72,6144,6144,6144,2048,1,0,1,DEFAULT,BF16,ACBLAS_GEMM_DEFAULT_TENSOR_OP,32F,EPILOGUE_DEFAULT",136513799,30320,429204,535262,3790741,2,1,1,136513799,26520,"gemm_ktype0_aiu1_mtype1_dtypeBF16xBF16xFP32xBF16xBF16_tile128x256x64x64x64x2_layout0x1x0x0_align1x1x8x8_splitk2_fusion0_prefetch0_fp32tc0_ptrhost1_schedule0",
...
GUI guide
Settings
PPU Devices: Filters statistics by selected PPU devices. Defaults to "All" (all devices). This field is required.
Range Name Filter: Filters HGTX range names using a Perl-compatible regular expression. By default, all HGTX ranges are included. The UI validates syntax in real time; invalid expressions trigger an error and prevent saving the settings.
Parse from: Selects sources for parsing PPU activities into operators. Only activities successfully parsed from an enabled source appear in the statistics. Defaults to "ALL" (all sources). This field is required.
Custom operator parse config: Defines custom rules for operator parsing. When enabled, you can add rules to identify custom operator types by matching kernel or HGTX range names with regular expressions. These custom rules take precedence over the 'Parse from' setting. This field is empty by default.
Merge flash attention prefill decode operators: When enabled, merges the prefill and decode components of a
flash attentionoperator, treating them as a single operator in the statistics.
Pie Chart Statistics: Displays a breakdown of total execution time by operator type (OP Type) or name (OP Name). This chart visualizes the runtime percentage of each operator, helping you identify performance bottlenecks.
2.3.27 PPU operator type summary
Identifies PPU operators in an asysrep report, groups them by operator type, summarizes the total PPU execution time for each type, and outputs information about the hotspot operator for each type.
Required asys collection options:
--trace hggc,hgtx
Tips: Before collecting an asysrep report, enable HGTX range annotation for PPU operators:
Run
export PPU_LIB_PERF_INSTRUMENT=1to set the environment variable, enabling HGTX range annotation for PPU operators in the base framework.Add the
--pytorch autograd-shapes-hgtxoption to the asys command to enable HGTX range annotation for PyTorch operators.
Statistical rules
The execution time of a PPU operator is calculated as follows:
The PPU-side execution time of each PPU operator is the duration from the start of its first associated PPU-side activity to the end of its last associated activity.
The PPU Active Time for a PPU operator is calculated as follows:
Active time is the total duration during which one or more PPU activities associated with the operator are running. If multiple activities overlap, the overlapping duration is counted only once.
The summary results are organized as follows:
For each PPU operator type, the tool summarizes the execution time of each operator and sorts the results by Total Time in descending order.
Within each PPU operator type, the tool aggregates the execution time for each combination of operator parameters and selects the combination with the longest total execution time as the hotspot operator.
A
Summaryrow is always generated by the tool. It aggregates execution time information for all PPU operator types and identifies the operator parameter combination with the longest total execution time as the hotspot operator for the summary row.
The ppu_op_type_sum table contains the following columns:
The row where the
OP Typecolumn isSummaryis the summary row. It summarizes the execution time information for all PPU operator types.
Row# : Row number of the PPU operator type summary
OP Type : PPU operator type
Percent [%] : Percentage of 'Total Time'
Avg [ns] : Average duration of this operator type
Total Time [ns] : Total duration for all instances of this operator type
Instances : Number of instances of this PPU operator type
PPU Active Time [ns] : Total PPU active time for this operator type, excluding overlapping periods
Active Percent [%] : The 'PPU Active Time' as a percentage of the 'Total Time'
Top OP Percent [%] : The percentage of 'Total Time' for this type contributed by the 'Top OP Name'
Top OP Name : Name of the hotspot operator for this type
Command-line usage
asys stats -r ppu_op_type_sum report.asysrepFor detailed help information, run asys stats --help-report ppu_op_type_sum. The supported options are as follows:
device=<device_list>: Specifies a list of PPU device IDs to analyze. Separate multiple IDs with a/. By default, all PPU devices are analyzed.range-include=<regex_list>: Specifies an allowlist of regular expressions to filter HGTX ranges for analysis. Separate multiple expressions with a/. By default, all HGTX ranges are included.range-exclude=<regex_list>: Specifies a denylist of regular expressions to filter HGTX ranges for analysis. Separate multiple expressions with a/. If not specified, no HGTX ranges are excluded.op=<operator_filter>: Specifies a list of PPU operator types to analyze. Separate multiple types with a/. If not specified, all supported PPU operator types are analyzed. If you specifyothers, the results also include kernels that are not associated with any PPU operator.no-graph-mapping: If specified, does not map HGTX ranges from the HGGC graph creation phase to the HGGC graph execution phase.no-merge-flash-attention-prefill-decode-operator: If specified, does not match and merge prefill and decode flash attention operators.no-merge-flash-attention-parameter: If specified, does not ignore parameter differences with minimal performance impact for flash attention operators.no-merge-communication-parameter: If specified, does not ignore parameter differences with minimal performance impact for communication operators.no-merge-moe-parameter: If specified, does not ignore parameter differences with minimal performance impact for MoE operators.no-merge-pytorch-parameter: If specified, does not ignore parameter differences with minimal performance impact for PyTorch operators.no-merge-gemm-parameter: If specified, does not ignore parameter differences with minimal performance impact for GEMM operators.
You can use the --ppu-op-config option to customize operator identification rules. You can specify a regular expression to identify a specific operator type by matching an HGTX range name or a kernel name. The format is operator_type=match_type:filter_rule. You can specify the --ppu-op-config option multiple times to create multiple operator identification rules. For example:
--ppu-op-config GEMM=kernel:gemv --ppu-op-config Pytorch=hgtx:aten--ppu-op-config GEMM=kernel:gemv: Classifies kernels whose names contain the keywordgemvas theGEMMoperator type.--ppu-op-config Pytorch=hgtx:aten: Classifies PPU activities associated with HGTX ranges whose names contain the keywordatenas thePytorchoperator type.
The following is an example of the report output:
Row#,OP Type,Percent (%),Avg (ns),Total Time (ns),Instances,PPU Active Time (ns),Active Percent (%),Top OP Percent (%),Top OP Name,
1,"Summary",100.0,49885,3354637726,67247,3348054119,99.8,51.1,"MoE:M_72_E8_H6144_In8192_topk2",
2,"MoE",63.6,293641,2133601622,7266,2129239591,99.8,51.1,"MoE:M_72_E8_H6144_In8192_topk2",
3,"PCCL",8.2,37031,273847048,7395,273847048,100.0,4.4,"AllReduce, p:0, c:442368, d:9, r:2, w:4, h:c70515c91cef61c7, t:1, b:0x119e800000/0x119e8d8000",
...
GUI guide
Sum columns for selected rows
The "Total Time", "Instances", and "PPU Active Time" columns support automatic summation for selected rows. The sum appears in the second row of the table header. This calculation excludes the "Summary" row. If no rows are selected, the tool calculates the sum for all rows in the column.
Settings
PPU devices: Filters results by the selected PPU devices. The default is "All", which includes data from all PPU devices. This field cannot be empty.
Merge operator parameters: Ignores parameter differences that have minimal impact on performance and merges them for statistical analysis. This is enabled by default for all operator types.
Range name filter: Filters HGTX range names using a Perl-compatible regular expression. By default, this filter displays all HGTX ranges. The tool validates the syntax as you type; if the expression is invalid, an error message appears and you cannot save the settings.
Parse from: Selects the sources for parsing operators. The statistics include only PPU activities parsed from an enabled source. The default is "ALL", which attempts to parse activities from all supported sources. This field cannot be empty.
Custom operator parse config: Defines custom operator parsing rules. When enabled, you can add rules to parse custom operator types by matching kernel or HGTX names with regular expressions. These custom rules have a higher priority than the "Parse from" selection. This field is empty by default.
Pie chart statistics: Displays a pie chart that summarizes the total execution time by
OP Type, so you can visualize the percentage of total time consumed by each type.
PPU operator kernel performance breakdown
This feature identifies PPU operators in an asysrep report and classifies them into three layers—the framework layer, the compute library layer, and the kernel layer—based on operator type and nesting relationship. It aggregates the PPU execution time for each operator and hierarchically breaks down the performance data to the kernel layer, providing a detailed, layer-by-layer view of nested operators.
Required asys collection options:
--trace hggc,hgtx
Tip: Before collecting an asysrep report, enable HGTX range annotation for PPU operators:
Run
export PPU_LIB_PERF_INSTRUMENT=1to set the environment variable that enables HGTX range annotation for PPU operators in the base framework.Add the
--pytorch autograd-shapes-hgtxoption to theasyscommand to enable HGTX range annotation for PyTorch operators.
Statistics rules
The tool identifies operators at each layer using HGTX annotations and kernel names. It determines nesting relationships based on the operators' projected time ranges on the PPU.
The tool classifies PPU operators into three layers: the framework layer, the compute library layer, and the kernel layer, although some layers may not contain PPU operator information. Nesting relationships are analyzed from the top down. An operator at the highest level of a nesting hierarchy is a top-level operator, regardless of its layer.
The Total Time for the PPU operator summary is calculated as follows:
The sum of the execution times of all
top-level operators.
The time percentage for each PPU operator type is calculated as follows:
The
total execution timeis the sum of the execution times of all instances of the PPU operator.The time percentage is the
total execution timedivided by theTotal Time.
Within the time range of a parent operator, any period where no child operator is executing (i.e., the PPU is idle) is labeled Idle. In the hierarchy, if an operator lacks a direct parent in the layer above, its missing parent is labeled Native.
The summary results are organized as follows:
The summary lists operators from the framework, compute library, and kernel layers, sorted in descending order by their time percentage.
The following list describes the columns in the ppu_op_kernel_breakdown table:
Row# : Row number
OP Type : Operator type
Framework OP : Framework layer operator name
Framework Time [%] : Time percentage of Total Time
Framework Avg [ns] : Average duration
Framework Instances : Number of instances
Library OP : Compute library layer operator name
Library Time [%] : Time percentage of Total Time
Library Avg [ns] : Average duration
Library Instances : Number of instances
Kernel Name : HGGC kernel name
Kernel Time [%] : Time percentage of Total Time
Kernel Avg [ns] : Average duration
Kernel Instances : Number of instances
Command-line usage
asys stats -r ppu_op_kernel_breakdown report.asysrepTo view detailed help information, run asys stats --help-report ppu_op_kernel_breakdown. The following options are supported:
rows=<limit>: Limits the number of rows in the output. Operators with a small time percentage may be omitted.
device=<device_list>: Specifies a list of PPU device IDs to analyze. Separate multiple PPU device IDs with a
/. By default, all PPU devices are analyzed.range-include=<regex_list>: Specifies an allowlist of regular expressions to filter HGTX ranges for analysis. Separate multiple regular expressions with a
/. By default, all HGTX ranges are analyzed.range-exclude=<regex_list>: Specifies a denylist of regular expressions to filter HGTX ranges for analysis. Separate multiple regular expressions with a
/. By default, all HGTX ranges are analyzed.base: Groups and displays statistics by the kernel's short name (the function name without parameters).
mangled: Groups and displays statistics by the kernel's mangled name.
op=<operator_filter>: Specifies the list of PPU operator types to include in the statistics. Use
/to separate multiple PPU operator types. If you do not specify this parameter, all supported PPU operator types are included in the statistics by default. If you specify theotherstype, kernels that are not associated with any PPU operator are also included in the statistical results.order-by=<order_type>: Specifies the sort order for the output. By default, the results are sorted by operator time percentage.
no-merge-flash-attention-prefill-decode-operator: If specified, the tool does not match and merge prefill and decode flash attention operators.
no-merge-flash-attention-parameter: If specified, the tool does not ignore minor parameter differences for flash attention operators.
no-merge-communication-parameter: If specified, the tool does not ignore minor parameter differences for communication operators.
no-merge-moe-parameter: If specified, the tool does not ignore minor parameter differences for MoE operators.
no-merge-pytorch-parameter: If specified, the tool does not ignore minor parameter differences for PyTorch operators.
no-merge-gemm-parameter: If specified, the tool does not ignore minor parameter differences for GEMM operators.
You can use the --ppu-op-config option to customize operator recognition rules. Custom operators matched by an HGTX range name are counted as framework layer operators, and custom operators matched by a kernel name are counted as kernel layer operators.
Example report output:
Row#,OP Type,Framework OP,Framework Time (%),Library OP,Library Time (%),Kernel Name,Kernel Time (%),Avg (ns),Instances,
1,"MoE","D_MoE,M_8_E_128_H_2048_In_768_topk_8",44.3,"DeepGemm:GroupedNoPad,data_type:bf16,groups:128,m:64,n:768,k:2048,gpu:0",23.3,"void deep_gemm::batched_gemvt_kernel<__nv_bfloat16, __nv_bfloat16, float, int4, int4, 256, 32, 2, 2, 2>(deep_gemm::GemvtArgs)",23.3,55495,28128,
2,"MoE","D_MoE,M_8_E_128_H_2048_In_768_topk_8",44.3,"DeepGemm:GroupedNoPad,data_type:bf16,groups:128,m:64,n:2048,k:384,gpu:0",13.0,"void deep_gemm::batched_gemvt_kernel<__nv_bfloat16, __nv_bfloat16, float, int4, int4, 256, 8, 4, 1, 1>(deep_gemm::GemvtArgs)",13.0,30975,28128,
3,"MoE","D_MoE,M_8_E_128_H_2048_In_768_topk_8",44.3,"Native",7.3,"_fwd_kernel_ep_gather",2.3,17378,28128,
4,"MoE","D_MoE,M_8_E_128_H_2048_In_768_topk_8",44.3,"Native",7.3,"_fwd_kernel_ep_scatter_2_optimal",1.1,17378,28128,
...
Tip: Use the --format xlsx option to output a spreadsheet for more readable statistical results.
PPU operator performance breakdown
This analysis identifies PPU operators in an asysrep report and classifies them into three layers based on type and nesting: the framework layer, the compute library layer, and the kernel layer. It provides a performance breakdown down to the compute library layer and includes device utilization data.
Required asys collection options:
--trace hggc,hgtx
Tips: Before collecting an asysrep report, enable HGTX range annotations for PPU operators:
Run
export PPU_LIB_PERF_INSTRUMENT=1to set an environment variable that enables HGTX range annotations for PPU operators in the base framework.Add the
--pytorch autograd-shapes-hgtxoption to the asys command to enable HGTX range annotations for PyTorch operators.
Statistics rules
The tool identifies operators at each layer using HGTX markers and kernel names. It determines the nesting relationship between operators based on their projected time ranges on the PPU.
The tool categorizes PPU operators into three layers: the framework layer, the compute library layer, and the kernel layer. Some layers may not contain any PPU operators. An operator at the highest level of a nested structure is called a top-level operator, regardless of its layer.
The tool calculates the Total Time in the PPU operator summary as follows:
The sum of the execution times of all
top-level operators.
The tool calculates the time percentage for each PPU operator type as follows:
The
total execution timeis the sum of the execution times for all instances of a given PPU operator type.The time percentage is the
total execution timedivided by theTotal Time.
Within a parent-level PPU operator, time periods without child-level PPU operators (when the PPU device is idle) are marked as Idle. At each level, missing parent-level PPU operators are marked as Native.
The summary results are organized as follows:
The tool sorts operators in the framework layer and compute library layer in descending order by time percentage.
The following describes the columns in the ppu_op_breakdown table:
Row# : Row number
OP Type : PPU operator type
Framework OP : Framework layer operator name
Framework Time [%] : Framework operator time percentage
Framework Avg [ns] : Average duration of this framework operator
Framework Instances : Number of this framework operator
Library OP : Compute library layer operator name
Library Time [%] : Library operator time percentage
Library Avg [ns] : Average duration of this library operator
Library Instances : Number of this library operator
Compute Util [%] : PPU compute utilization
HBM Load Util [%] : PPU HBM load bandwidth utilization
HBM Store Util [%] : PPU HBM store bandwidth utilization
Command-line usage
asys stats -r ppu_op_breakdown report.asysrepTo view detailed help, run asys stats --help-report ppu_op_breakdown. The following options are supported:
rows=<limit>: Limits the number of rows in the output. Operators with a small time percentage may be omitted.
device=<device_list>: Specifies a list of PPU device IDs to analyze. Separate multiple PPU device IDs with a
/. If this option is not specified, the tool analyzes all PPU devices by default.range-include=<regex_list>: Specifies an allowlist of regular expressions to filter HGTX ranges for analysis. Separate multiple regular expressions with a
/. If this option is not specified, the tool analyzes all HGTX ranges by default.range-exclude=<regex_list>: Specifies a denylist of regular expressions to filter HGTX ranges for analysis. Separate multiple regular expressions with a
/. If this option is not specified, the tool analyzes all HGTX ranges by default.op=<operator_filter>: Specifies a list of PPU operator types to analyze. Separate multiple PPU operator types with a
/. If this option is not specified, the tool analyzes all supported PPU operator types by default. If you specify theotherstype, the results also include kernels not associated with any PPU operator.order-by=<order_type>: Specifies the sort order for the output. By default, the tool sorts the results by operator time percentage.
no-merge-flash-attention-prefill-decode-operator: If specified, asys does not match and merge prefill and decode flash attention operators.
no-merge-flash-attention-parameter: If specified, asys does not ignore parameter differences in flash attention operators that have a minimal impact on performance.
no-merge-communication-parameter: If specified, asys does not ignore parameter differences in communication operators that have a minimal impact on performance.
no-merge-moe-parameter: If specified, asys does not ignore parameter differences in MoE operators that have a minimal impact on performance.
no-merge-pytorch-parameter: If specified, asys does not ignore parameter differences in PyTorch operators that have a minimal impact on performance.
no-merge-gemm-parameter: If specified, asys does not ignore parameter differences in GEMM operators that have a minimal impact on performance.
You can use the --ppu-op-config option to define custom operator identification rules. The tool classifies custom operators matched by an HGTX range name as framework layer operators and those matched by a kernel name as kernel layer operators.
Example output (some columns are omitted):
Row#,OP Type,Framework OP,Framework Time (%),Library OP,Library Time (%),Library Avg (ns),Library Instances,Compute Util (%),HBM Load Util (%),HBM Store Util (%),
1,"MoE","D_MoE,M_8_E_128_H_2048_In_768_topk_8",44.3,"DeepGemm:GroupedNoPad,data_type:bf16,groups:128,m:64,n:768,k:2048,gpu:0",23.3,55495,28128,2.6,262.6,0.0,
2,"MoE","D_MoE,M_8_E_128_H_2048_In_768_topk_8",44.3,"DeepGemm:GroupedNoPad,data_type:bf16,groups:128,m:64,n:2048,k:384,gpu:0",13.0,30975,28128,2.3,235.1,0.0,
3,"MoE","D_MoE,M_8_E_128_H_2048_In_768_topk_8",44.3,"Native",7.3,2482,196896,"-","-","-",
4,"MoE","D_MoE,M_8_E_128_H_2048_In_768_topk_8",44.3,"Idle",0.7,1681,28128,"-","-","-",
...
2.3.30 PPU operator unit tests (experimental)
This feature groups PPU operators from an asysrep report by type and parameter values and generates unit test code for each summarized PPU operator.
Required asys collection options:
--trace hggc,hgtx--pytorch=dispatch-function
Note: The --pytorch=dispatch-function option is an experimental feature. Enabling this option may cause the application to crash or behave unexpectedly.
How it works
The execution time of a PPU operator is calculated as follows:
The PPU-side execution time of each PPU operator is the duration between the start of its first correlated PPU-side activity and the end of its last.
When summarizing PPU operator information, the tool merges operators that have mostly identical parameters. By default, it ignores minor parameter differences that have a small impact on performance.
The results are organized as follows: The tool summarizes the execution time for each PPU operator parameter combination, ignoring minor performance-impacting parameter differences by default. It then generates unit test code for each combination in descending order of Total Time.
Note: The tool does not support unit test code generation for some operators. The end of the report lists the generated unit test names for all summarized PPU operators.
Command-line usage
asys stats -r ppu_op_unit_test report.asysrepTo view detailed help information, run asys stats --help-report ppu_op_unit_test. The following are some of the supported options:
device=<device_list>: Specifies a list of PPU device IDs to analyze. Separate multiple PPU device IDs with a
/. If omitted, the tool analyzes all PPU devices by default.range-include=<regex_list>: Specifies an allowlist of regular expressions to filter HGTX ranges for analysis. Separate multiple regular expressions with a
/. If omitted, the tool analyzes all HGTX ranges by default.range-exclude=<regex_list>: Specifies a denylist of regular expressions to filter HGTX ranges for analysis. Separate multiple regular expressions with a
/. If omitted, the tool analyzes all HGTX ranges by default.op=<operator_filter>: Specifies a list of PPU operator types to analyze. Separate multiple PPU operator types with a
/. If omitted, the tool analyzes all supported PPU operator types by default. If you specify theotherstype, the results also include kernels that are not correlated with any PPU operator.no-merge-pytorch-parameter: If specified, the tool does not ignore minor parameter differences for PyTorch operators.
The following example shows how to run the generated unit tests. By default, each unit test runs once. You can use command-line options to control which test cases to run and how many times to repeat them:
python report_ppu_op_unit_test.py --top 3 --warm-up 5 --repeat 5--top 3: Runs the test cases for the top 3 operators by total duration.--warm-up 5: Runs the test 5 times before timing begins.--repeat 5: Runs the test 5 times during the timing phase to calculate the average duration.The
--testoption lets you specify which test cases to run. Separate multiple names with a,.
3. Compare two reports
3.1 Using the comparison view
Similar to the statistics system, you can switch to the comparison view by selecting the "Comparison View" tab at the bottom of the GUI. The comparison view is shown below:
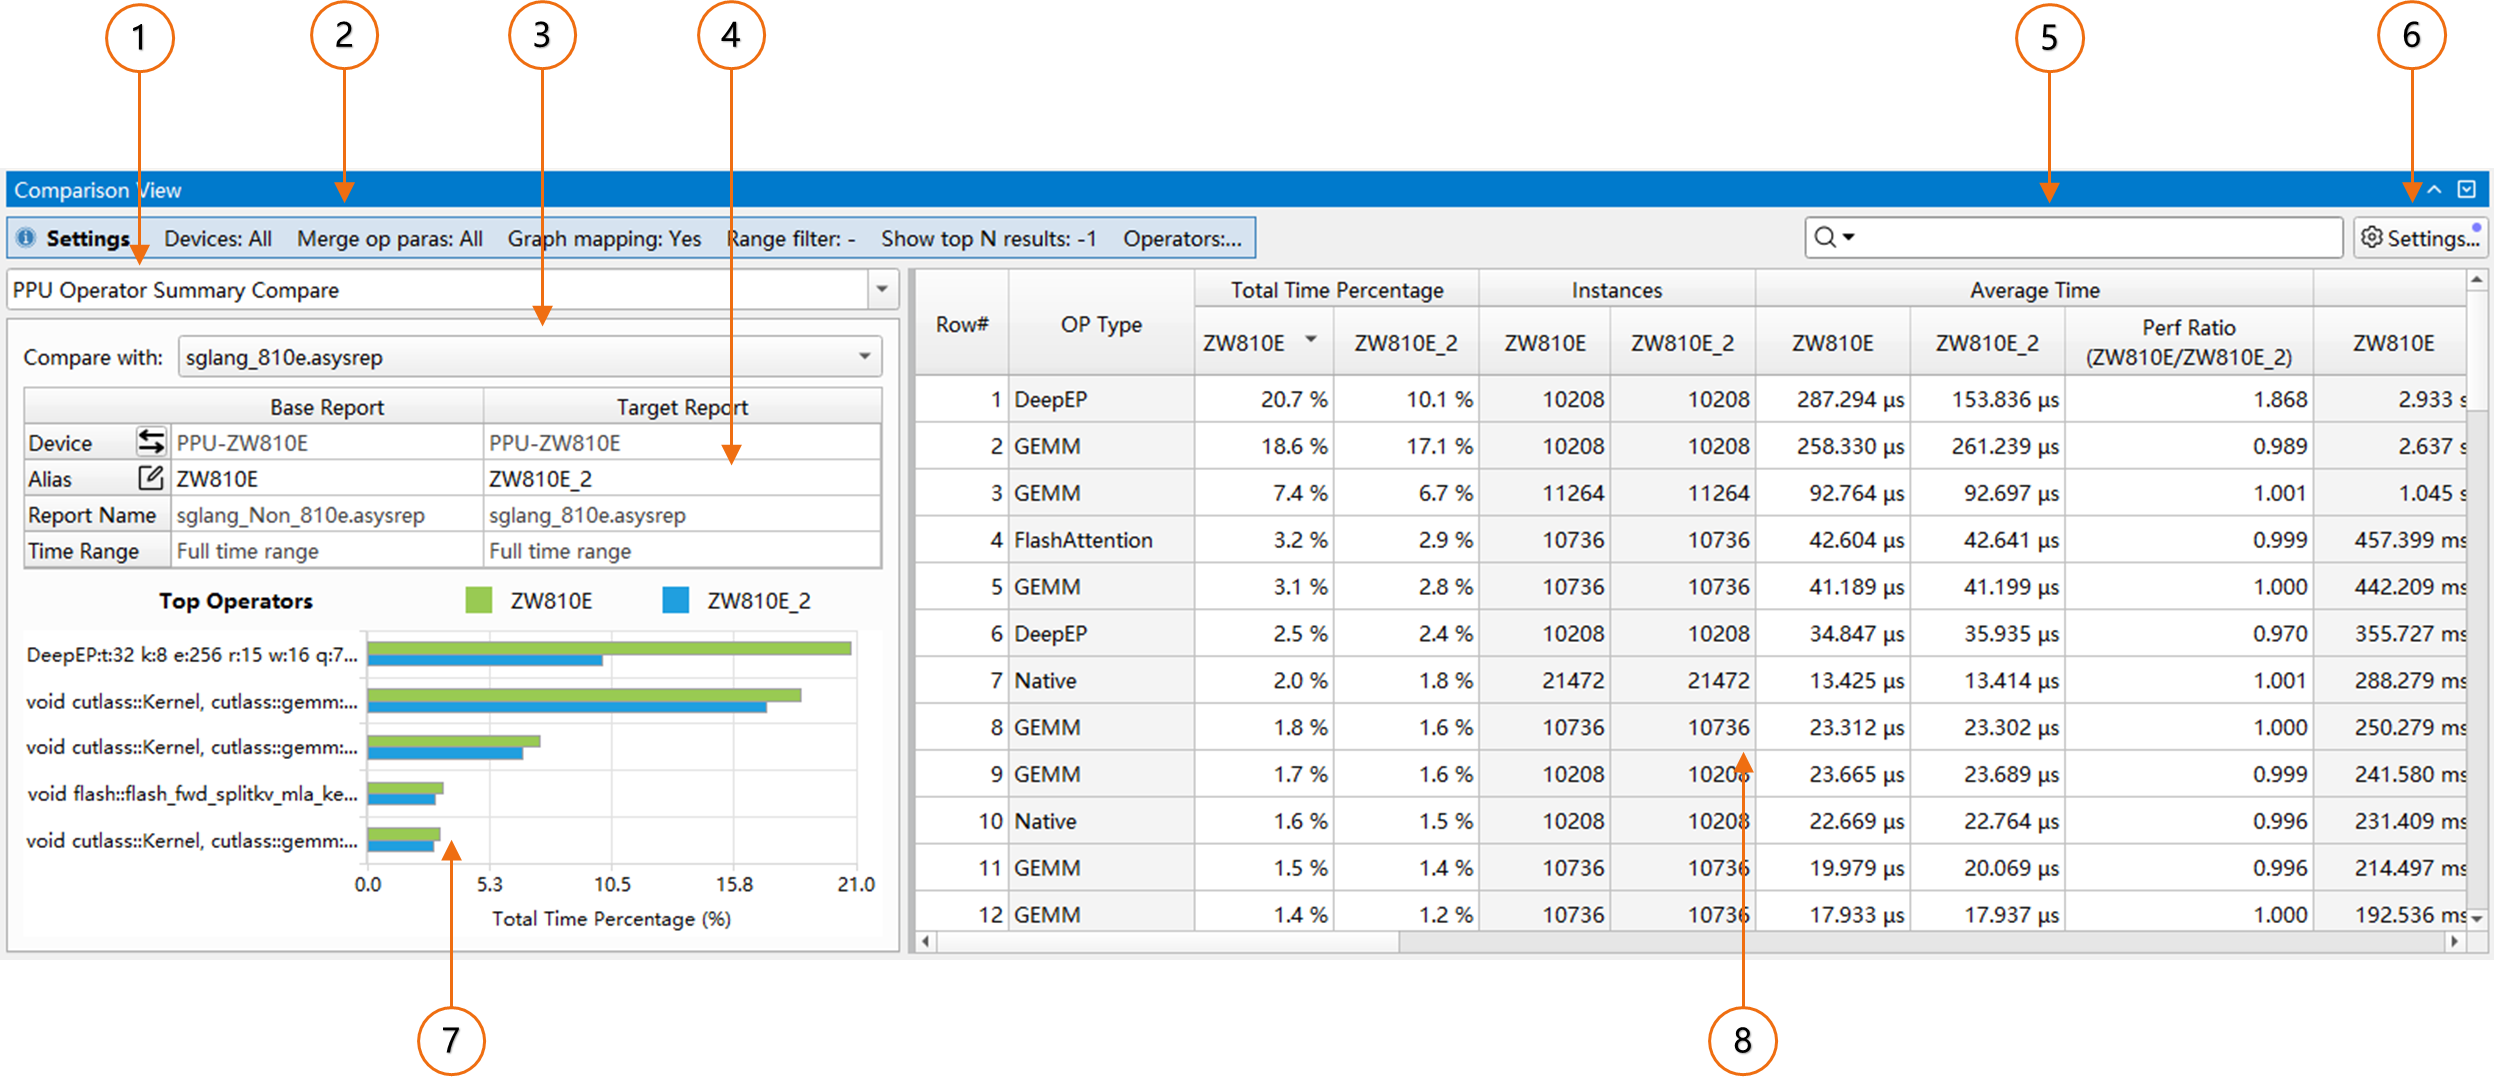
Rule list: Select or search for statistics rules.
Active parameter configuration: Hover over this area to view parameter details.
"Compare with" selection box: Select another open asys report as the target report.
Report comparison information: Displays information such as the device name, alias, report name, and time range for both the base and target reports. You can also swap the base and target reports or change their aliases here.
Search box: Supports both search and filter modes.
Rule parameter configuration dialog: Change the settings for the current statistics rule.
Hotspot histogram: Displays the performance hotspots for both the base and target reports.
Report comparison results table: Shows the comparison results for the current rule. You can export the analysis results from the context menu.
Set the time range
The report comparison feature lets you set a separate time range for each report. The comparison analyzes only the events within the selected time ranges. To set a time range, open the desired report, drag your cursor to select an area in the Timeline View, right-click the selected area, and click "Filter and Zoom in" from the context menu.
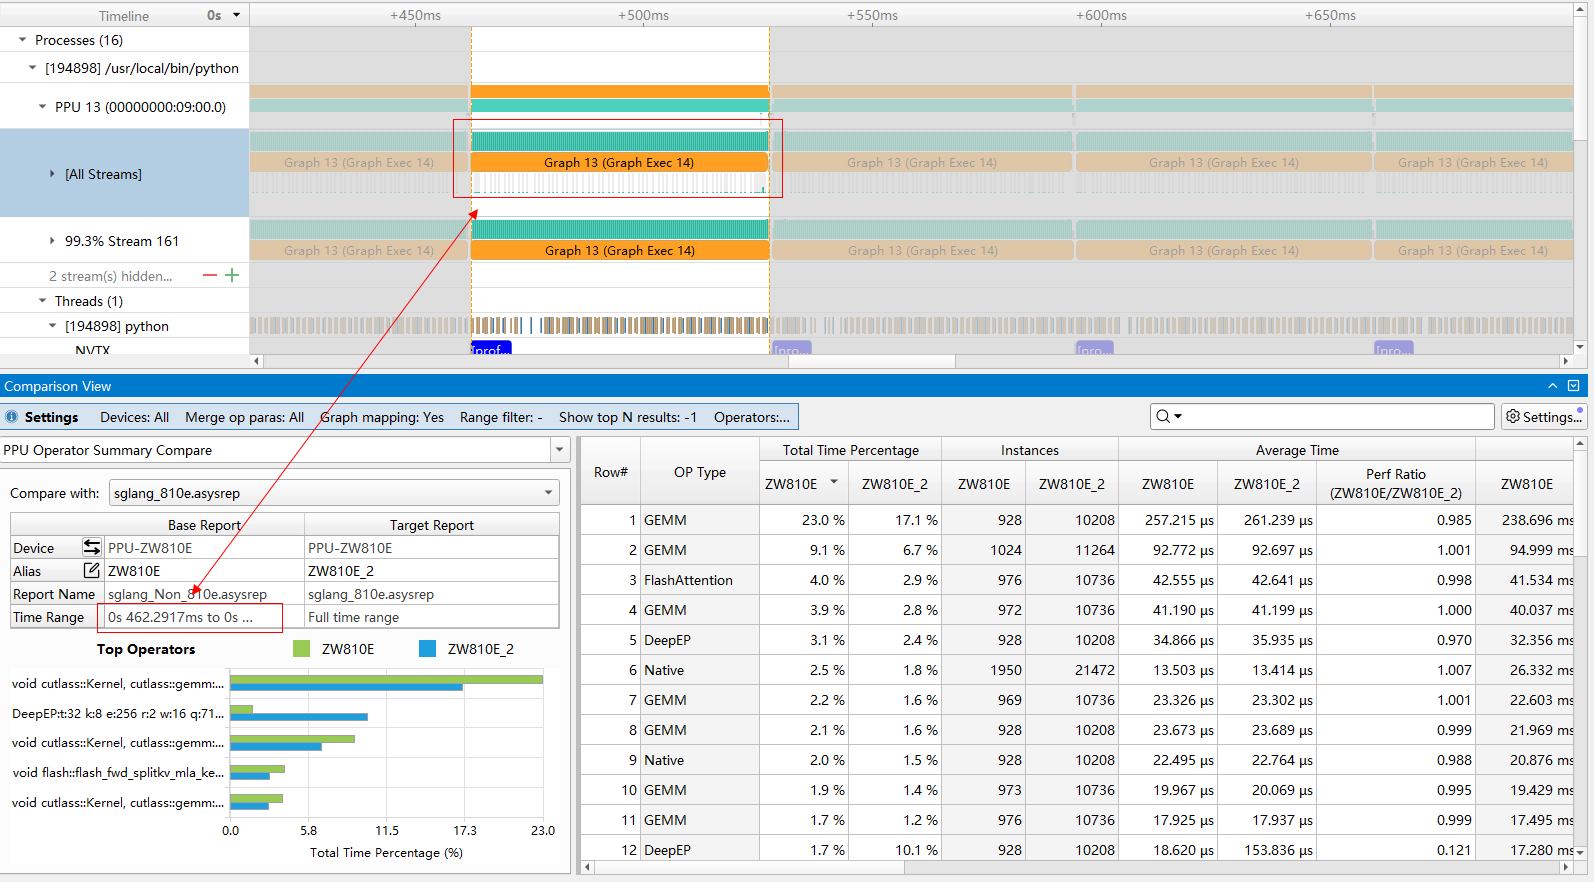
"Compare with" selection box and comparison information
Use the "Compare with" selection box at the top to select another open asys report as the target report. After you select a target report, a comparison information table appears below. This table displays information such as the device name, alias, report name, and time range for both the base and target reports.
In this table:
Click the swap button next to the "Device" label to swap the base and target reports.
The "alias" row is editable. Double-click a cell in this row to assign an alias to the corresponding report. This alias appears in the legend of the hotspot histogram and in the header of the results table.
"Time range" shows the time range for analysis. By default, the feature analyzes the entire report. To apply a new time range, select an area in the corresponding report's Timeline View and click "Filter and Zoom in."
Hotspot histogram
The hotspot histogram displays the performance hotspots for the base and target reports, sorted in descending order. You can increase the height of the Comparison View to show more hotspot rows in the histogram.
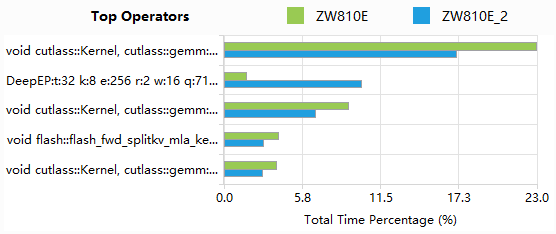
In the figure above:
Chart title: Indicates the content displayed in the histogram.
Legend: Uses different colors to distinguish between the two reports and displays their aliases.
Vertical axis: This axis lists the hotspot operators. They are sorted in descending order based on which operator has the larger percentage value in either of the two reports. Click any bar to jump to the corresponding row in the comparison results table.
Horizontal axis: Represents the metric used to evaluate hotspots. In this example, the metric is the percentage of total report time.
Report comparison results table
This table compares performance metrics for the two reports.
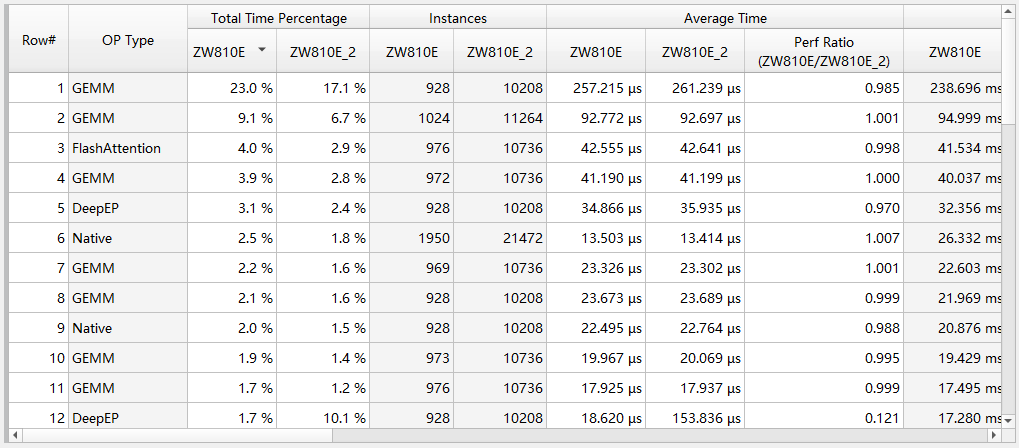
For some metrics, a "Perf Ratio" is provided. This ratio indicates the performance of the target report relative to the base report. A value of
Perf Ratio > 1.0indicates that the target report performs better for that metric. Conversely, a value less than 1.0 indicates that the base report performs better.A hyphen (-) in a cell indicates that no matching item exists in the corresponding report.
Click any column header to sort the table. Right-click the table to export it as a CSV file.
Custom comparison settings
In the upper-right corner, click the "Settings" button to configure the report comparison. Available settings vary by comparison rule. The following sections describe some key settings:
Custom operator parsing configuration
You can also define custom parsing rules for operators. For example, you can add a SpecialGemm operator type:
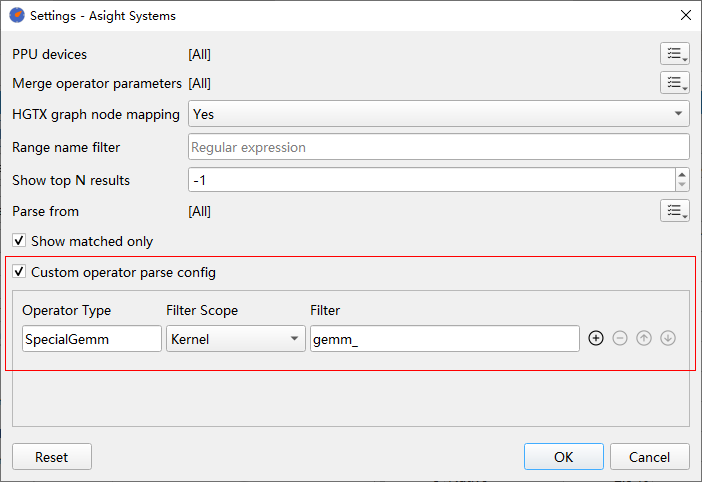
After you apply the configuration, the results are updated as shown below:
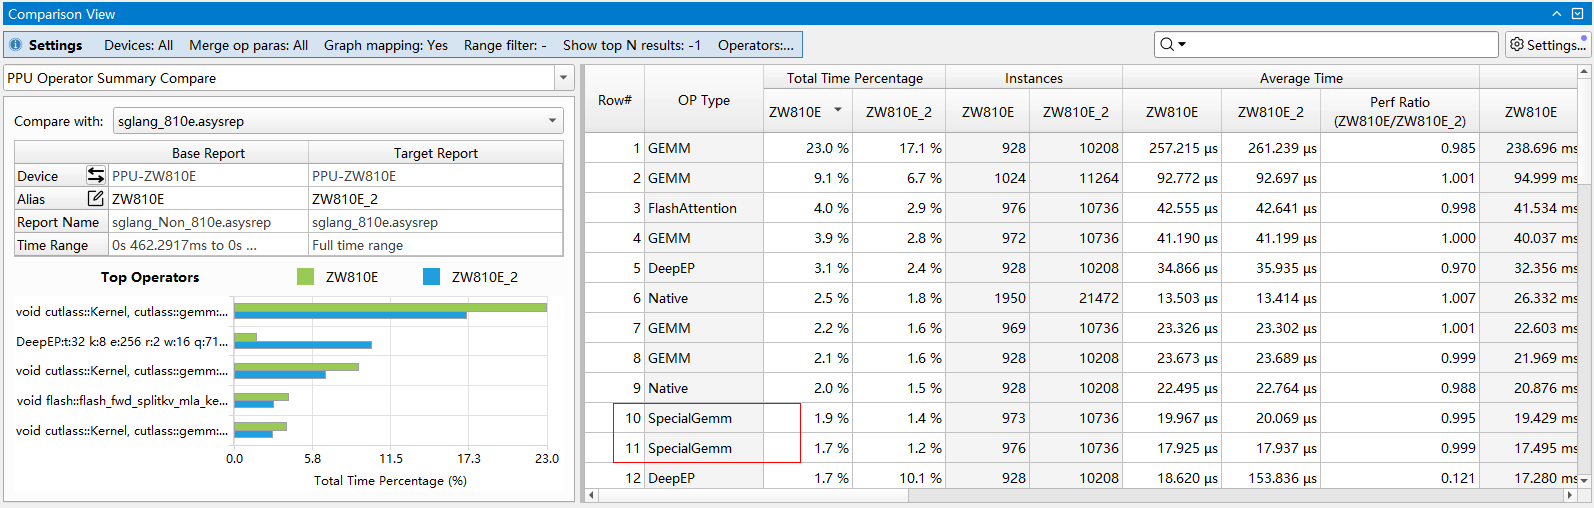
Note: Custom operator parsing rules have a higher priority than the default parsing rules.
Show matched only
The comparison results table may contain unmatched rows that exist in one report but not the other. These rows are highlighted in the figure below. To view only matched results, select the "Show matched only" checkbox.
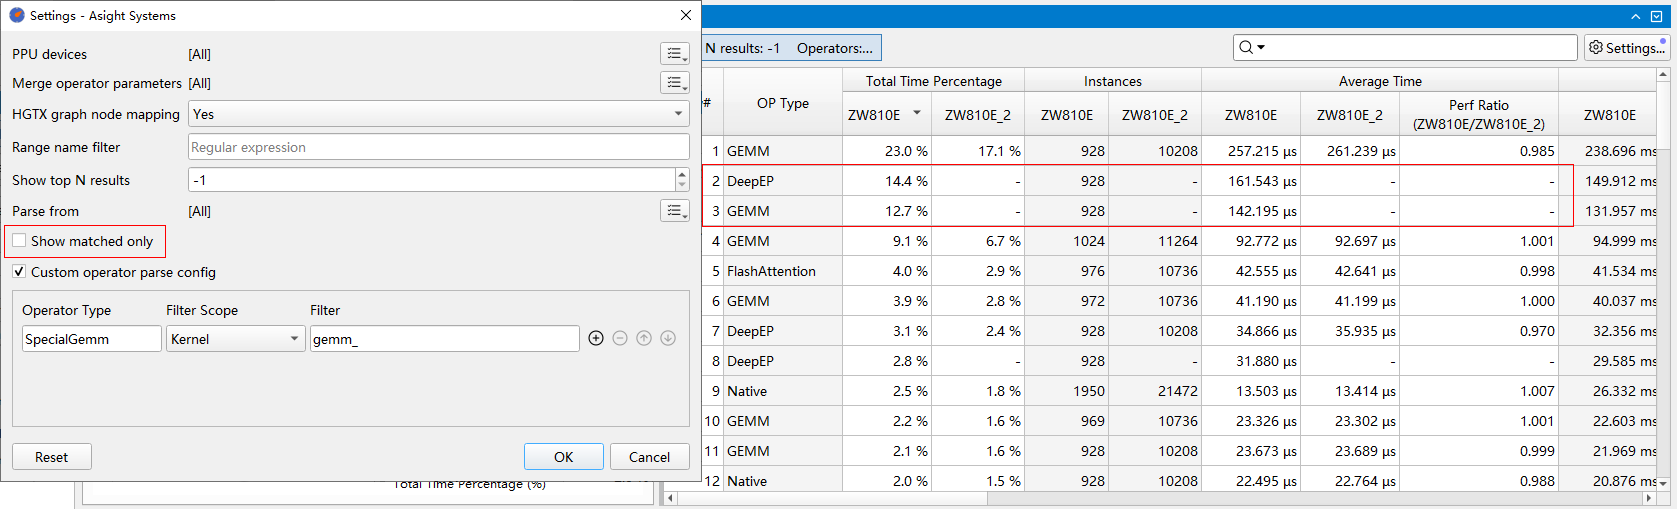
3.2 Compare reports from the CLI
Use the asys compare subcommand to compare two asysrep report files. The asys compare subcommand is a simplified version of the asys stats subcommand. It displays a brief comparison and outputs detailed summary data to a CSV file. For example:
asys compare -f true report1.asysrep report2.asysrep-f true: Allows the output comparison files to overwrite existing files.
Run asys compare -h for more information.
By default, the asys compare subcommand runs the following comparison rules:
PPU operator type summary comparison (ppu_operator_type_summary_compare)
PPU time utilization comparison (ppu_time_util_compare)
PPU operator summary comparison (ppu_operator_summary_compare)
PPU operator kernel performance breakdown (ppu_operator_kernel_breakdown_compare)
PCCL desync summary comparison (pccl_desync_summary_compare)
PPU kernel summary comparison (ppu_kernel_summary_compare)
Specify time range for analysis
You can use the --filter-hgtx option to specify the time range for analysis by using HGTX annotations. The specified HGTX range determines the time range for analysis in both reports.
Use the --filter-hgtx option to specify the name, domain, and index of the HGTX range to match. The format is range_name@domain/index. If a matching HGTX range has no domain, you can omit @domain. Otherwise, @domain is required.
By default, asys uses the first matching HGTX range as the time range for analysis. In this case, you can omit /index. To specify a match by index, use /index. The index is 0-based.
For example, use the HGTX range named self_attention to specify the time range for analysis. This range has no domain, and the command uses the time range from the first match.
asys compare --filter-hgtx self_attention report1.asysrep report2.asysrepFor example, use the HGTX range named pcclGroupEnd with the domain NCCL to specify the time range for analysis. The command uses the time range from the ninth match (index 8).
asys compare --filter-hgtx "pcclGroupEnd@NCCL/8" report1.asysrep report2.asysrepSpecify output files
asys compare prints a concise comparison to the console and writes detailed comparisons to CSV files.
Use the --output option to specify the output path and filename prefix. The specified value is a combination of an output directory and a filename prefix in the format <output_dir>/<prefix>. The prefix can be empty. asys treats the path before the last / as the output directory. If you do not specify the --output option, asys generates filenames based on the asysrep report filenames and the comparison report types.
For example, specifying --output /test/mytest generates various comparison reports in the /test directory. Example filenames include mytest_ppu_operator_summary_compare.csv and mytest_ppu_kernel_summary_compare.csv:
asys compare -f true --output /test/mytest report1.asysrep report2.asysrep-f true: Allows the output comparison files to overwrite existing files.--output /test/mytest: Generates comparison reports in the/testdirectory with the filename prefixmytest.
Specify operator identification rules
The asys compare results include PPU operator comparisons. The tool uses built-in PPU operator identification rules to identify operators in the reports and compare their performance. You can use the --ppu-op-config option to define custom operator identification rules. This option lets you use a regular expression to identify an operator type by matching its HGTX range name or a kernel name. The format is operator_type=match_type:filter_rule. You can specify the --ppu-op-config option multiple times to create multiple rules. For example:
asys compare --ppu-op-config GEMM=kernel:gemv --ppu-op-config Pytorch=hgtx:aten report1.asysrep report2.asysrep--ppu-op-config GEMM=kernel:gemv: Classifies kernels whose names contain the keywordgemvas theGEMMoperator type.--ppu-op-config Pytorch=hgtx:aten: Classifies PPU activities correlated with HGTX ranges whose names contain the keywordatenas thePytorchoperator type.
3.3 Report comparison rules
PPU kernel summary comparison
Compares the PPU kernel summary results from two asysrep reports by matching kernels and comparing their execution time differences.
Required asys collection option:
--trace hggc
How it works
For each asysrep report, an HGGC PPU kernel summary is calculated by aggregating data by HGGC kernel name. The kernel information from the summary results of two asysrep reports is matched by using the HGGC kernel name and then output in descending order of the total time of the HGGC kernel from each report. The HGGC kernel name depends on whether the base/mangled option is set and defaults to the demangled kernel name (including the function parameter list).
The columns of the ppu_kernel_summary_compare table are described as follows: comparison results are separated by /, and unmatched columns are indicated by -.
Row# : Row number of the compare result
Device name : PPU device name
Instances : Number of kernel calls
Percent (%) : Percentage of 'Total' time
Avg (ns) : Average execution time of this kernel
Avg ratio : Target average execution time compared to base
Total (ns) : Total time for all executions of this kernel
Total ratio : Target total execution time compared to base
Base kernel : Name of the kernel in the base report
Target kernel : Name of the kernel in the target report
Command-line usage
Use asys stats to compare two asysrep reports:
asys stats -r ppu_kernel_summary_compare base_report.asysrep target_report.asysrepTo view detailed help information, run asys stats --help-report ppu_kernel_summary_compare. The following options are supported:
hgtx-name: Prefixes the kernel name with the name of the HGTX range closest to the kernel launch, separated by a
/.base: Groups and displays statistics by the short name of the kernel (function name only, without parameters).
mangled: Groups and displays statistics by the mangled name of the kernel.
device: Specifies a list of PPU device IDs to analyze. Separate multiple IDs with a
/. If not specified, the tool analyzes all PPU devices by default.
The following is an example of the report output:
Row#,Device Name,Instances,Percent (%),Avg (ns),Avg Ratio,Total (ns),Total Ratio,Base Kernel,Target Kernel,
1,"ZW-M890P / PPU-ZW810E","3781 / 4016","1.9 / 0.4","13806 / 7021",2.0,"52200644 / 28196837",1.9,"void vllm::act_and_mul_kernel<c10::BFloat16, &(c10::BFloat16 vllm::silu_kernel<c10::BFloat16>(c10::BFloat16 const&)), true>(c10::BFloat16*, c10::BFloat16 const*, int)","void vllm::act_and_mul_kernel<c10::BFloat16, &(c10::BFloat16 vllm::silu_kernel<c10::BFloat16>(c10::BFloat16 const&)), true>(c10::BFloat16*, c10::BFloat16 const*, int)",
2,"ZW-M890P / PPU-ZW810E","78 / 83","1.2 / 0.3","425945 / 276146",1.5,"33223717 / 22920188",1.4,"void at::native::(anonymous namespace)::cunn_SoftMaxForward<4, float, float, float, at::native::(anonymous namespace)::SoftMaxForwardEpilogue>(float*, float const*, int)","void at::native::(anonymous namespace)::cunn_SoftMaxForward<4, float, float, float, at::native::(anonymous namespace)::SoftMaxForwardEpilogue>(float*, float const*, int)",
...
GUI guide
Settings
Kernel name mode: The display mode for the kernel name. The following modes are available:
Base: Shows the short name of the kernel (function name only, without parameters).
Mangled: Shows the mangled name of the kernel.
Demangled: Shows the demangled name of the kernel (default).
PPU devices: Filters the results by PPU device. By default, "All" is selected, including data from all PPU devices. This field cannot be empty.
Show top N results: Displays the top N results. The default is -1, which means there is no limit. For a report comparison, the tool shows the top N results from each report.
Add HGTX name as a prefix: When enabled, prefixes the kernel name with the name of the HGTX range closest to the kernel launch, separated by a
/. This is disabled by default.Show matched kernels only: When enabled, this option hides all rows that contain an invalid result (
-). This is disabled by default.
HGTX-to-PPU projection summary comparison
Compares the HGTX-to-PPU projection summary results from two asysrep reports. This rule matches HGTX ranges and compares the execution time differences of their PPU-side projections.
Required asys collection options:
--trace hgtx,hggc
How it works
For each asysrep report, this rule calculates the HGTX to PPU projection summary. The tool correlates an HGTX range with a PPU activity based on the following principles:
The CPU-side HGTX range covers the HGGC API associated with the PPU activity.
The CPU-side HGTX range covers the creation API of the HGGC graph node that contains the PPU activity.
The PPU-side projection time of an HGTX range spans from the start of the earliest correlated PPU activity to the end of the latest correlated PPU activity.
The tool calculates the total PPU-side active time for an HGTX range, Proj Active Time, by counting any time point where one or more of its projected ranges are active. If the projections of multiple HGTX ranges overlap, the overlapping duration is counted only once.
The tool calculates the PPU-side utilization of an HGTX range projection, In-Use, as Proj Active Time / PPU-side statistical time range. The range-mode option determines the PPU-side statistical time range.
For each asysrep report, aggregate the projection time information on the PPU side by HGTX range. Match the projection information from the aggregated results of two asysrep reports based on the HGTX range, and sort the results in descending order by the In-Use value of each report.
The columns of the hgtx_ppu_projection_summary_compare table are described as follows: comparison results are separated by /, and unmatched columns are indicated by -:
Row# : Row number of the compare result
Device name : PPU Device name
In-use (%) : Percentage of projected active time to time range
Range instance : Number of instances of this range
Proj avg (ns) : Average projected time for this range
Proj avg ratio : Target average projected time compared to base
Proj active time (ns) : Total projected time excluding overlapping for this range name
Proj active ratio : Target total projected time excluding overlapping compared to base
Total proj time (ns) : Total projected time used by all instances of this range name
Total proj ratio : Target total projected time compared to base
Total range time (ns) : Total original HGTX range time used by all instances of this range name
Total range ratio : Target total original HGTX range time compared to base
Base range : Name of the HGTX range in the base report
Target range : Name of the HGTX range in the target report
Command-line usage
Use asys stats to compare two asysrep reports:
asys stats -r hgtx_ppu_projection_summary_compare base_report.asysrep target_report.asysrepTo view detailed help information, run asys stats --help-report hgtx_ppu_projection_summary_compare. The following options are supported:
device=<device_list>: Specifies a list of PPU device IDs to analyze. Separate multiple IDs with a/. If not specified, all PPU devices are analyzed by default.range-mode=<mode>: The mode for selecting the PPU-side statistical time range. Supported modes areactiveandfull.active: The default mode. The time range is from the first PPU activity to the last PPU activity.
full: The time range is the user-specified statistical time range. If no time range is specified, it uses the time range of the entire report.
range-include=<regex_list>: Specifies an allowlist of regular expressions to filter HGTX ranges for analysis. Separate multiple regular expressions with a/. If not specified, the tool analyzes all HGTX ranges.range-exclude=<regex_list>: Specifies a denylist of regular expressions to filter HGTX ranges for analysis. Separate multiple regular expressions with a/. If not specified, the tool analyzes all HGTX ranges.no-graph-mapping: Excludes HGTX range information that is mapped through HGGC graph nodes from the output.
The following is an example of the report output:
Row#,Device Name,In-Use (%),Range Instance,Proj Avg (ns),Proj Avg Ratio,Proj Active Time (ns),Proj Active Ratio,Total Proj Time (ns),Total Proj Ratio,Total Range Time (ns),Total Range Ratio,Base Range,Target Range,
1,"PPU-ZW810 / PPU-ZW610","24.7 / 19.4","1 / 1","107599873 / 61168391",0.6,"107599873 / 61168391",0.6,"107599873 / 61168391",0.6,"108253331 / 62298650",0.6,"[prof_range]: iter 7","[prof_range]: iter 7",
2,"PPU-ZW810 / PPU-ZW610","3.0 / 4.6","4 / 5","3307076 / 2890162",0.9,"13228306 / 14450814",1.1,"13228306 / 14450814",1.1,"4966272 / 1315786",0.3,"DALI:[DALI][Executor] RunMixed","DALI:[DALI][Executor] RunMixed",
...
GUI guide
Settings
PPU devices: Filters the results by PPU device. By default, "All" is selected, including data from all PPU devices. This field cannot be empty.
Time range mode: Sets the mode for the statistical time range:
PPU active time range: The default mode. The time range is from the first PPU activity to the last PPU activity.Filtered time range: The time range is the user-specified statistical time range. If no time range is specified, it uses the time range of the entire report.
HGTX graph node mapping: Determines whether to project HGTX ranges from the HGGC graph capture phase to the PPU side. The mapping is established through HGGC graph nodes created within the HGTX range. The default value is "Yes."
Range name filter: Filters HGTX range names in the results using a Perl-compatible regular expression. By default, the tool displays all HGTX ranges. The tool validates the regular expression syntax as you type. If the syntax is incorrect, the tool displays an error message, and the settings cannot be saved.
Show matched only: When enabled, this option hides all rows that contain an invalid result (
-). This is disabled by default.
PPU operator summary comparison
Compares the PPU operator summary results from two asysrep reports by matching operators and comparing their execution time differences.
Required asys collection options:
--trace hggc,hgtx
Tips: Before collecting an asysrep report, enable HGTX range annotation for PPU operators:
Run
export PPU_LIB_PERF_INSTRUMENT=1to set the environment variable, which enables HGTX range annotation for base framework PPU operators.Add the
--pytorch autograd-shapes-hgtxoption to theasyscommand to enable HGTX range annotation for PyTorch operators.
How it works
For each asysrep report, the tool calculates a PPU operator summary by aggregating the execution times of PPU operators. The tool determines an operator's execution time as follows:
The PPU-side execution time of an operator is the duration from the start of its first correlated PPU activity to the end of its last correlated PPU activity.
The tool calculates the PPU Active Time for a PPU operator as follows:
The tool counts a time point as active time if one or more PPU activities correlated with the PPU operator exist at that moment. If multiple PPU activities overlap, the overlapping duration is counted only once.
When summarizing PPU operator information, the tool merges operators that have mostly identical parameters by default. It ignores minor parameter differences that have a negligible impact on performance.
This rule matches the operator summary results from the two asysrep reports by PPU operator type and parameters, and sorts the output in descending order of the operator's time percentage in each report.
The columns in the ppu_operator_summary_compare table are described as follows: comparison results are separated by /, and unmatched columns are indicated by -:
Row# : Row number of the compare result
Device name : PPU device name
OP type : PPU operator type
Percent (%) : Percentage of 'Total Time'
Instances : Number of this PPU operator
Avg (ns) : Average execution time of this operator's kernels
Avg ratio : Target average time compared to base
Total (ns) : Total time used by all kernel instances of this operator
Total ratio : Target total time compared to base
Active (ns) : Total PPU active time excluding overlapping for this operator
Active ratio : Target active time compared to base
Compute util (%) : Utilization ratio of PPU compute capability
HBM load util (%) : Utilization ratio of PPU HBM load bandwidth
HBM store util (%) : Utilization ratio of PPU HBM store bandwidth
Base OP name : Name of the PPU operator in the base report
Target OP name : Name of the PPU operator in the target report
Command-line usage
Use asys stats to compare two asysrep reports:
asys stats -r ppu_operator_summary_compare base_report.asysrep target_report.asysrepTo view detailed help information, run asys stats --help-report ppu_operator_summary_compare. The following options are supported:
top=<limit>: Compares only the top N operators by time percentage from each report.
device=<device_list>: Specifies a list of PPU device IDs to analyze. Separate multiple IDs with a
/. If not specified, all PPU devices are analyzed by default.range-include=<regex_list>: Specifies an allowlist of regular expressions to filter HGTX ranges for analysis. Separate multiple regular expressions with a
/. If not specified, the tool analyzes all HGTX ranges.range-exclude=<regex_list>: Specifies a denylist of regular expressions to filter HGTX ranges for analysis. Separate multiple regular expressions with a
/. If not specified, the tool analyzes all HGTX ranges.op=<operator_filter>: Specifies a list of PPU operator types to analyze. Separate multiple types with a
/. If not specified, all supported PPU operator types are analyzed by default. If you specify theotherstype, the tool also includes kernels not correlated with any PPU operator in the results.order-by=<order_type>: Specifies the sort order for the output. By default, the results are sorted by the operator's time percentage.
no-graph-mapping: If specified, HGTX ranges from the HGGC graph creation phase are not mapped to the HGGC graph execution phase.
no-merge-flash-attention-prefill-decode-operator: If specified, the tool does not match and merge prefill and decode flash attention operators.
no-merge-flash-attention-parameter: If specified, the tool does not ignore minor parameter differences for flash attention operators.
no-merge-communication-parameter: If specified, the tool does not ignore minor parameter differences for communication operators.
no-merge-moe-parameter: If specified, the tool does not ignore minor parameter differences for MoE operators.
no-merge-pytorch-parameter: If specified, the tool does not ignore minor parameter differences for PyTorch operators.
no-merge-gemm-parameter: If specified, the tool does not ignore minor parameter differences for GEMM operators.
Use the --ppu-op-config option to customize operator identification rules. This option allows you to specify a regular expression to identify a specific operator type by matching an HGTX range name or a kernel name. The format is operator type=match type:filter rule. To create multiple rules, specify the --ppu-op-config option multiple times. For example:
--ppu-op-config GEMM=kernel:gemv --ppu-op-config Pytorch=hgtx:aten--ppu-op-config GEMM=kernel:gemv: Matches kernels whose kernel name contains the keywordgemvand classifies them as theGEMMoperator type.--ppu-op-config Pytorch=hgtx:aten: Matches HGTX ranges whose names contain the keywordatenand classifies the associated PPU operations as thePytorchoperator type.
The following is an example of the report output:
Row#,Device Name,OP Type,Percent (%),Instances,Avg (ns),Avg Ratio,Total (ns),Total Ratio,Active (ns),Active Ratio,Compute Util (%),HBM Load Util (%),HBM Store Util (%),Base OP Name,Target OP Name,
1,"ZW-M890P / PPU-ZW810E","GEMM","2.1 / 0.5","3396 / 3632","17988 / 9057",2.0,"61089747 / 32897426",1.9,"60114246 / 32328985",1.9,"1.3 / 8.0","2.7 / 5.2","0.0 / 0.0","ACBLAS:GemmEx,t,n,128,192,2048,2048,2048,128,1,0,1,DEFAULT,BF16,ACBLAS_GEMM_DEFAULT_TENSOR_OP,32F,EPILOGUE_DEFAULT","ACBLAS:GemmEx,t,n,128,192,2048,2048,2048,128,1,0,1,DEFAULT,BF16,ACBLAS_GEMM_DEFAULT_TENSOR_OP,32F,EPILOGUE_DEFAULT",
2,"ZW-M890P / PPU-ZW810E","PCCL","1.1 / 0.3","194 / 194","160435 / 109407",1.5,"31124497 / 21225020",1.5,"31124497 / 21225020",1.5,"- / -","- / -","- / -","AllReduce, p:0, c:2347008, d:9, r:1, w:2, h:7dda1c67c65a5e44, t:1, b:0x469000000/0x46947a000","AllReduce, p:0, c:2347008, d:9, r:1, w:2, h:b2268f5abee7947e, t:1, b:0x497800000/0x497c7a000",
...
GUI guide
Settings
PPU devices: Filters the results by PPU device. By default, "All" is selected, including data from all PPU devices. This field cannot be empty.
Merge operator parameters: Ignores minor parameter differences that have a negligible impact on operator performance and merges them for statistical analysis. This is enabled for all operator types by default.
HGTX graph node mapping: Determines whether to project HGTX ranges from the HGGC graph capture phase to the PPU side. The mapping is established through HGGC graph nodes created within the HGTX range. The default value is "Yes."
Range name filter: Filters HGTX range names in the results using a Perl-compatible regular expression. By default, the tool displays all HGTX ranges. The tool validates the regular expression syntax as you type. If the syntax is incorrect, the tool displays an error message, and the settings cannot be saved.
Show top N results: Displays the top N results. The default is -1, which means there is no limit. For a report comparison, the tool shows the top N results from each report.
Parse from: Selects the sources for parsing operators. All PPU activities are parsed only from the enabled sources. If an activity is successfully parsed, it is included in the operator statistics. The default is "ALL," which parses PPU activities from all supported sources. This field cannot be empty.
Show matched only: When enabled, this option hides all rows that contain an invalid result (
-). This is disabled by default.Custom operator parse config: Defines custom operator parsing rules. When enabled, you can add rules to parse custom operator types by matching kernel or HGTX names with regular expressions. These custom rules have a higher priority than the "Parse from" option. This is empty by default.
PPU operator type summary comparison
Compares the PPU operator type summary results from two asysrep reports. It matches and compares the differences in execution time for each PPU operator type.
Required asys collection options:
--trace hggc,hgtx
Tips: Before collecting an asysrep report, enable HGTX range annotation for PPU operators:
Run
export PPU_LIB_PERF_INSTRUMENT=1to set the environment variable, which enables HGTX range annotation for base framework PPU operators.Add the
--pytorch autograd-shapes-hgtxoption to theasyscommand to enable HGTX range annotation for PyTorch operators.
How it works
For each asysrep report, the tool calculates a PPU operator type summary by aggregating the execution times of PPU operators. The tool determines an operator's execution time as follows:
The PPU-side execution time of an operator is the duration from the start of its first correlated PPU activity to the end of its last correlated PPU activity.
The tool calculates the PPU Active Time for a PPU operator as follows:
The tool counts a time point as active time if one or more PPU activities correlated with the PPU operator exist at that moment. If multiple PPU activities overlap, the overlapping duration is counted only once.
This rule matches the operator type summary results from the two asysrep reports by PPU operator type and sorts the output in descending order of each type's time percentage. A Summary row is always generated to compare the aggregated execution time and hotspot operators for all PPU operator types across both reports.
The columns of the ppu_operator_type_summary_compare table are described as follows: comparison results are separated by /, and unmatched columns are indicated by -.
Row# : Row number of the compare result
Device name : PPU Device name
OP type : PPU operator type
Percent (%) : Percentage of 'Total Time'
Instances : Number of this PPU operator
Avg (ns) : Average duration of this operator type
Avg ratio : Target average duration compared to base
Total (ns) : Total duration used by all instances of this operator type
Total ratio : Target total time compared to base
PPU active time (ns) : Total PPU active time excluding overlapping for this operator type
Active time ratio : Target PPU active time compared to base
Top OP percent (%) : Percentage of the top PPU operator's 'Total Time'
Base top OP name : Name of the top PPU operator of this type in the base report
Target top OP name : Name of the top PPU operator of this type in the target report
Command-line usage
Use asys stats to compare two asysrep reports:
asys stats -r ppu_operator_type_summary_compare base_report.asysrep target_report.asysrepTo view detailed help information, run asys stats --help-report ppu_operator_type_summary_compare. The following options are supported:
device=<device_list>: Specifies a list of PPU device IDs to analyze. Separate multiple IDs with a
/. If not specified, all PPU devices are analyzed by default.range-include=<regex_list>: Specifies an allowlist of regular expressions to filter HGTX ranges for analysis. Separate multiple regular expressions with a
/. If not specified, the tool analyzes all HGTX ranges.range-exclude=<regex_list>: Specifies a denylist of regular expressions to filter HGTX ranges for analysis. Separate multiple regular expressions with a
/. If not specified, the tool analyzes all HGTX ranges.op=<operator_filter>: Specifies a list of PPU operator types to analyze. Separate multiple types with a
/. If not specified, all supported PPU operator types are analyzed by default. If you specify theotherstype, the tool also includes kernels not correlated with any PPU operator in the results.no-graph-mapping: If specified, HGTX ranges from the HGGC graph creation phase are not mapped to the HGGC graph execution phase.
no-merge-flash-attention-prefill-decode-operator: If specified, the tool does not match and merge prefill and decode flash attention operators.
no-merge-flash-attention-parameter: If specified, the tool does not ignore minor parameter differences for flash attention operators.
no-merge-communication-parameter: If specified, the tool does not ignore minor parameter differences for communication operators.
no-merge-moe-parameter: If specified, the tool does not ignore minor parameter differences for MoE operators.
no-merge-pytorch-parameter: If specified, the tool does not ignore minor parameter differences for PyTorch operators.
no-merge-gemm-parameter: If specified, the tool does not ignore minor parameter differences for GEMM operators.
You can use the --ppu-op-config option to customize operator identification rules. You can specify a regular expression to match an HGTX range name or a kernel name to identify a specific operator type. The format is operator type=match type:filter rule. You can use the --ppu-op-config option multiple times to create multiple rules. For example:
--ppu-op-config GEMM=kernel:gemv --ppu-op-config Pytorch=hgtx:aten--ppu-op-config GEMM=kernel:gemv: Matches kernels whose names contain the keywordgemvand categorizes them as theGEMMoperator type.--ppu-op-config Pytorch=hgtx:aten: Matches HGTX ranges whose names contain the keywordatenand categorizes the associated PPU activities as thePytorchoperator type.
The following is an example of the report output:
Row#,Device Name,OP Type,Percent (%),Instances,Avg (ns),Avg Ratio,Total (ns),Total Ratio,PPU Active Time (ns),Active Time Ratio,Top OP Percent (%),Base Top OP Name,Target Top OP Name,
1,"ZW-M890P / PPU-ZW810E","Summary","100.0 / 100.0","84653 / 106815","33908 / 67216",2.0,"2870439050 / 7179687391",2.5,"2802370718 / 7178423429",2.6,"29.6 / 47.3","MoE:M_192_E128_H2048_In768_topk8","void marlin_moe_wna16::Marlin<__nv_bfloat16, 2814749767172868l, 1125899906909960l, 256, 1, 8, 8, false, 4, 8, false>(int4 const*, int4 const*, int4*, int4*, int4 const*, int4 const*, unsigned short const*, int4 const*, int const*, int const*, int const*, int const*, float const*, int, bool, bool, int, int, int, int, int*, bool, bool, bool, int)",
2,"ZW-M890P / PPU-ZW810E","MoE","41.6 / 65.8","7559 / 20081","157975 / 235204",1.5,"1194135831 / 4723135684",4.0,"1128253823 / 4723135684",4.2,"29.6 / 47.3","MoE:M_192_E128_H2048_In768_topk8","void marlin_moe_wna16::Marlin<__nv_bfloat16, 2814749767172868l, 1125899906909960l, 256, 1, 8, 8, false, 4, 8, false>(int4 const*, int4 const*, int4*, int4*, int4 const*, int4 const*, unsigned short const*, int4 const*, int const*, int const*, int const*, int const*, float const*, int, bool, bool, int, int, int, int, int*, bool, bool, bool, int)",
...
GUI guide
Settings
PPU devices: Filters the results by PPU device. By default, "All" is selected, including data from all PPU devices. This field cannot be empty.
Merge operator parameters: Ignores minor parameter differences that have a negligible impact on operator performance and merges them for statistical analysis. This is enabled for all operator types by default.
Range name filter: Filters HGTX range names in the results using a Perl-compatible regular expression. By default, the tool displays all HGTX ranges. The tool validates the regular expression syntax as you type. If the syntax is incorrect, the tool displays an error message, and the settings cannot be saved.
Parse from: Selects the sources for parsing operators. All PPU activities are parsed only from the enabled sources. If an activity is successfully parsed, it is included in the operator statistics. The default is "ALL," which parses PPU activities from all supported sources. This field cannot be empty.
Show matched only: When enabled, this option hides all rows that contain an invalid result (
-). This is disabled by default.Custom operator parse config: Defines custom operator parsing rules. When enabled, you can add rules to parse custom operator types by matching kernel or HGTX names with regular expressions. These custom rules have a higher priority than the "Parse from" option. This is empty by default.
PCCL desynchronization summary comparison
Compares the PCCL desynchronization summary results from two asysrep reports. This rule matches and compares the desynchronization rates of PCCL kernel communication groups between the reports.
Required asys collection option:
--trace hggc
How it works
For each asysrep report, this rule calculates a PCCL desynchronization summary. It groups PCCL kernels with overlapping execution times into a communication group and calculates the following times for each group:
Overlap Duration: The duration in which all PCCL kernels in the communication group are executing simultaneously.Duration: The time from when the first kernel in the communication group starts to when the last kernel in the group finishes.
The desynchronization rate is calculated as: (Duration - Overlap Duration) / Duration.
The Desync P90 column is calculated by sorting the results for communication groups with the same kernel name by their desynchronization rate in ascending order and then taking the 90th percentile value. This value indicates that 90% of PCCL communications have a desynchronization rate less than or equal to this value.
This rule matches the summary results from the two asysrep reports by kernel name and sorts the output in descending order of the communication group's time percentage in each report.
The pccl_desync_summary_compare table uses the following column format, where comparison results are separated by / and unmatched columns are indicated by -:
Row# : Row number of the compare result
Device name : PPU Device name
Time (%) : Percentage of 'Total Duration'
Count : Number of communications of this PCCL kernel
Desync P90 (%) : 90th percentile desynchronization rate of this PCCL kernel
Desync avg (%) : Average desynchronization rate of this PCCL kernel
Total duration (ns) : Total elapsed duration of all communications of this PCCL kernel
Total overlap (ns) : Total overlap duration of all communications of this PCCL kernel
Base kernel : Name of the kernel in the base report
Target kernel : Name of the kernel in the target report
Command-line usage
Use asys stats to compare two asysrep reports:
asys stats -r pccl_desync_summary_compare base_report.asysrep target_report.asysrepTo view detailed help information, run asys stats --help-report pccl_desync_summary_compare. The following options are supported:
hgtx-name: Prefixes the kernel name with the name of the HGTX range closest to the kernel launch, separated by a
/.base: Groups and displays statistics by the short name of the kernel (function name only, without parameters).
mangled: Groups and displays statistics by the mangled name of the kernel.
device: Specifies a list of PPU device IDs to analyze. Separate multiple IDs with a
/. If not specified, all PPU devices are analyzed by default.
The following is an example of the report output:
Row#,Device Name,Time (%),Count,Desync P90 (%),Desync Avg (%),Total Duration (ns),Total Overlap (ns),Base Kernel,Target Kernel,
1,"ZW-M890P / PPU-ZW810E","48.5 / 59.3","3294 / 3592","30.4 / 42.1","14.0 / 21.8","79985018 / 83745513","65187134 / 57385652","void pcclKernel_oneShotAllReduceKernel<__ppu_bfloat16, 2, 0, 1, 1>(oneShotDevParams)","void pcclKernel_oneShotAllReduceKernel<__ppu_bfloat16, 2, 0, 1, 1>(oneShotDevParams)",
2,"ZW-M890P / PPU-ZW810E","42.0 / 29.0","381 / 388","75.0 / 30.5","48.1 / 15.7","69295561 / 40951632","30304259 / 27014248","void pcclKernel_twoShotAllReduceKernel<__ppu_bfloat16, 2, 0, 0, 1, 1>(twoShotDevParams)","void pcclKernel_twoShotAllReduceKernel<__ppu_bfloat16, 2, 0, 0, 1, 1>(twoShotDevParams)",
...
GUI guide
Kernel name mode: The display mode for the kernel name. The following modes are available:
Base: Shows the short name of the kernel (function name only, without parameters).
Mangled: Shows the mangled name of the kernel.
Demangled: Shows the demangled name of the kernel (default).
PPU devices: Filters the results by PPU device. The statistics are filtered based on the selected devices. The default is "All," which includes data from all PPU devices. This field cannot be empty.
Add HGTX name as a prefix: When enabled, prefixes the kernel name with the name of the HGTX range closest to the kernel launch, separated by a
/. This is disabled by default.Show matched only: When enabled, this option hides all rows that contain an invalid result (
-). This is disabled by default.
PPU time utilization comparison
Compares the PPU time utilization summary results from two asysrep reports. This rule matches and compares the differences in PPU time utilization between the two reports.
Required asys collection option:
--trace hggc
How it works
For each asysrep report, the tool calculates the PPU's time utilization by measuring the time the PPU was active within a specified time range.
Time range selection:
In "PPU Active Time Range" mode, the statistical time range spans from the first PPU activity on the device to the last.
In "Filtered Time Range" mode, the time range matches the specified filter time range.
Note that this rule measures "time" utilization, not "resource" utilization. If a PPU device has any activity at a given time, its time utilization is considered 100% for that moment. Time utilization does not exceed 100% even if multiple operations run concurrently.
For each PPU device, the time utilization is calculated as: active time / duration of the time range. The results from the two reports are matched by PPU device index and sorted in descending order of the PPU time utilization in each report.
The columns of the ppu_time_util_compare table are described as follows: comparison results are separated by /, and unmatched columns are indicated by -:
Row# : Row number of the compare result
Device name : PPU Device name
In-use (%) : Percentage of time the PPU was active
Duration (ns) : Duration of the time range
PPU active time (ns) : PPU active time excluding overlapping
Active time ratio : Target PPU active time compared to base
Base device ID : PPU device identifier in the base report
Target device ID : PPU device identifier in the target report
Command-line usage
Use asys stats to compare two asysrep reports:
asys stats -r ppu_time_util_compare base_report.asysrep target_report.asysrepTo view detailed help information, run asys stats --help-report ppu_time_util_compare. The following option is supported:
range-mode=<mode>: The mode for selecting the statistical time range. Supported modes areactiveandfull:active: The default mode. The time range is from the first PPU activity to the last PPU activity.full: The time range is the user-specified statistical time range. If no time range is specified, it uses the time range of the entire report.
The following is an example of the report output:
Row#,Device Name,In-Use (%),Duration (ns),PPU Active Time (ns),Base Device ID,Target Device ID,
1,"ZW-M890P / PPU-ZW810E","77.1 / 91.3","1781485096 / 3874625379","1373679518 / 3538770219",1,1,
2,"ZW-M890P / PPU-ZW810E","76.2 / 91.2","1885995849 / 4001152909","1437072950 / 3650124332",0,0,
GUI guide
Time range mode: Sets the mode for the statistical time range:
PPU active time range: The default mode. The time range is from the first PPU activity to the last PPU activity.
Filtered time range: The time range is the user-specified statistical time range. If no time range is specified, it uses the time range of the entire report.
Show matched only: When enabled, this option hides all rows that contain an invalid result (
-). This is disabled by default.
PPU operator kernel breakdown comparison
Compares the PPU operator performance breakdown results from two asysrep reports, matching and comparing differences at the kernel layer.
Required asys collection options:
--trace hggc,hgtx
Tips: Before collecting an asysrep report, enable HGTX range annotation for PPU operators:
Run
export PPU_LIB_PERF_INSTRUMENT=1to set the environment variable, which enables HGTX range annotation for base framework PPU operators.Add the
--pytorch autograd-shapes-hgtxoption to theasyscommand to enable HGTX range annotation for PyTorch operators.
How it works
For each asysrep report, this rule calculates the PPU operator kernel performance breakdown. It identifies PPU operators and, based on their type and nesting relationships, classifies them into three layers: framework layer, compute library layer, and kernel layer. This provides a detailed, layer-by-layer performance breakdown for nested operators.
A period within a parent PPU operator is marked as Idle if it does not contain any child PPU operators. This indicates that the PPU device is idle. Missing parent PPU operators at any level are marked as Native.
The tool matches the kernel-layer performance breakdown data from the two asysrep reports by using the PPU operator parameters from all three layers and compares the performance data at the kernel layer. The output is sorted in descending order of each operator's time percentage at each layer in each report.
The columns in the ppu_operator_kernel_breakdown_compare table are described as follows: comparison results are separated by /, and unmatched columns are indicated by -.
Row# : Row number of the compare result
Device name : PPU Device name
OP type : PPU operator type
Base framework OP : Name of the framework layer operator in the base report
Base framework time (%) : Framework operator time percentage of 'Total Time' in the base report
Base framework avg (ns) : Average duration of this framework operator in the base report
Base framework instances : Number of this framework operator in the base report
Base library OP : Name of the compute library layer operator in the base report
Base library time (%) : Library operator time percentage of 'Total Time' in the base report
Base library avg (ns) : Average duration of this library operator in the base report
Base library instances : Number of this library operator in the base report
Base kernel : Name of the HGGC kernel in the base report
Base kernel time (%) : HGGC kernel time percentage of 'Total Time' in the base report
Base kernel avg (ns) : Average duration of this kernel in the base report
Base kernel instances : Number of this kernel in the base report
Target framework OP : Name of the framework layer operator in the target report
Target framework time (%) : Framework operator time percentage of 'Total Time' in the target report
Target framework avg (ns) : Average duration of this framework operator in the target report
Target framework instances : Number of this framework operator in the target report
Target library OP : Name of the compute library layer operator in the target report
Target library time (%) : Library operator time percentage of 'Total Time' in the target report
Target library avg (ns) : Average duration of this library operator in the target report
Target library instances : Number of this library operator in the target report
Target kernel : Name of the HGGC kernel in the target report
Target kernel time (%) : HGGC kernel time percentage of 'Total Time' in the target report
Target kernel avg (ns) : Average duration of this kernel in the target report
Target kernel instances : Number of this kernel in the target report
Avg ratio : Target kernel average time compared to base
Command-line usage
Use asys stats to compare two asysrep reports:
asys stats -r ppu_operator_kernel_breakdown_compare base_report.asysrep target_report.asysrepTo view detailed help information, run asys stats --help-report ppu_operator_kernel_breakdown_compare. The following options are supported:
top=<limit>: Compares only the top N kernel-layer operators by time percentage from each report. Operators with a small time percentage may be omitted.
device=<device_list>: Specifies a list of PPU device IDs to analyze. Separate multiple IDs with a
/. If not specified, all PPU devices are analyzed by default.range-include=<regex_list>: Specifies an allowlist of regular expressions to filter HGTX ranges for analysis. Separate multiple regular expressions with a
/. If not specified, the tool analyzes all HGTX ranges.range-exclude=<regex_list>: Specifies a denylist of regular expressions to filter HGTX ranges for analysis. Separate multiple regular expressions with a
/. If not specified, the tool analyzes all HGTX ranges.base: Groups and displays statistics by the short name of the kernel (function name only, without parameters).
mangled: Groups and displays statistics by the mangled name of the kernel.
op=<operator_filter>: Specifies a list of PPU operator types to analyze. Separate multiple types with a
/. If not specified, all supported PPU operator types are analyzed by default. If you specify theotherstype, the tool also includes kernels not correlated with any PPU operator in the results.order-by=<order_type>: Specifies the sort order for the output. By default, the results are sorted by the operator's time percentage.
no-merge-flash-attention-prefill-decode-operator: If specified, the tool does not match and merge prefill and decode flash attention operators.
no-merge-flash-attention-parameter: If specified, the tool does not ignore minor parameter differences for flash attention operators.
no-merge-communication-parameter: If specified, the tool does not ignore minor parameter differences for communication operators.
no-merge-moe-parameter: If specified, the tool does not ignore minor parameter differences for MoE operators.
no-merge-pytorch-parameter: If specified, the tool does not ignore minor parameter differences for PyTorch operators.
no-merge-gemm-parameter: If specified, the tool does not ignore minor parameter differences for GEMM operators.
Use the --ppu-op-config option to define custom operator identification rules. The tool classifies custom operators matched by an HGTX range name as framework layer operators and those matched by a kernel name as kernel layer operators.
The following is an example of the report output (some columns are not shown):
Row#,Device Name,OP Type,Base Framework OP,Base Framework Time (%),Base Library OP,Base Library Time (%),Base Kernel,Base Kernel Time (%),Base Kernel Avg (ns),Base Kernel Instances,Target Framework OP,Target Framework Time (%),Target Library OP,Target Library Time (%),Target Kernel,Target Kernel Time (%),Target Kernel Avg (ns),Target Kernel Instances,Avg Ratio,
1,"PPU-ZW810E / NVIDIA H20-3e","PCCL","sglang::outplace_all_reduce, op_id = 2174848, sizes = [[948, 2048], [], []], input_op_ids = [(2174845,0), (0,-1), (0,-1)]",0.6,"Native",0.6,"void sglang::cross_device_reduce_1stage<__nv_bfloat16, 2>(sglang::RankData*, sglang::RankSignals, sglang::Signal*, __nv_bfloat16*, int, int)",0.6,201675,194,"sglang::outplace_all_reduce, op_id = 1814850, sizes = [[948, 2048], [], []], input_op_ids = [(1814847,0), (0,-1), (0,-1)]",0.9,"Native",0.8,"void sglang::cross_device_reduce_1stage<__nv_bfloat16, 2>(sglang::RankData*, sglang::RankSignals, sglang::Signal*, __nv_bfloat16*, int, int)",0.8,190988,194,0.9,
2,"PPU-ZW810E / NVIDIA H20-3e","MoE","D_MoE,M_4_E_128_H_2048_In_768_topk_8",0.4,"Native",0.1,"_fwd_kernel_ep_scatter_1",0.0,16955,288,"D_MoE,M_4_E_128_H_2048_In_768_topk_8",1.0,"Native",1.0,"-","-","-","-","-",
3,"PPU-ZW810E / NVIDIA H20-3e","MoE","D_MoE,M_4_E_128_H_2048_In_768_topk_8",0.4,"Native",0.1,"void at::native::vectorized_elementwise_kernel<4, at::native::FillFunctor<int>, std::array<char*, 1ul> >(int, at::native::FillFunctor<int>, std::array<char*, 1ul>)",0.0,16955,288,"D_MoE,M_4_E_128_H_2048_In_768_topk_8",1.0,"Native",1.0,"-","-","-","-","-",
...
Tip: Use the --format xlsx option to export the results as a spreadsheet for better readability.
PPU operator library breakdown comparison
Compares the PPU operator performance breakdown results from two asysrep reports, matching and comparing differences at the compute library layer.
Required asys collection options:
--trace hggc,hgtx
Tips: Before collecting an asysrep report, enable HGTX range annotation for PPU operators:
Run
export PPU_LIB_PERF_INSTRUMENT=1to set the environment variable, which enables HGTX range annotation for base framework PPU operators.Add the
--pytorch autograd-shapes-hgtxoption to theasyscommand to enable HGTX range annotation for PyTorch operators.
How it works
For each asysrep report, this rule calculates the PPU operator performance breakdown. It identifies PPU operators and, based on their type and nesting relationships, classifies them into three layers: framework layer, compute library layer, and kernel layer. This provides a performance breakdown and hardware utilization information at the compute library layer.
Within a parent-level PPU operator, time periods that do not contain a child-level PPU operator (when the PPU device is idle) are marked as Idle. Missing parent-level PPU operators in each level are marked as Native.
The tool matches the compute library layer performance breakdown data from the two asysrep reports using the PPU operator parameters from the framework and compute library layers, and compares the differences. The output is sorted in descending order of each operator's time percentage at each layer in each report.
The columns in the ppu_operator_breakdown_compare table are described as follows, where comparison results are separated by / and unmatched columns are represented by -:
Row# : Row number of the compare result
Device name : PPU Device name
OP type : PPU operator type
Base framework OP : Name of the framework layer operator in the base report
Base framework time (%) : Framework operator time percentage of 'Total Time' in the base report
Base framework avg (ns) : Average duration of this framework operator in the base report
Base framework instances : Number of this framework operator in the base report
Base library OP : Name of the compute library layer operator in the base report
Base library time (%) : Library operator time percentage of 'Total Time' in the base report
Base library avg (ns) : Average duration of this library operator in the base report
Base library instances : Number of this library operator in the base report
Base compute util (%) : Utilization ratio of PPU compute capability in the base report
Base HBM load util (%) : Utilization ratio of PPU HBM load bandwidth in the base report
Base HBM store util (%) : Utilization ratio of PPU HBM store bandwidth in the base report
Target framework OP : Name of the framework layer operator in the target report
Target framework time (%) : Framework operator time percentage of 'Total Time' in the target report
Target framework avg (ns) : Average duration of this framework operator in the target report
Target framework instances : Number of this framework operator in the target report
Target library OP : Name of the compute library layer operator in the target report
Target library time (%) : Library operator time percentage of 'Total Time' in the target report
Target library avg (ns) : Average duration of this library operator in the target report
Target library instances : Number of this library operator in the target report
Target compute util (%) : Utilization ratio of PPU compute capability in the target report
Target HBM load util (%) : Utilization ratio of PPU HBM load bandwidth in the target report
Target HBM store util (%) : Utilization ratio of PPU HBM store bandwidth in the target report
Avg ratio : Target average time compared to base
Command-line usage
Use asys stats to compare two asysrep reports:
asys stats -r ppu_operator_breakdown_compare base_report.asysrep target_report.asysrepTo view detailed help information, run asys stats --help-report ppu_operator_breakdown_compare. The following options are supported:
top=<limit>: Compares only the top N compute library layer operators by time percentage from each report. Operators with a small time percentage may be omitted.
device=<device_list>: Specifies a list of PPU device IDs to analyze. Separate multiple IDs with a
/. If not specified, all PPU devices are analyzed by default.range-include=<regex_list>: Specifies an allowlist of regular expressions to filter HGTX ranges for analysis. Separate multiple regular expressions with a
/. If not specified, the tool analyzes all HGTX ranges.range-exclude=<regex_list>: Specifies a denylist of regular expressions to filter HGTX ranges for analysis. Separate multiple regular expressions with a
/. If not specified, the tool analyzes all HGTX ranges.op=<operator_filter>: Specifies a list of PPU operator types to analyze. Separate multiple types with a
/. If not specified, all supported PPU operator types are analyzed by default. If you specify theotherstype, the tool also includes kernels not correlated with any PPU operator in the results.order-by=<order_type>: Specifies the sort order for the output. By default, the results are sorted by the operator's time percentage.
no-merge-flash-attention-prefill-decode-operator: If specified, the tool does not match and merge prefill and decode flash attention operators.
no-merge-flash-attention-parameter: If specified, the tool does not ignore minor parameter differences for flash attention operators.
no-merge-communication-parameter: If specified, the tool does not ignore minor parameter differences for communication operators.
no-merge-moe-parameter: If specified, the tool does not ignore minor parameter differences for MoE operators.
no-merge-pytorch-parameter: If specified, the tool does not ignore minor parameter differences for PyTorch operators.
no-merge-gemm-parameter: If specified, the tool does not ignore minor parameter differences for GEMM operators.
Use the --ppu-op-config option to define custom operator identification rules. The tool classifies custom operators matched by an HGTX range name as framework layer operators and those matched by a kernel name as kernel layer operators.
The following is an example of the report output (some columns are not shown):
Row#,Device Name,OP Type,Base Framework OP,Base Framework Time (%),Base Library OP,Base Library Time (%),Base Library Avg (ns),Base Library Instances,Base Compute Util (%),Base HBM Load Util (%),Base HBM Store Util (%),Target Framework OP,Target Framework Time (%),Target Library OP,Target Library Time (%),Target Library Avg (ns),Target Library Instances,Target Compute Util (%),Target HBM Load Util (%),Target HBM Store Util (%),Avg Ratio,
1,"PPU-ZW810E / NVIDIA H20-3e","MoE","D_MoE,M_8_E_128_H_2048_In_768_topk_8",44.3,"DeepGemm:GroupedNoPad,data_type:bf16,groups:128,m:64,n:768,k:2048,gpu:0",23.3,55495,28128,2.6,262.6,0.0,"D_MoE,M_8_E_128_H_2048_In_768_topk_8",41.9,"-","-","-","-","-","-","-","-",
2,"PPU-ZW810E / NVIDIA H20-3e","MoE","D_MoE,M_8_E_128_H_2048_In_768_topk_8",44.3,"DeepGemm:GroupedNoPad,data_type:bf16,groups:128,m:64,n:2048,k:384,gpu:0",13.0,30975,28128,2.3,235.1,0.0,"D_MoE,M_8_E_128_H_2048_In_768_topk_8",41.9,"-","-","-","-","-","-","-","-",
3,"PPU-ZW810E / NVIDIA H20-3e","MoE","D_MoE,M_8_E_128_H_2048_In_768_topk_8",44.3,"Native",7.3,2482,196896,"-","-","-","D_MoE,M_8_E_128_H_2048_In_768_topk_8",41.9,"Native",40.7,11049,165526,"-","-","-",4.5,
4,"PPU-ZW810E / NVIDIA H20-3e","MoE","D_MoE,M_8_E_128_H_2048_In_768_topk_8",44.3,"Idle",0.7,1681,28128,"-","-","-","D_MoE,M_8_E_128_H_2048_In_768_topk_8",41.9,"Idle",1.2,1992,27647,"-","-","-",1.2,
...