Data insight
Data insight generates visualized data reports from natural-language questions about the business data in your Wanxiaozhi application. Operations staff and merchants who do not have SQL skills can complete business analysis and gain insights without writing queries.
How it works
Data insight is delivered as three sub-tabs that form a single loop: you ask a question, rate the answer, and tune how the AI interprets your next question.
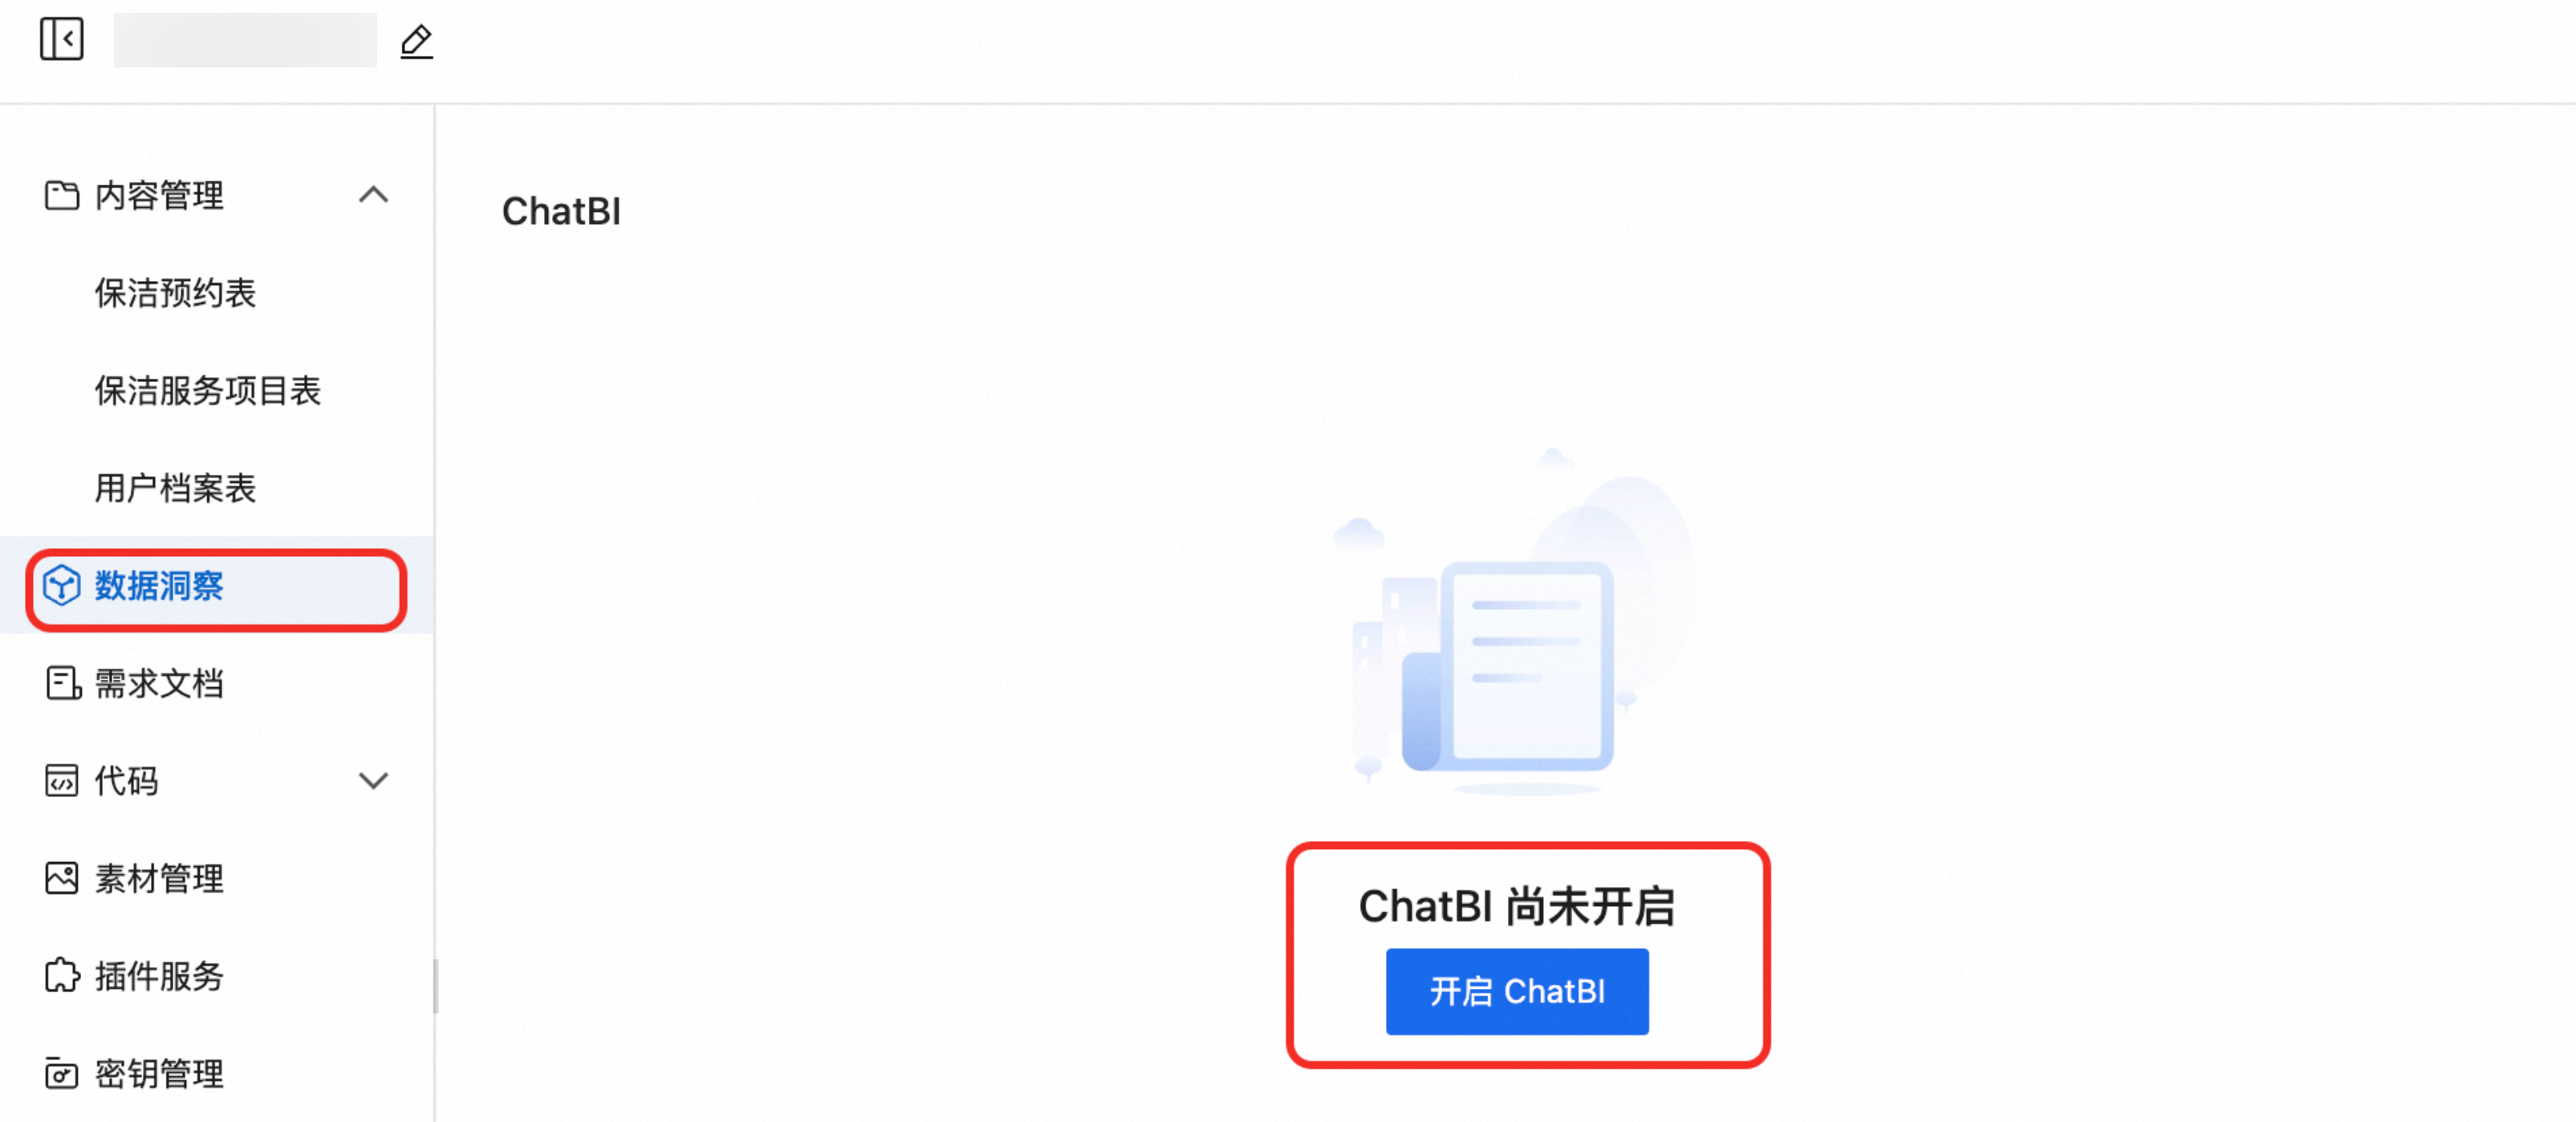
Enable ChatBI — Turn on data insight for your application once. For instructions, see Enable data insight.
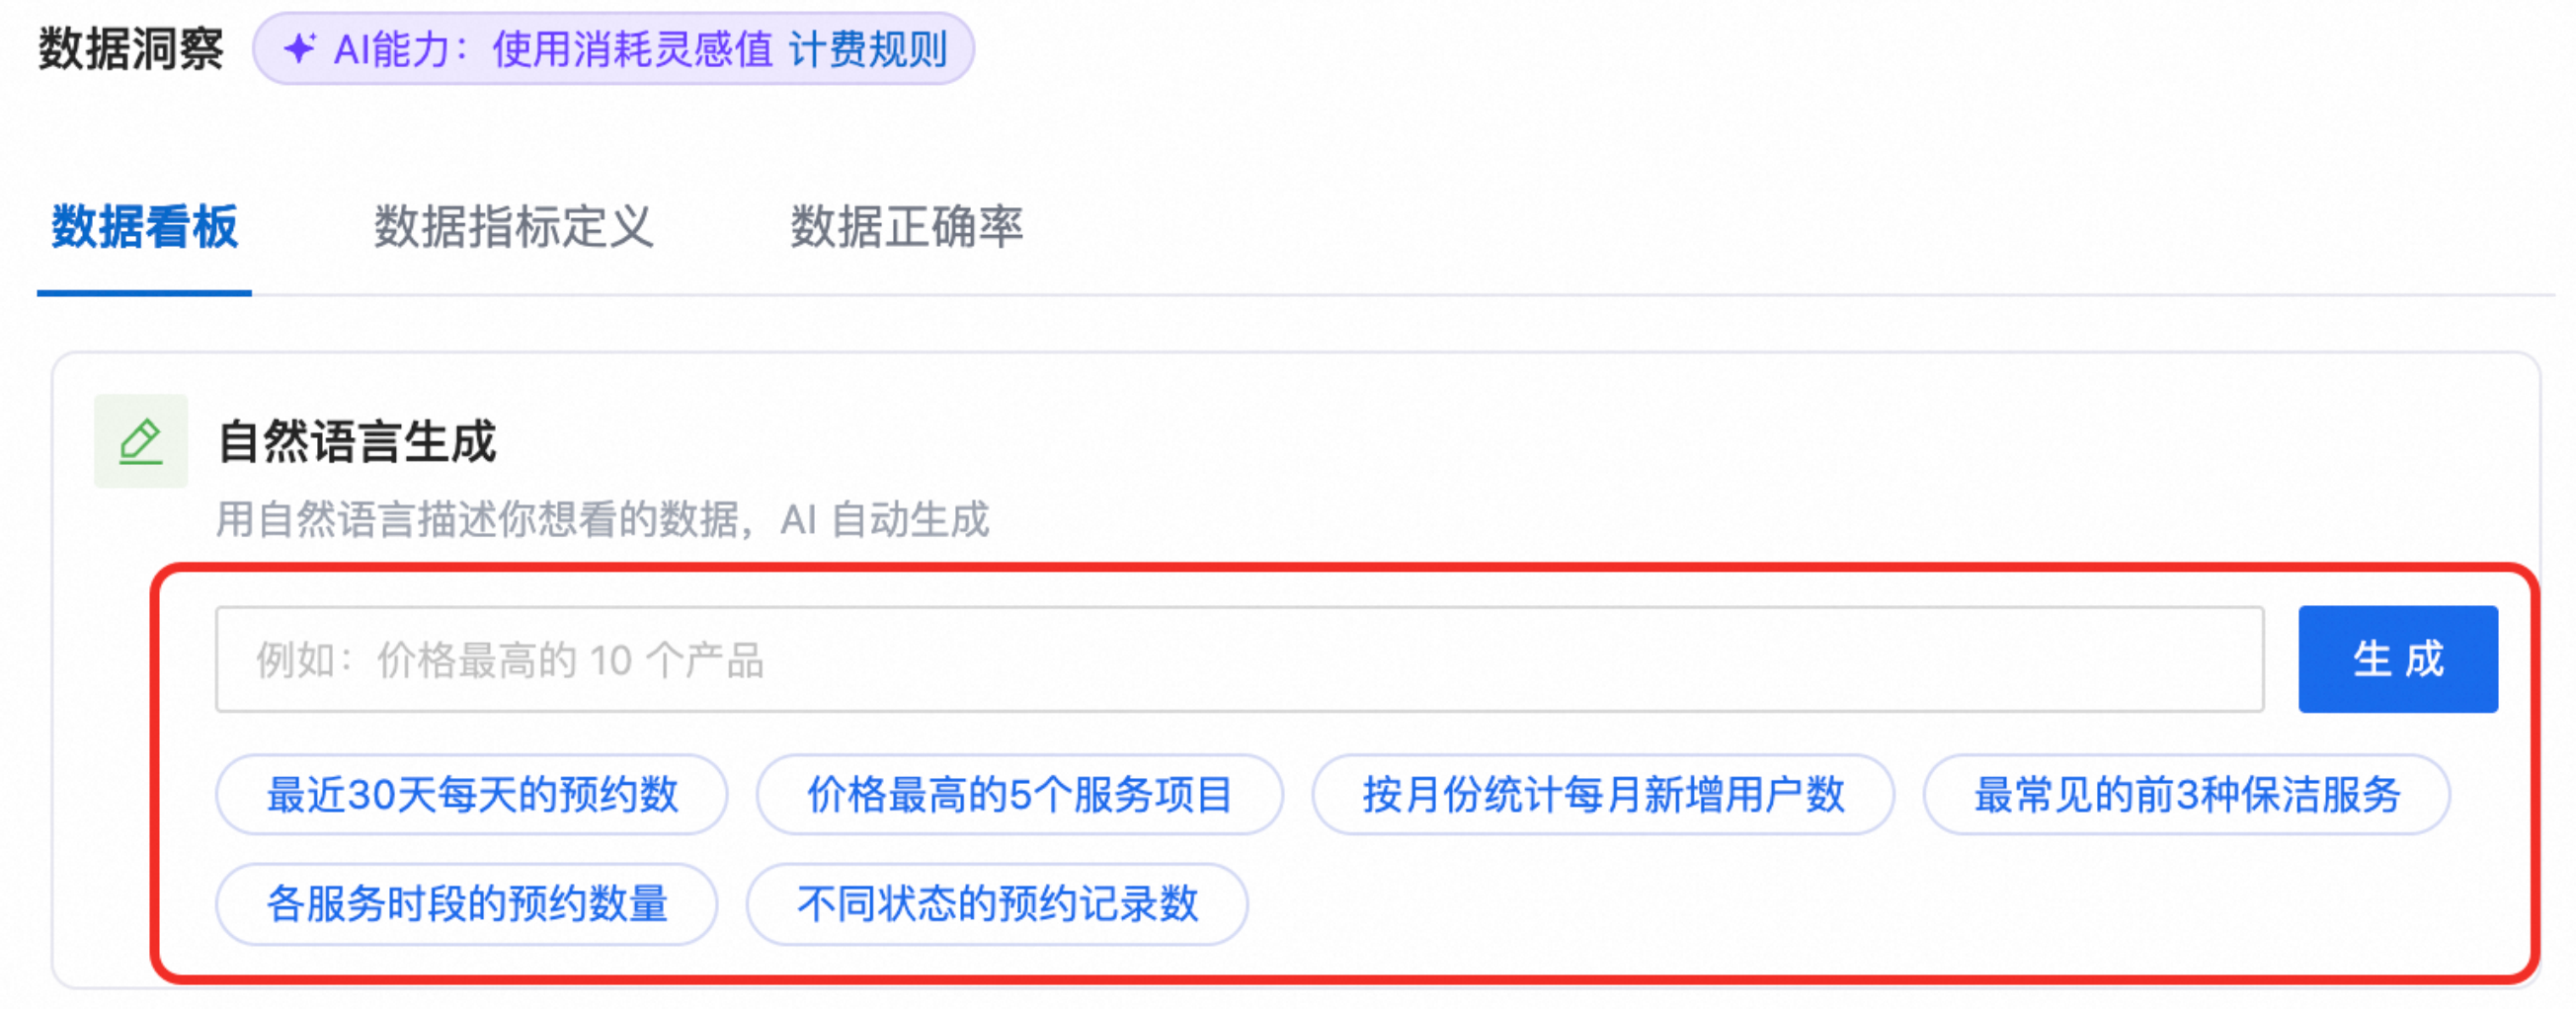
Ask a question — Describe the data you need on the Data dashboard tab, and data insight returns a visualized report. For instructions, see Generate reports on the Data dashboard tab.
Rate the answer — Mark each report as Accurate or Incorrect. Feedback is used to improve subsequent AI answers. For instructions, see Rate report accuracy.
Review the answer quality — Check the accuracy statistics and the record of each report on the Data accuracy tab. For instructions, see Track answer quality on the Data accuracy tab.
Tune the interpretation — Add term-replacement or information-supplement rules on the Metric definitions tab, and then generate the report again. For instructions, see Configure rules on the Metric definitions tab.
Billing
Using data insight consumes Inspiration Value. For billing details, see Inspiration Value.
Prerequisites
Business data already exists in Content management of your application. Data insight performs intelligent analysis and generates reports only based on your own data.
Enable data insight
Data insight is available on the Data insight page of an application after you enable ChatBI.
Log on to the Wanxiaozhi console and go to Application list.
Select your target application and click Enter application.
Click Management, and then click Data insight in the left-side navigation pane.
On the data insight settings page, click Enable ChatBI.
After ChatBI is enabled, the page contains three sub-tabs: Data dashboard, Metric definitions, and Data accuracy.
Generate reports on the Data dashboard tab
The Data dashboard tab of data insight covers report generation, quick queries, SQL viewing, and accuracy feedback. Every report is rendered as a visualization.
Generate a report
Data insight supports two ways to describe the report that you need:
Quick-query tag — (Recommended for first use) Quick-query tags are preset above the input box. Click a tag to generate a common report quickly.
Custom question — Describe your data requirement in the input box and click Generate.
Data insight automatically generates a visualized report. The report appears as a card at the bottom of the page.
Report cards
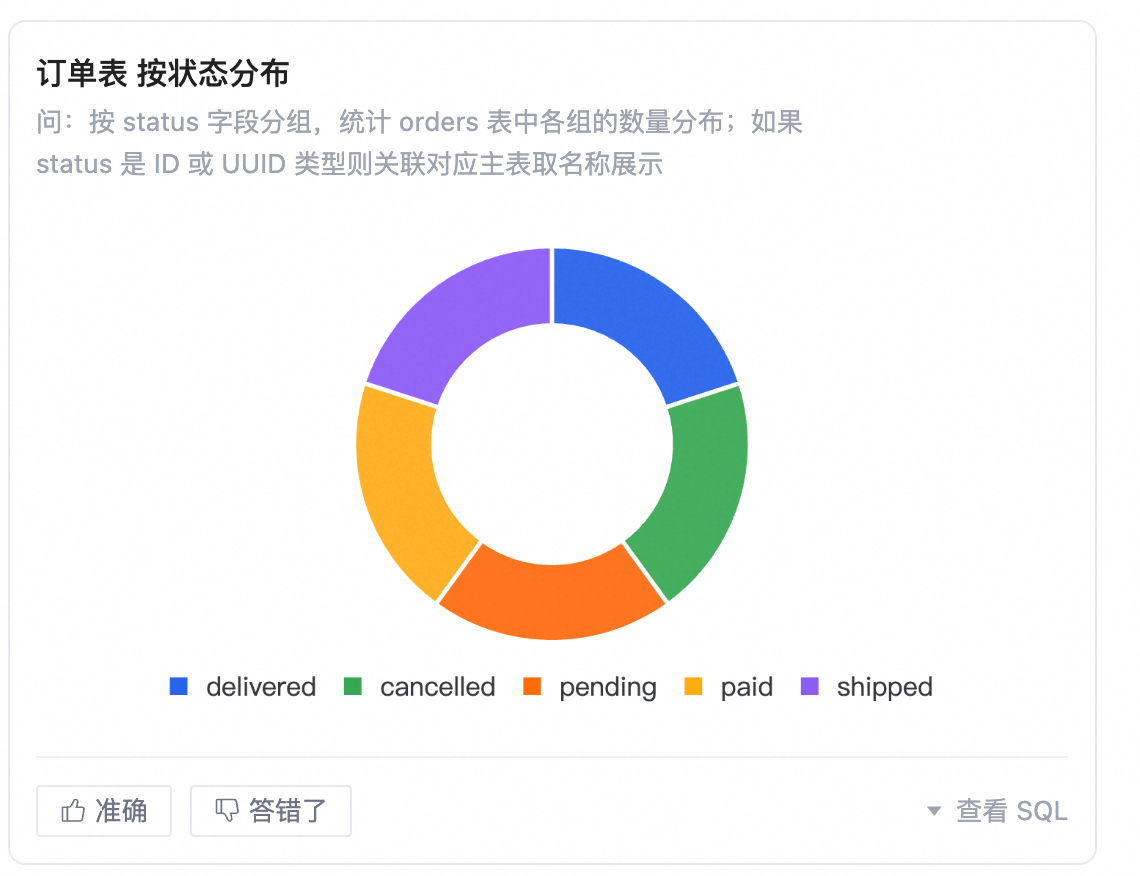
Each report card on the Data dashboard tab contains the following information:
Report title — The name of the report.
Original query description — The natural-language description that you entered to generate the report.
Chart area — Displays the data as a visualized chart.
View SQL — Click View SQL on a report card to view the SQL statement that generated the report.
Rate report accuracy
At the bottom of each report card, rate the quality of the report generated by data insight:
Click Accurate to mark the report as accurate.
Click Incorrect to mark the report as incorrect.
Feedback is used to improve subsequent AI answers. As a best practice, proofread each generated report and submit feedback on its accuracy. Your ratings are aggregated into the statistics on the Data accuracy tab.
Configure rules on the Metric definitions tab
Configure term-replacement and information-supplement rules on the Metric definitions tab to help the AI interpret your query intent more accurately when it generates reports. Choose a rule type based on what the AI misses in your question:
A term in the question must be expressed as another term before the AI processes it. Use Term replacement.
Questions that contain a term need extra information that the question itself does not carry. Use Information supplement.
Add a rule
Click + Add rule.
In the dialog box that appears, select a Type:
Term replacement — Replaces a specific term in the question. For example, replace
预约withbooking.Information supplement — Adds information to questions that contain a specific term.
Enter a Trigger word. This field is required and specifies the keyword that triggers the rule.
Enter Replace with. This field is required and specifies the content that replaces the trigger word. It appears for the Term replacement type only.
(Optional) Enter a Description of what the rule is used for.
Click Save to complete the configuration.
The rule appears in the rule list.
Edit or delete a rule
In the Actions column of the rule list, each rule provides an Edit button and a Delete button.
Click Edit to modify the configuration of an existing rule.
Click Delete to remove a rule that you no longer need.
Verify that the rule list reflects your change, and then generate the report again on the Data dashboard tab to check how the change affects the AI answer.
Track answer quality on the Data accuracy tab
The Data accuracy tab shows accuracy statistics and detailed records for the reports that data insight generates, so that you can evaluate and improve its answer quality. When the accuracy rate is lower than you expect, add rules on the Metric definitions tab and generate the report again.
Statistics panel
The statistics panel displays the AI accuracy rate for the last 7 days together with cumulative data, and contains the following metrics:
| Metric | Description |
| AI accuracy rate | The proportion of reports marked as Accurate in the last 7 days. |
| Proofread | The number of reports for which feedback has been submitted. |
| Total reports generated | The cumulative number of generated reports. |
| Correct reports | The cumulative number of reports marked as Accurate. |
| Incorrect reports | The cumulative number of reports marked as Incorrect. |
Detailed records
The detailed records table displays information about each report generated by data insight, including the report name, data source, generation time, status, and error cause.
The following filters are supported:
Status — View all reports, correct reports, or incorrect reports.
Time range — The records of the last 7 days are displayed by default.