Troubleshoot system failures
This topic describes how to troubleshoot system failures on Alibaba Cloud Elastic Compute Service (ECS) instances. It covers how to identify and resolve issues related to the abnormal usage of CPU, disk I/O, memory, disk, and bandwidth resources.
Details
Note:
Before you perform risky operations, such as modifying an instance or its data, ensure that you have a disaster recovery and fault tolerance plan in place to protect your data.
Before you change configurations or data on instances such as ECS and RDS, create snapshots or enable features such as RDS log backup.
If you have submitted security information, such as logon credentials, to the Alibaba Cloud platform, change your passwords promptly.
Choose the appropriate solution for your situation. The following steps use CentOS 7.9 as an example.
CPU load
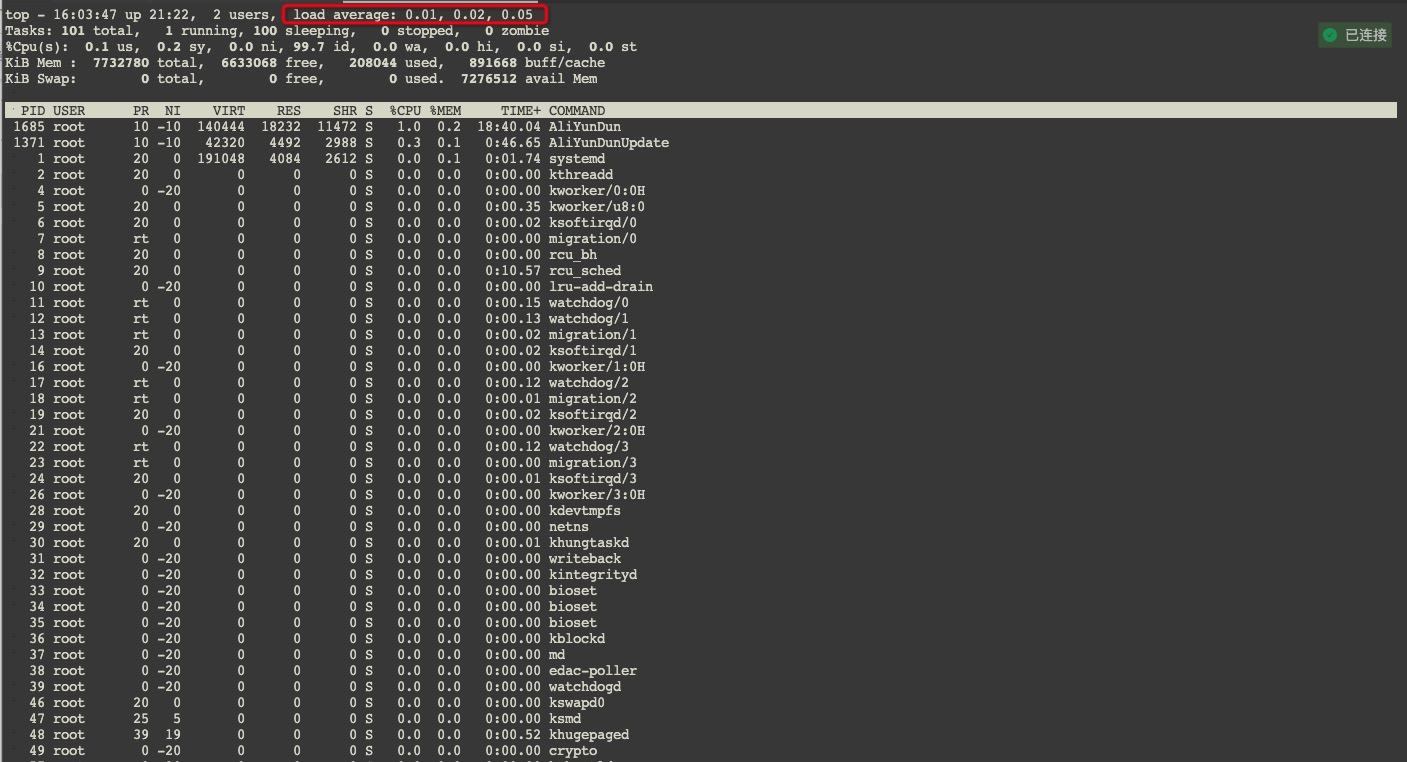
Connect to and log on to the ECS instance. Run the following command:
sudo topCheck the "load average" values. These three values represent the average system load over the last 1, 5, and 15 minutes, respectively. Generally, if a load average value divided by the number of logical CPUs is greater than 5, the system is overloaded. The exact threshold depends on your server's CPU performance and system usage. You can find the program (COMMAND) that is using the most CPU by checking the process ID (PID) that has a high "%CPU" value.
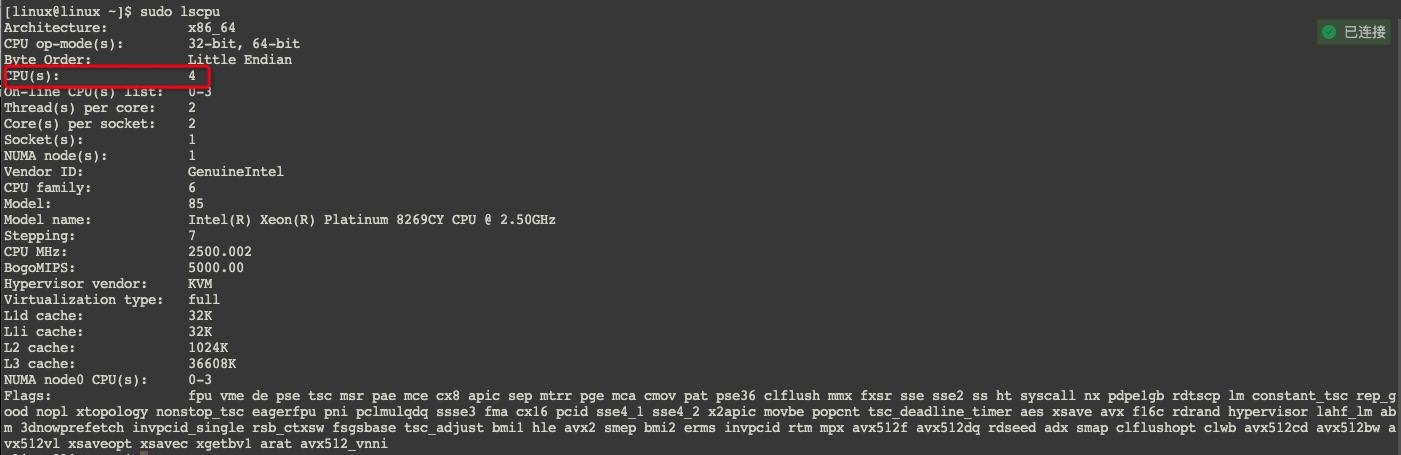
To obtain the number of logical CPUs, run the following command:
sudo lscpuThe value for "CPU(s)" is the number of logical CPUs.
Disk I/O
The `iostat` tool in Linux monitors the I/O activity of system devices. You can use the following commands to check the disk I/O status.
You can display the payload status of all devices.
sudo iostat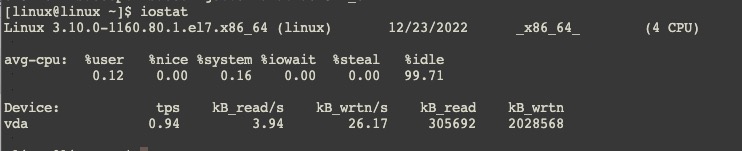
The following command displays all information in megabytes for the disk vda. The command updates every 1 second and runs 5 times.
sudo iostat -d -m vda 1 5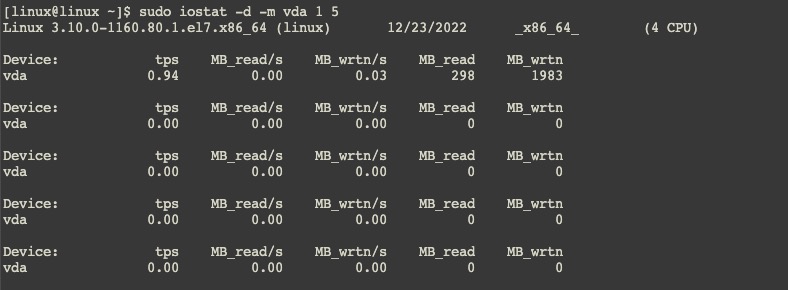
Memory
To check the current server memory usage, run the following command:
sudo free -mIn the output, `Mem` is the physical memory and `Swap` is the swap partition. `total` is the total size, `used` is the used amount, and `free` is the free amount for both physical memory and the swap partition. `shared` is the memory shared by multiple processes. `buff/cache` is the disk cache size. `available` is the memory that new applications can use. You can also check the `%MEM` column in the output of the `top` command to identify the program (COMMAND) that uses the most memory.

Disk
To check the usage of mounted disks on the current system, run the following command:
sudo df -TH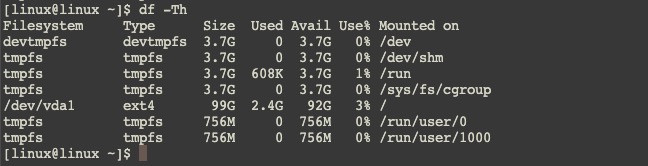
To check the inode information of the current system, run the following command:
sudo df -i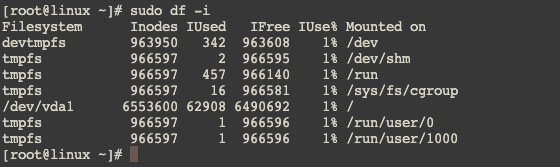
To check the size of a specific folder, run the following command:
sudo du -sh *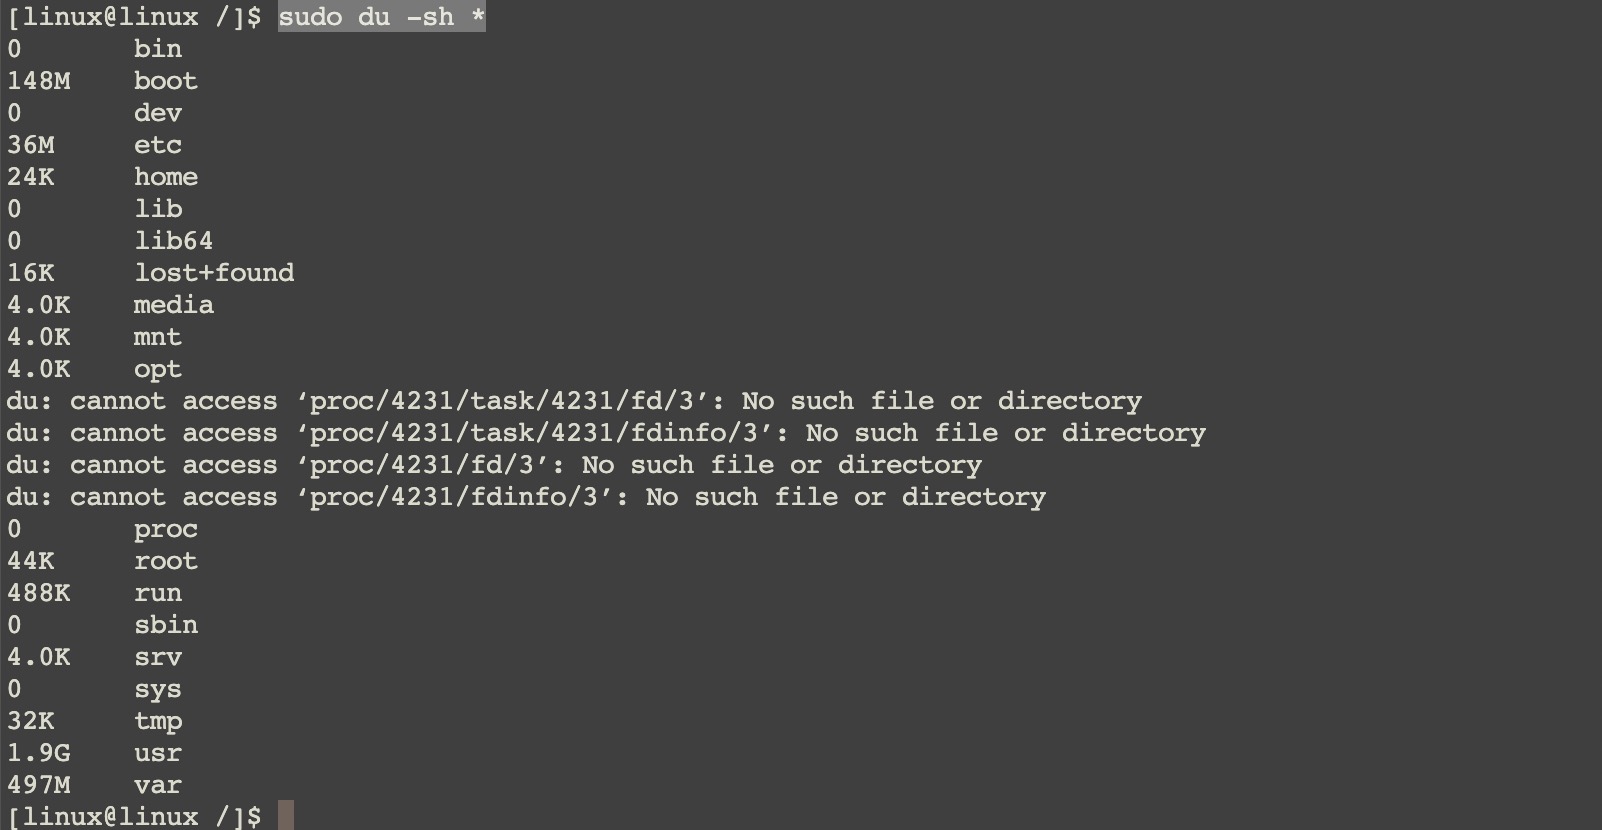
Bandwidth
`iftop` is a free real-time traffic monitoring tool for network interface controllers (NICs) in Linux. You can use it to monitor real-time traffic, port connection information, and reverse DNS lookups for a specified NIC.
`iftop` is not pre-installed on the system. If the `iftop` command is not available, you can use one of the following commands to install it:
For CentOS:
sudo yum install iftopFor Ubuntu:
sudo apt install iftopThe following example shows how to use the `iftop` command to find the IP address and port that consume the most traffic.
You can specify the local eth0 network interface controller (NIC).
sudo iftop -i eth0 -nNB -m 100M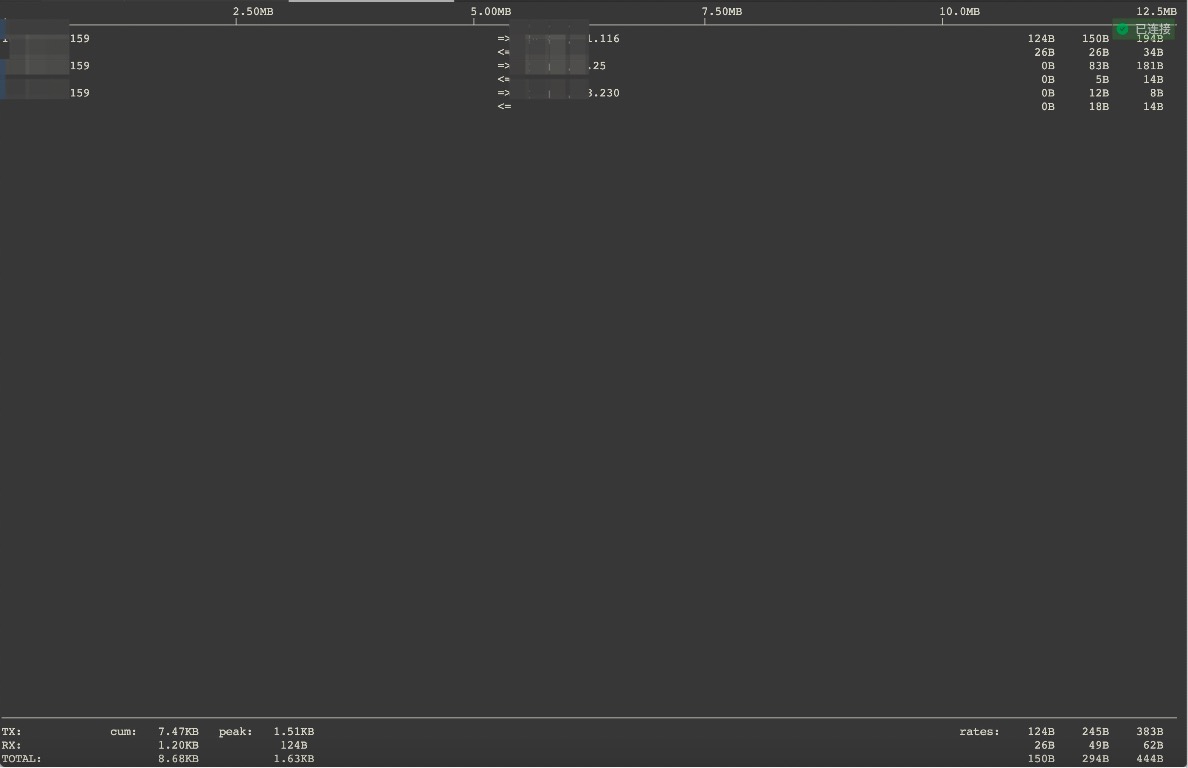
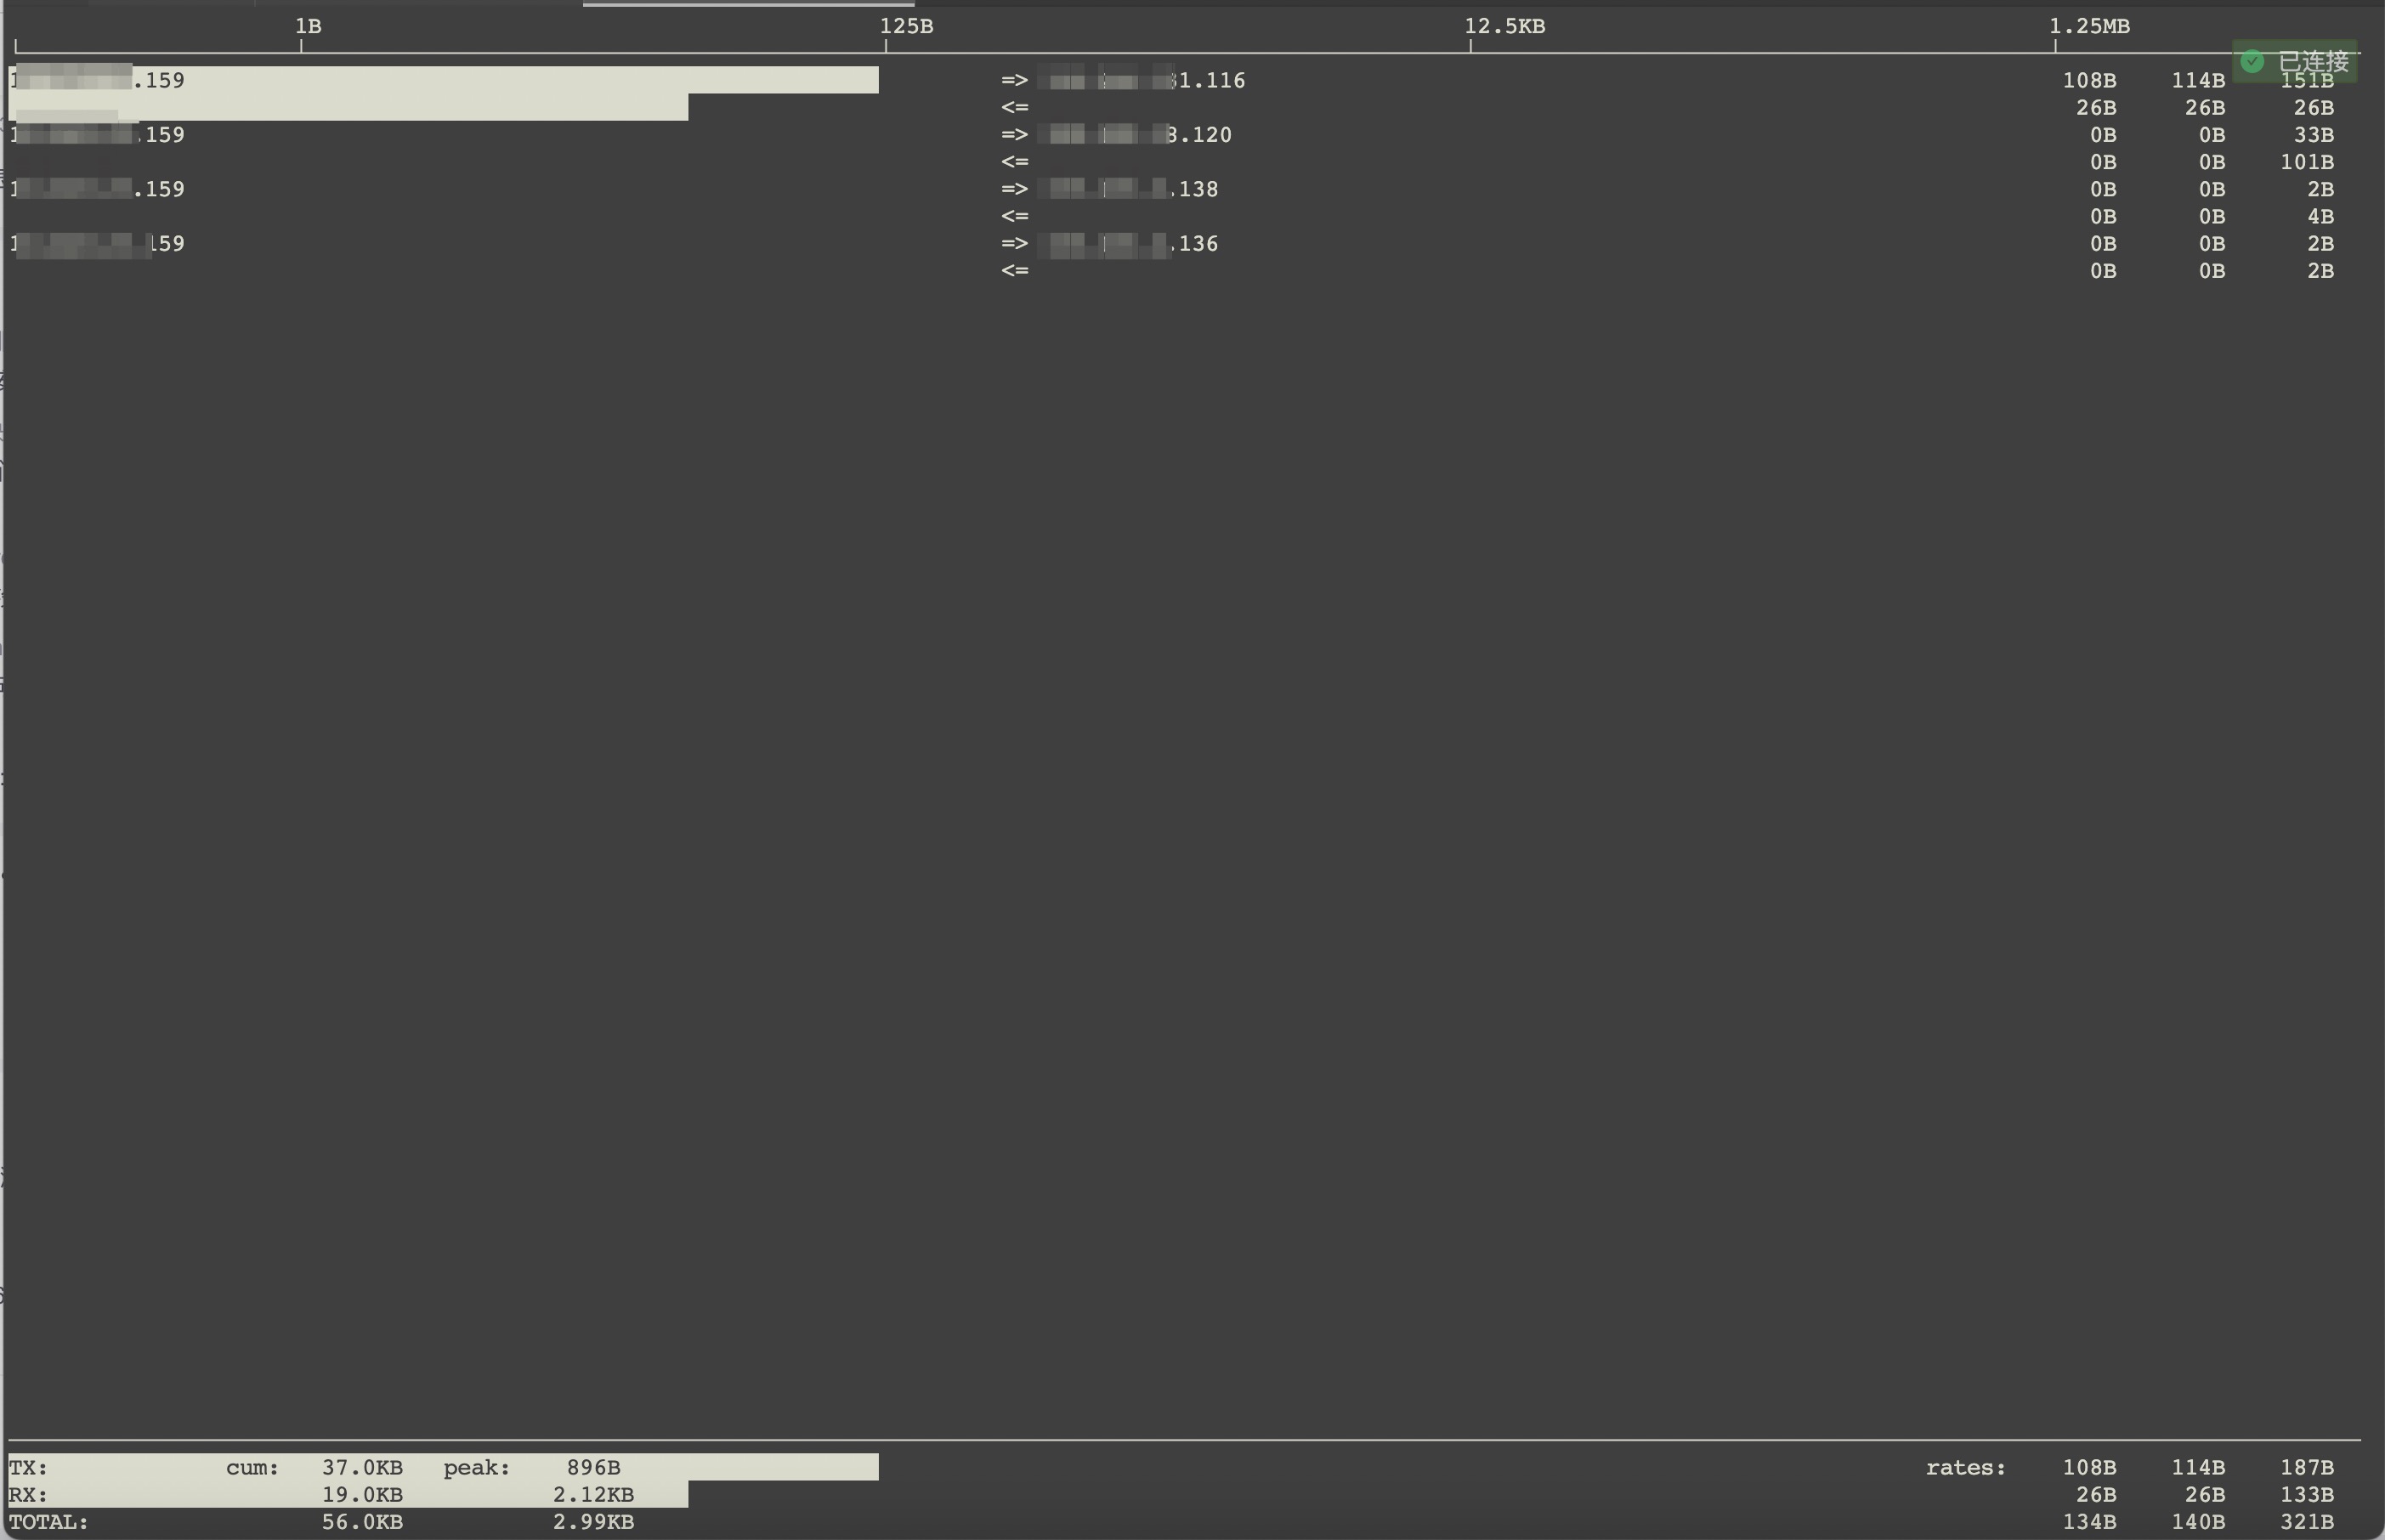
Press L to display the traffic scale.
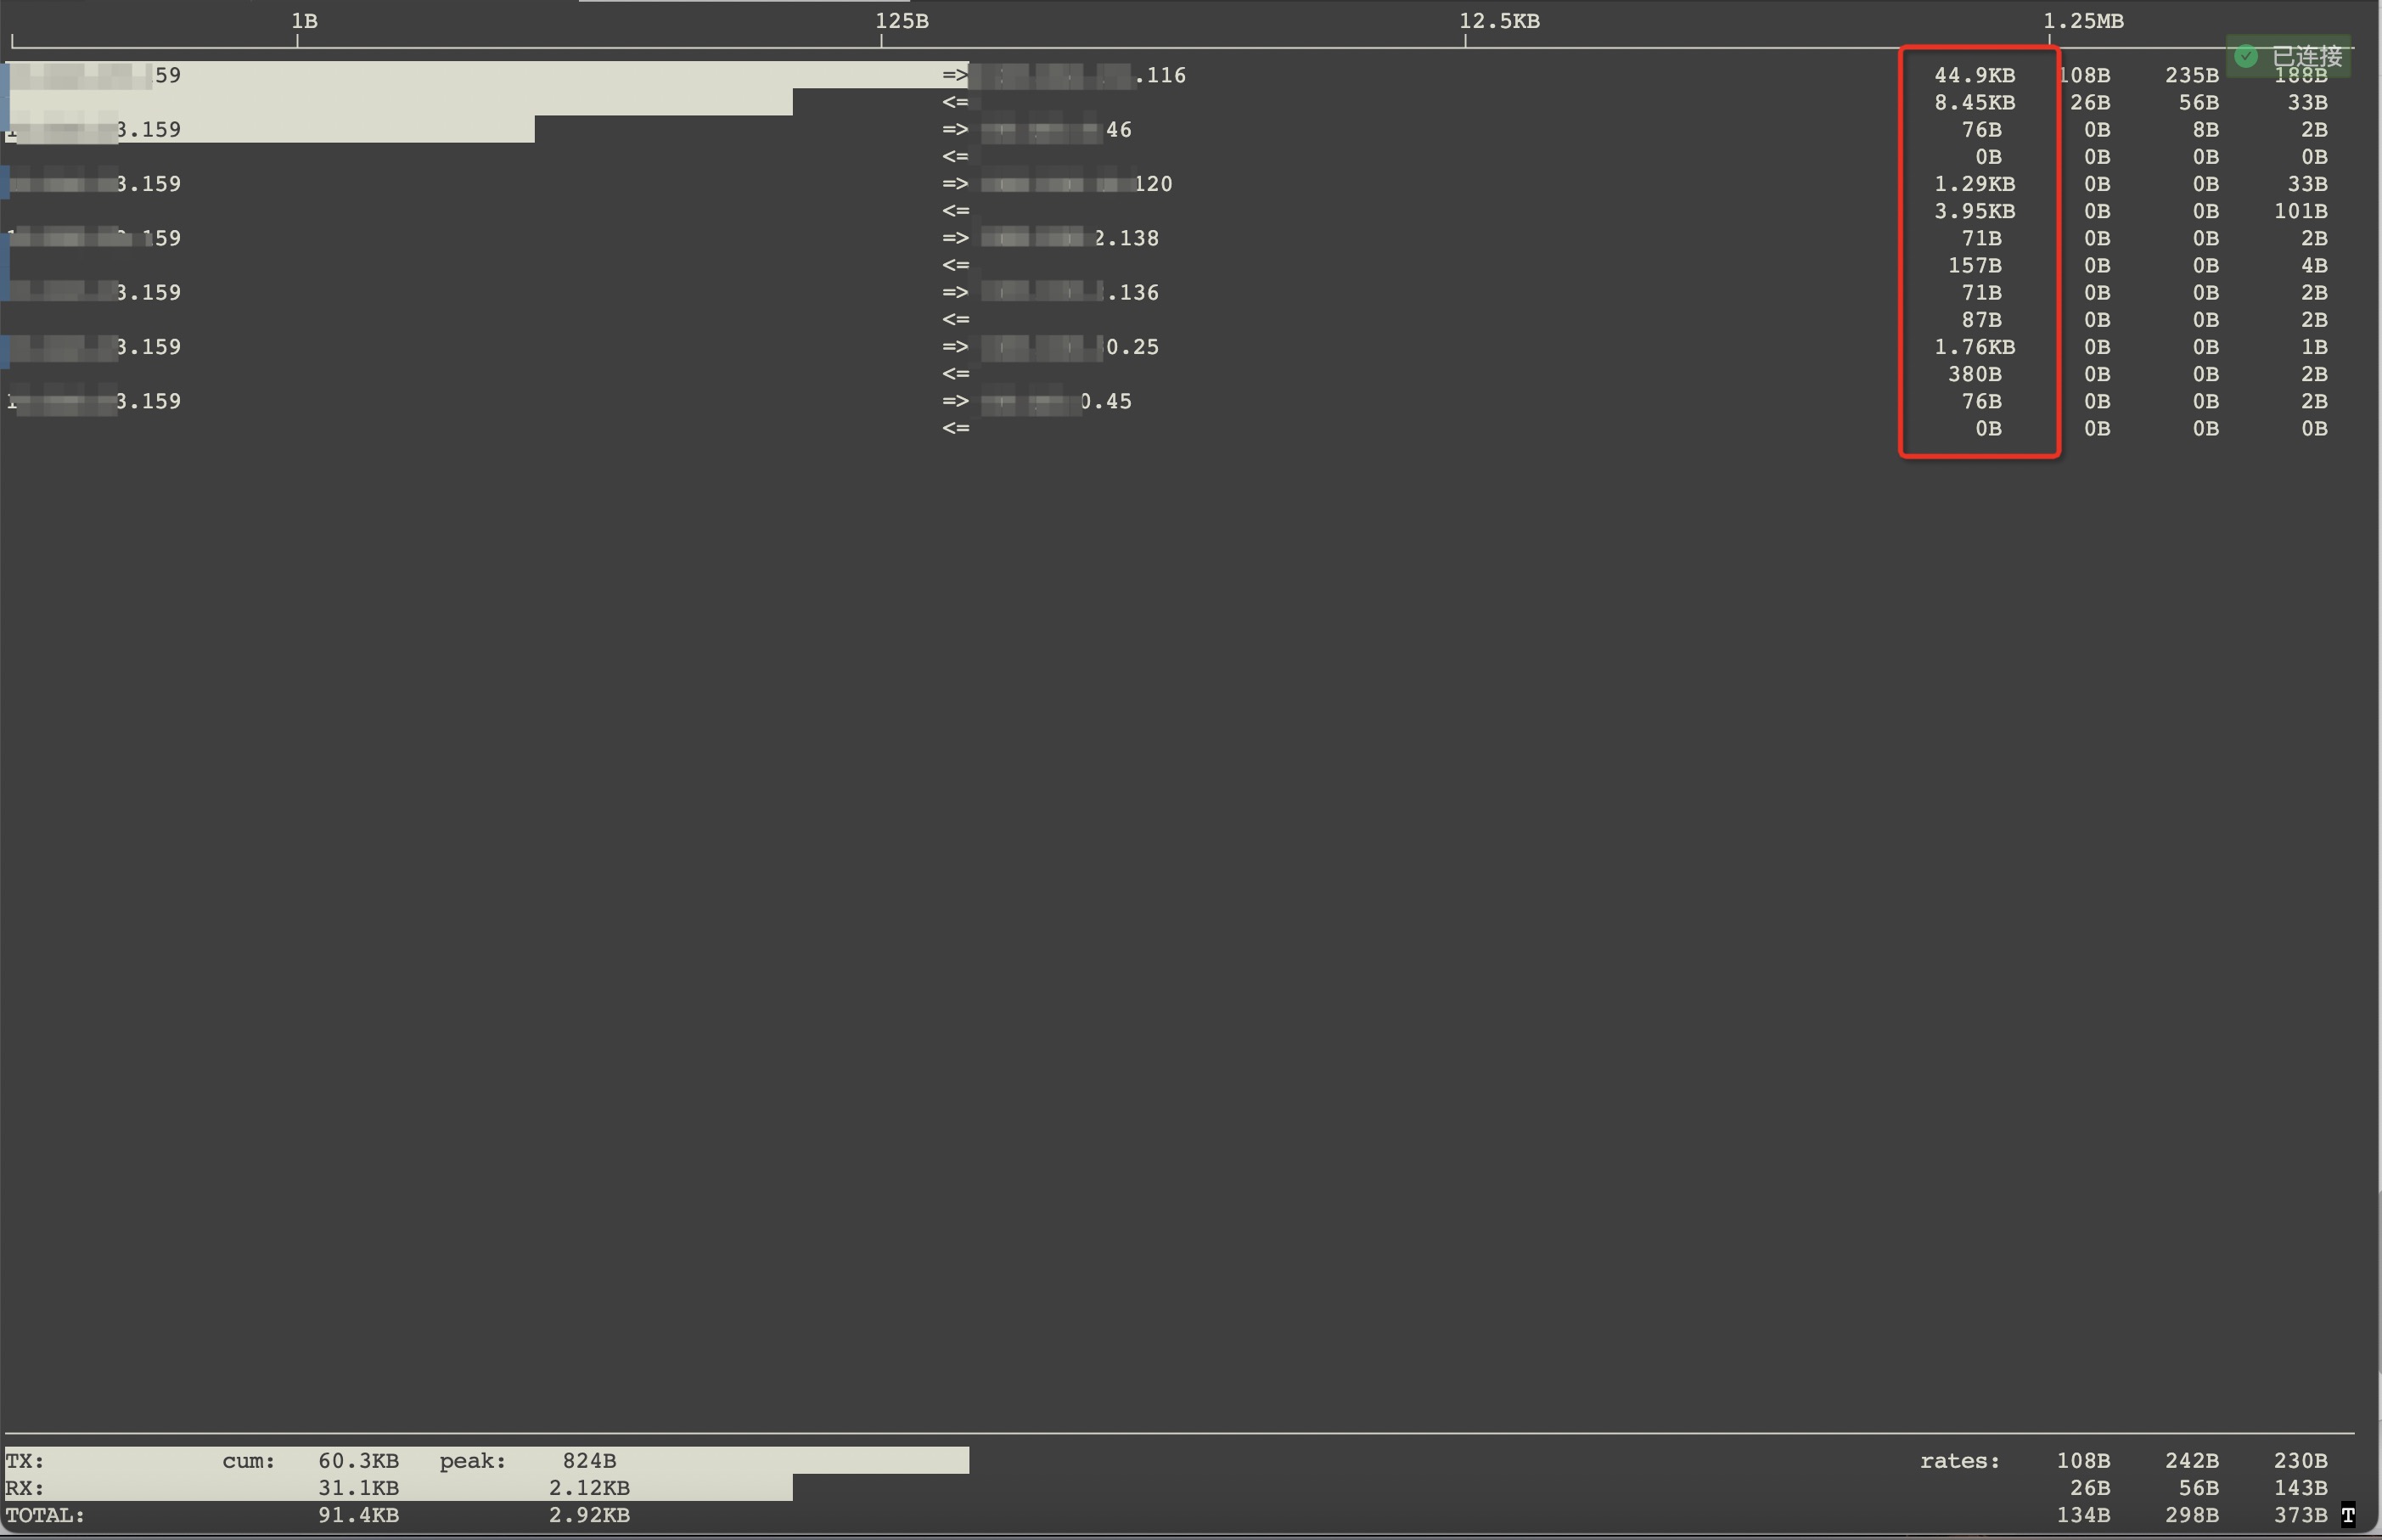
Press T to display the total traffic.
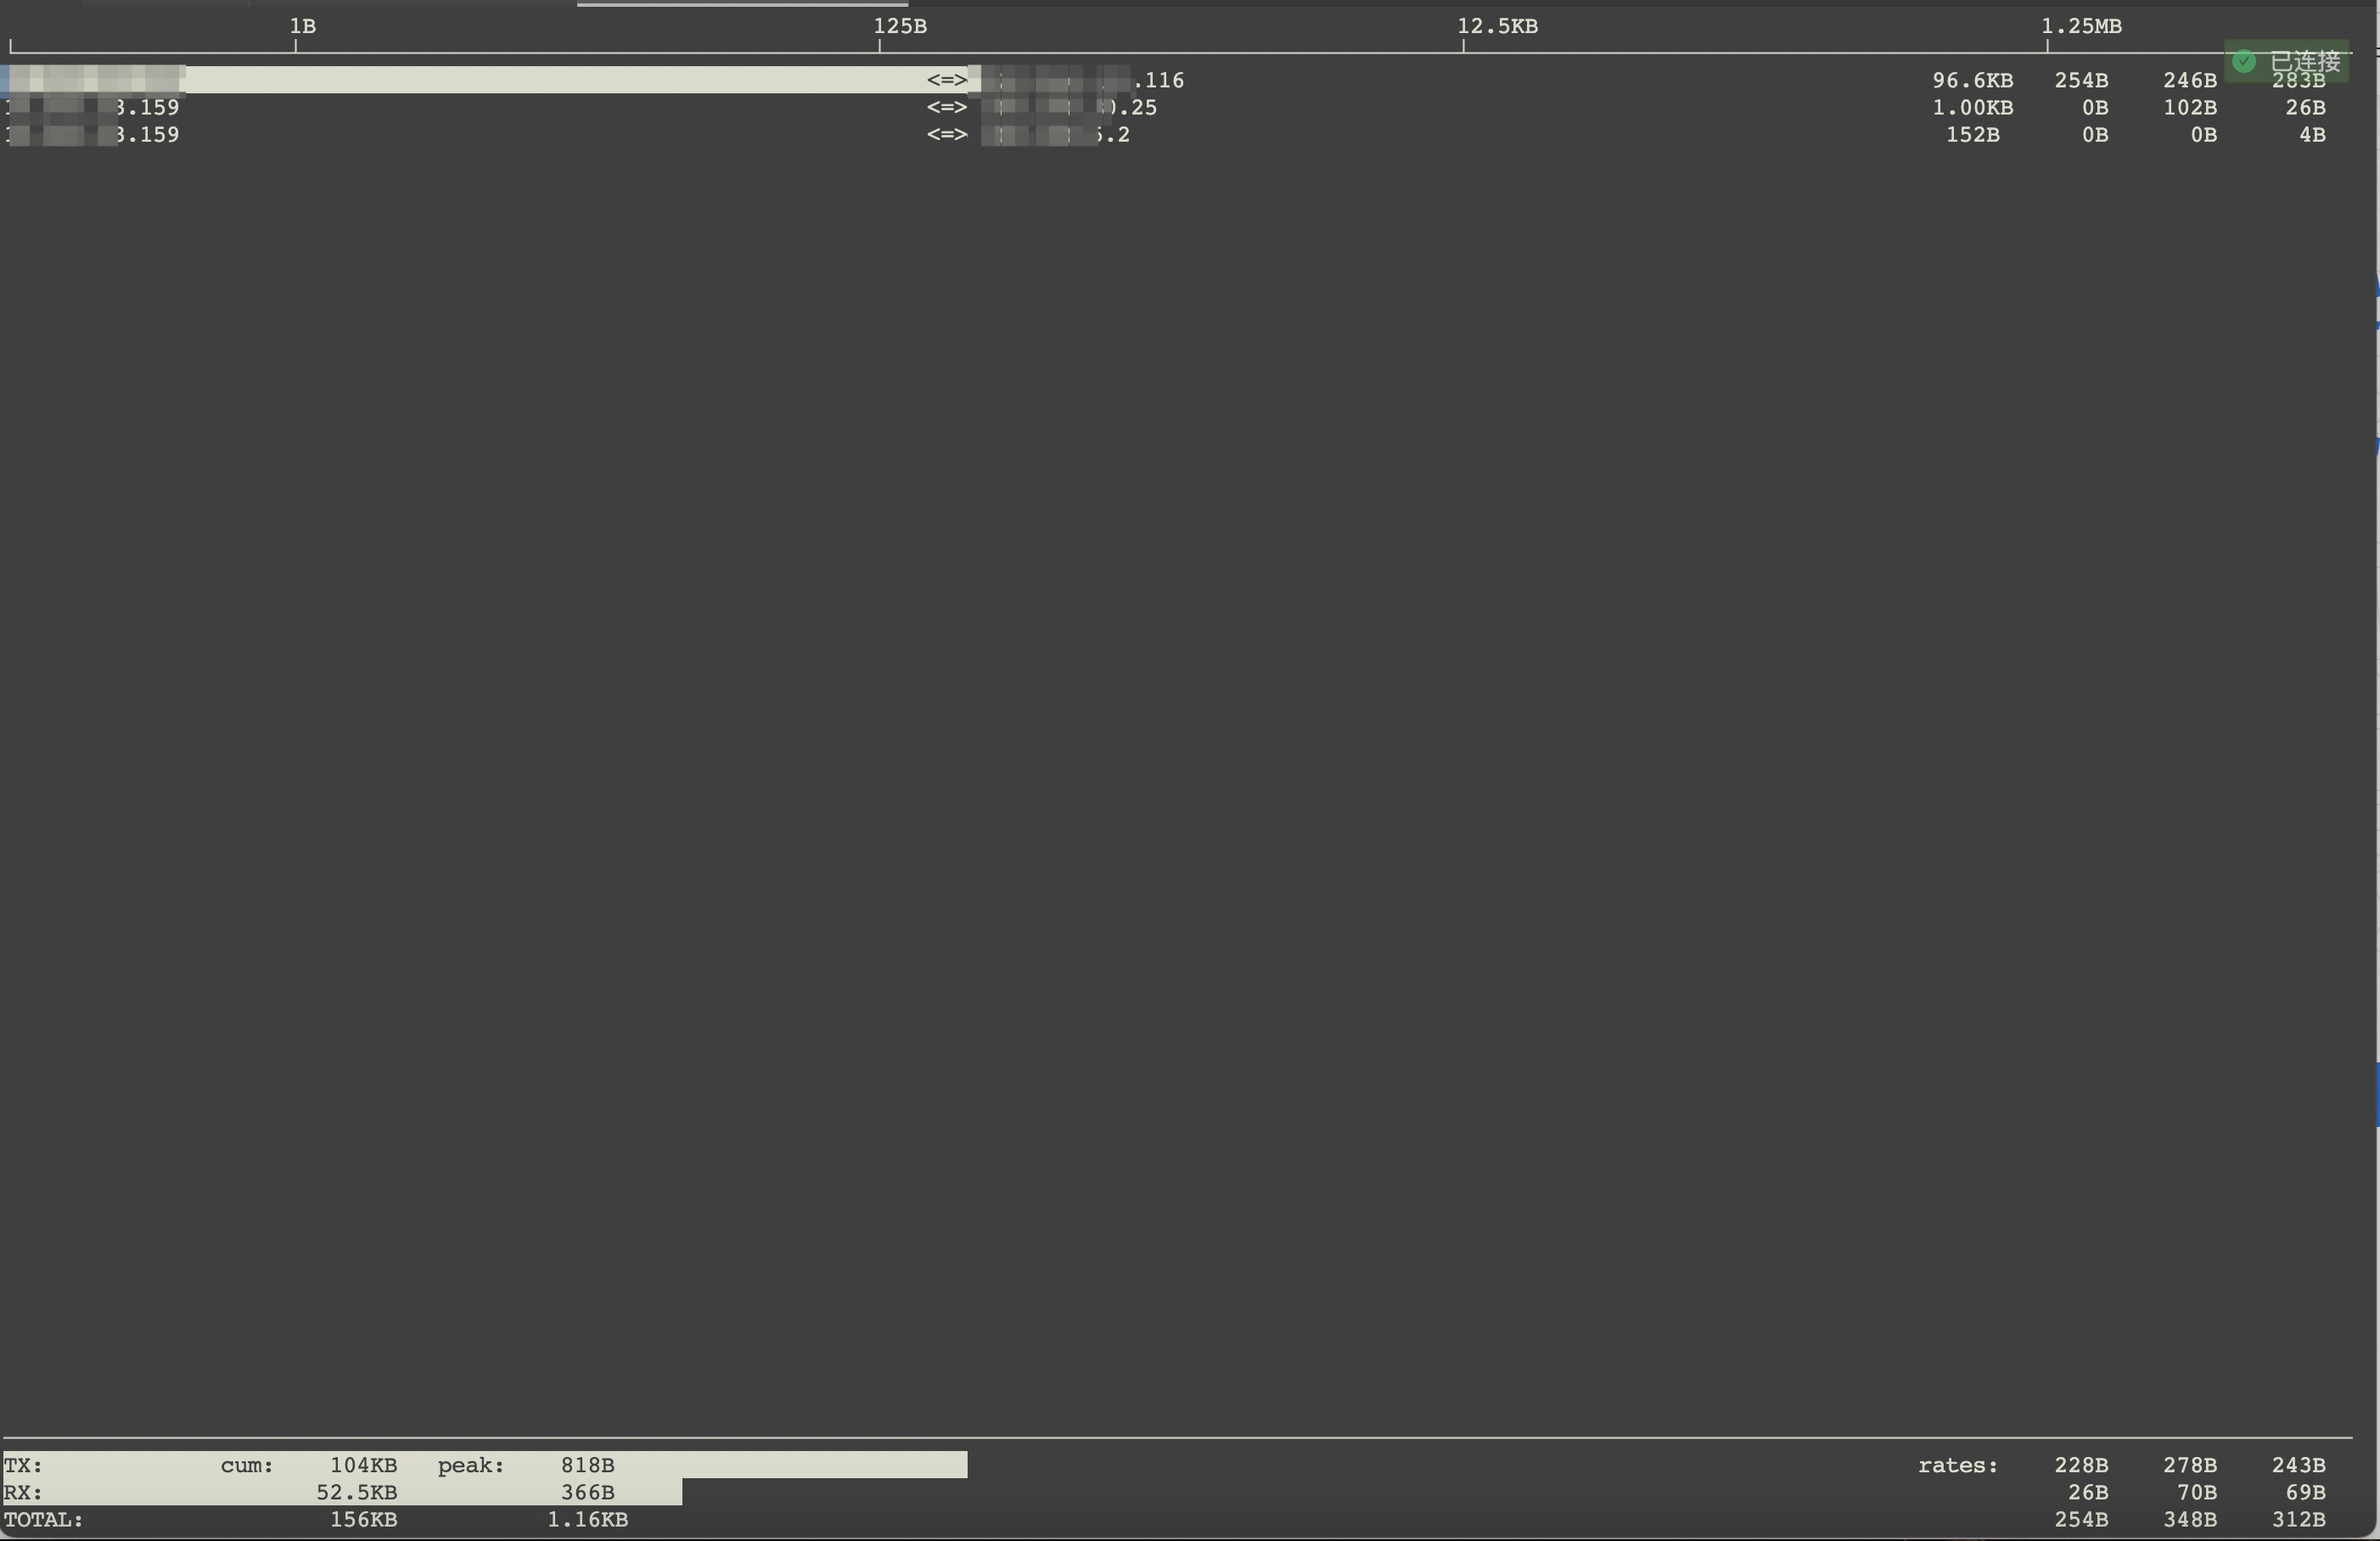
Press t to display sent and received traffic on a single line.
Press B multiple times. The top-left corner displays "Bars show 2 s/10 s/40 s average". Refreshing the statistics multiple times can help you find the IP address that consumes the most traffic.
Press l. Enter the IP address that consumes the most traffic, and then press Enter.
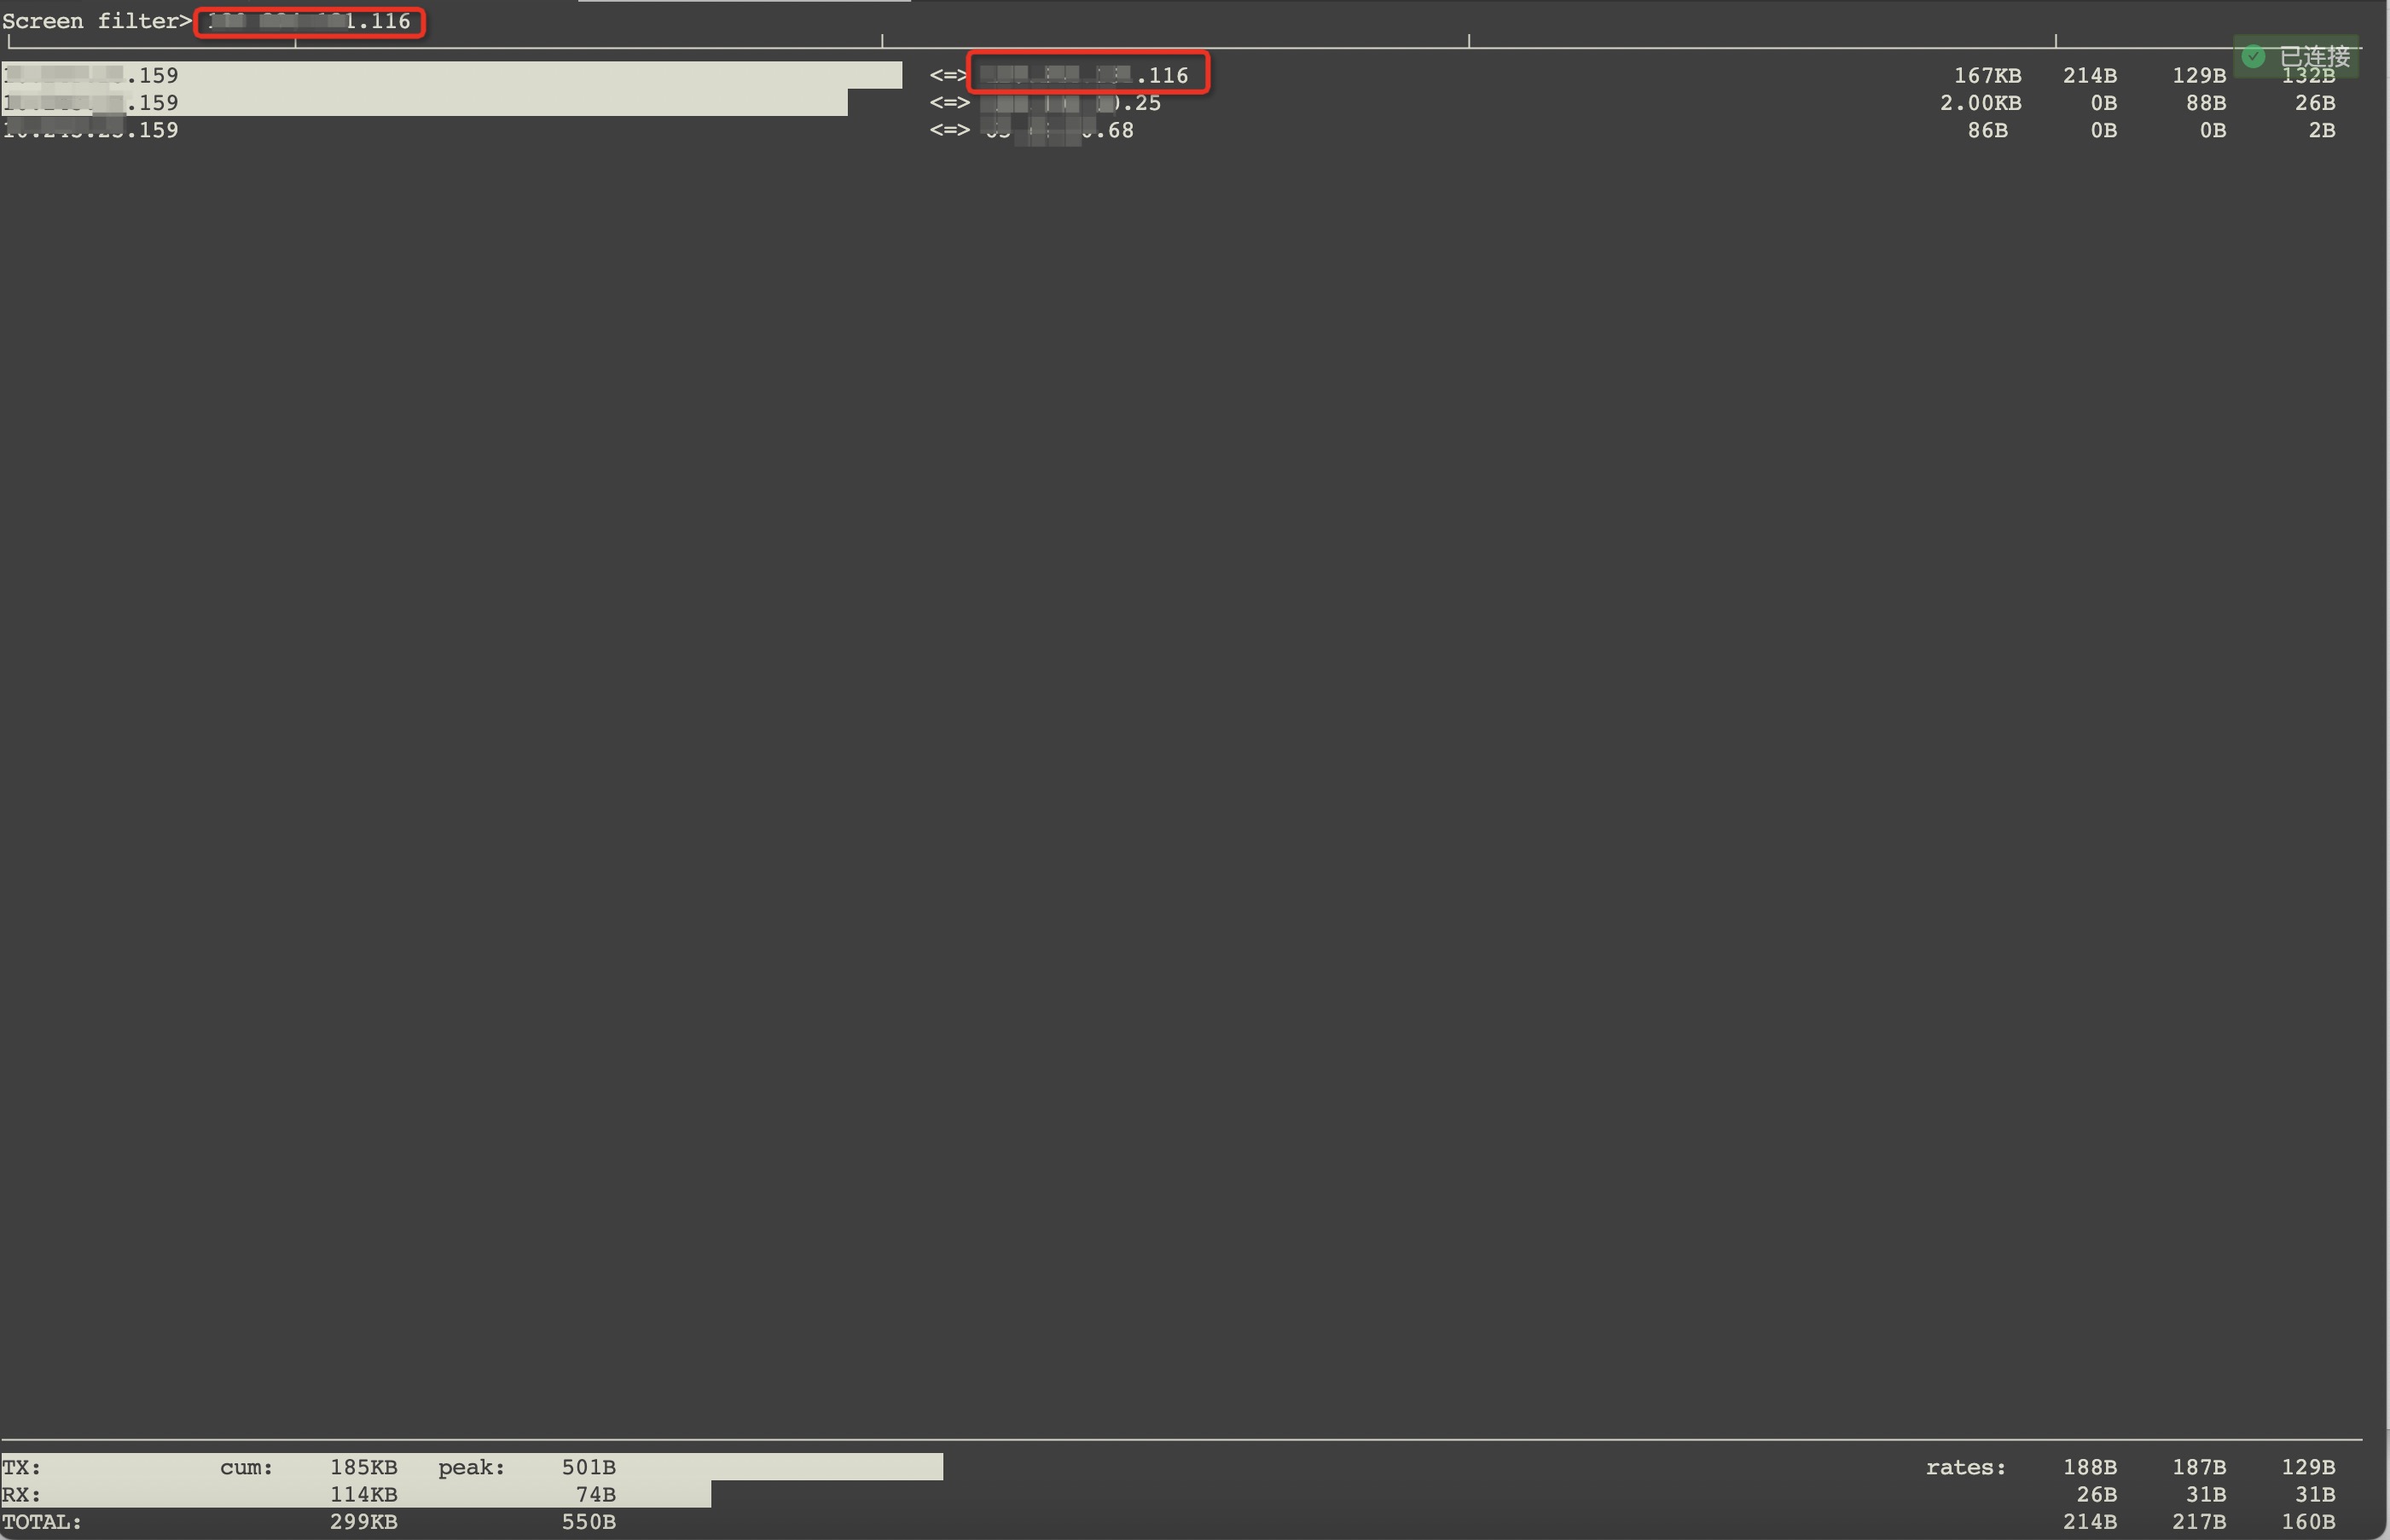
Press p to see which port consumes more traffic.
Processes
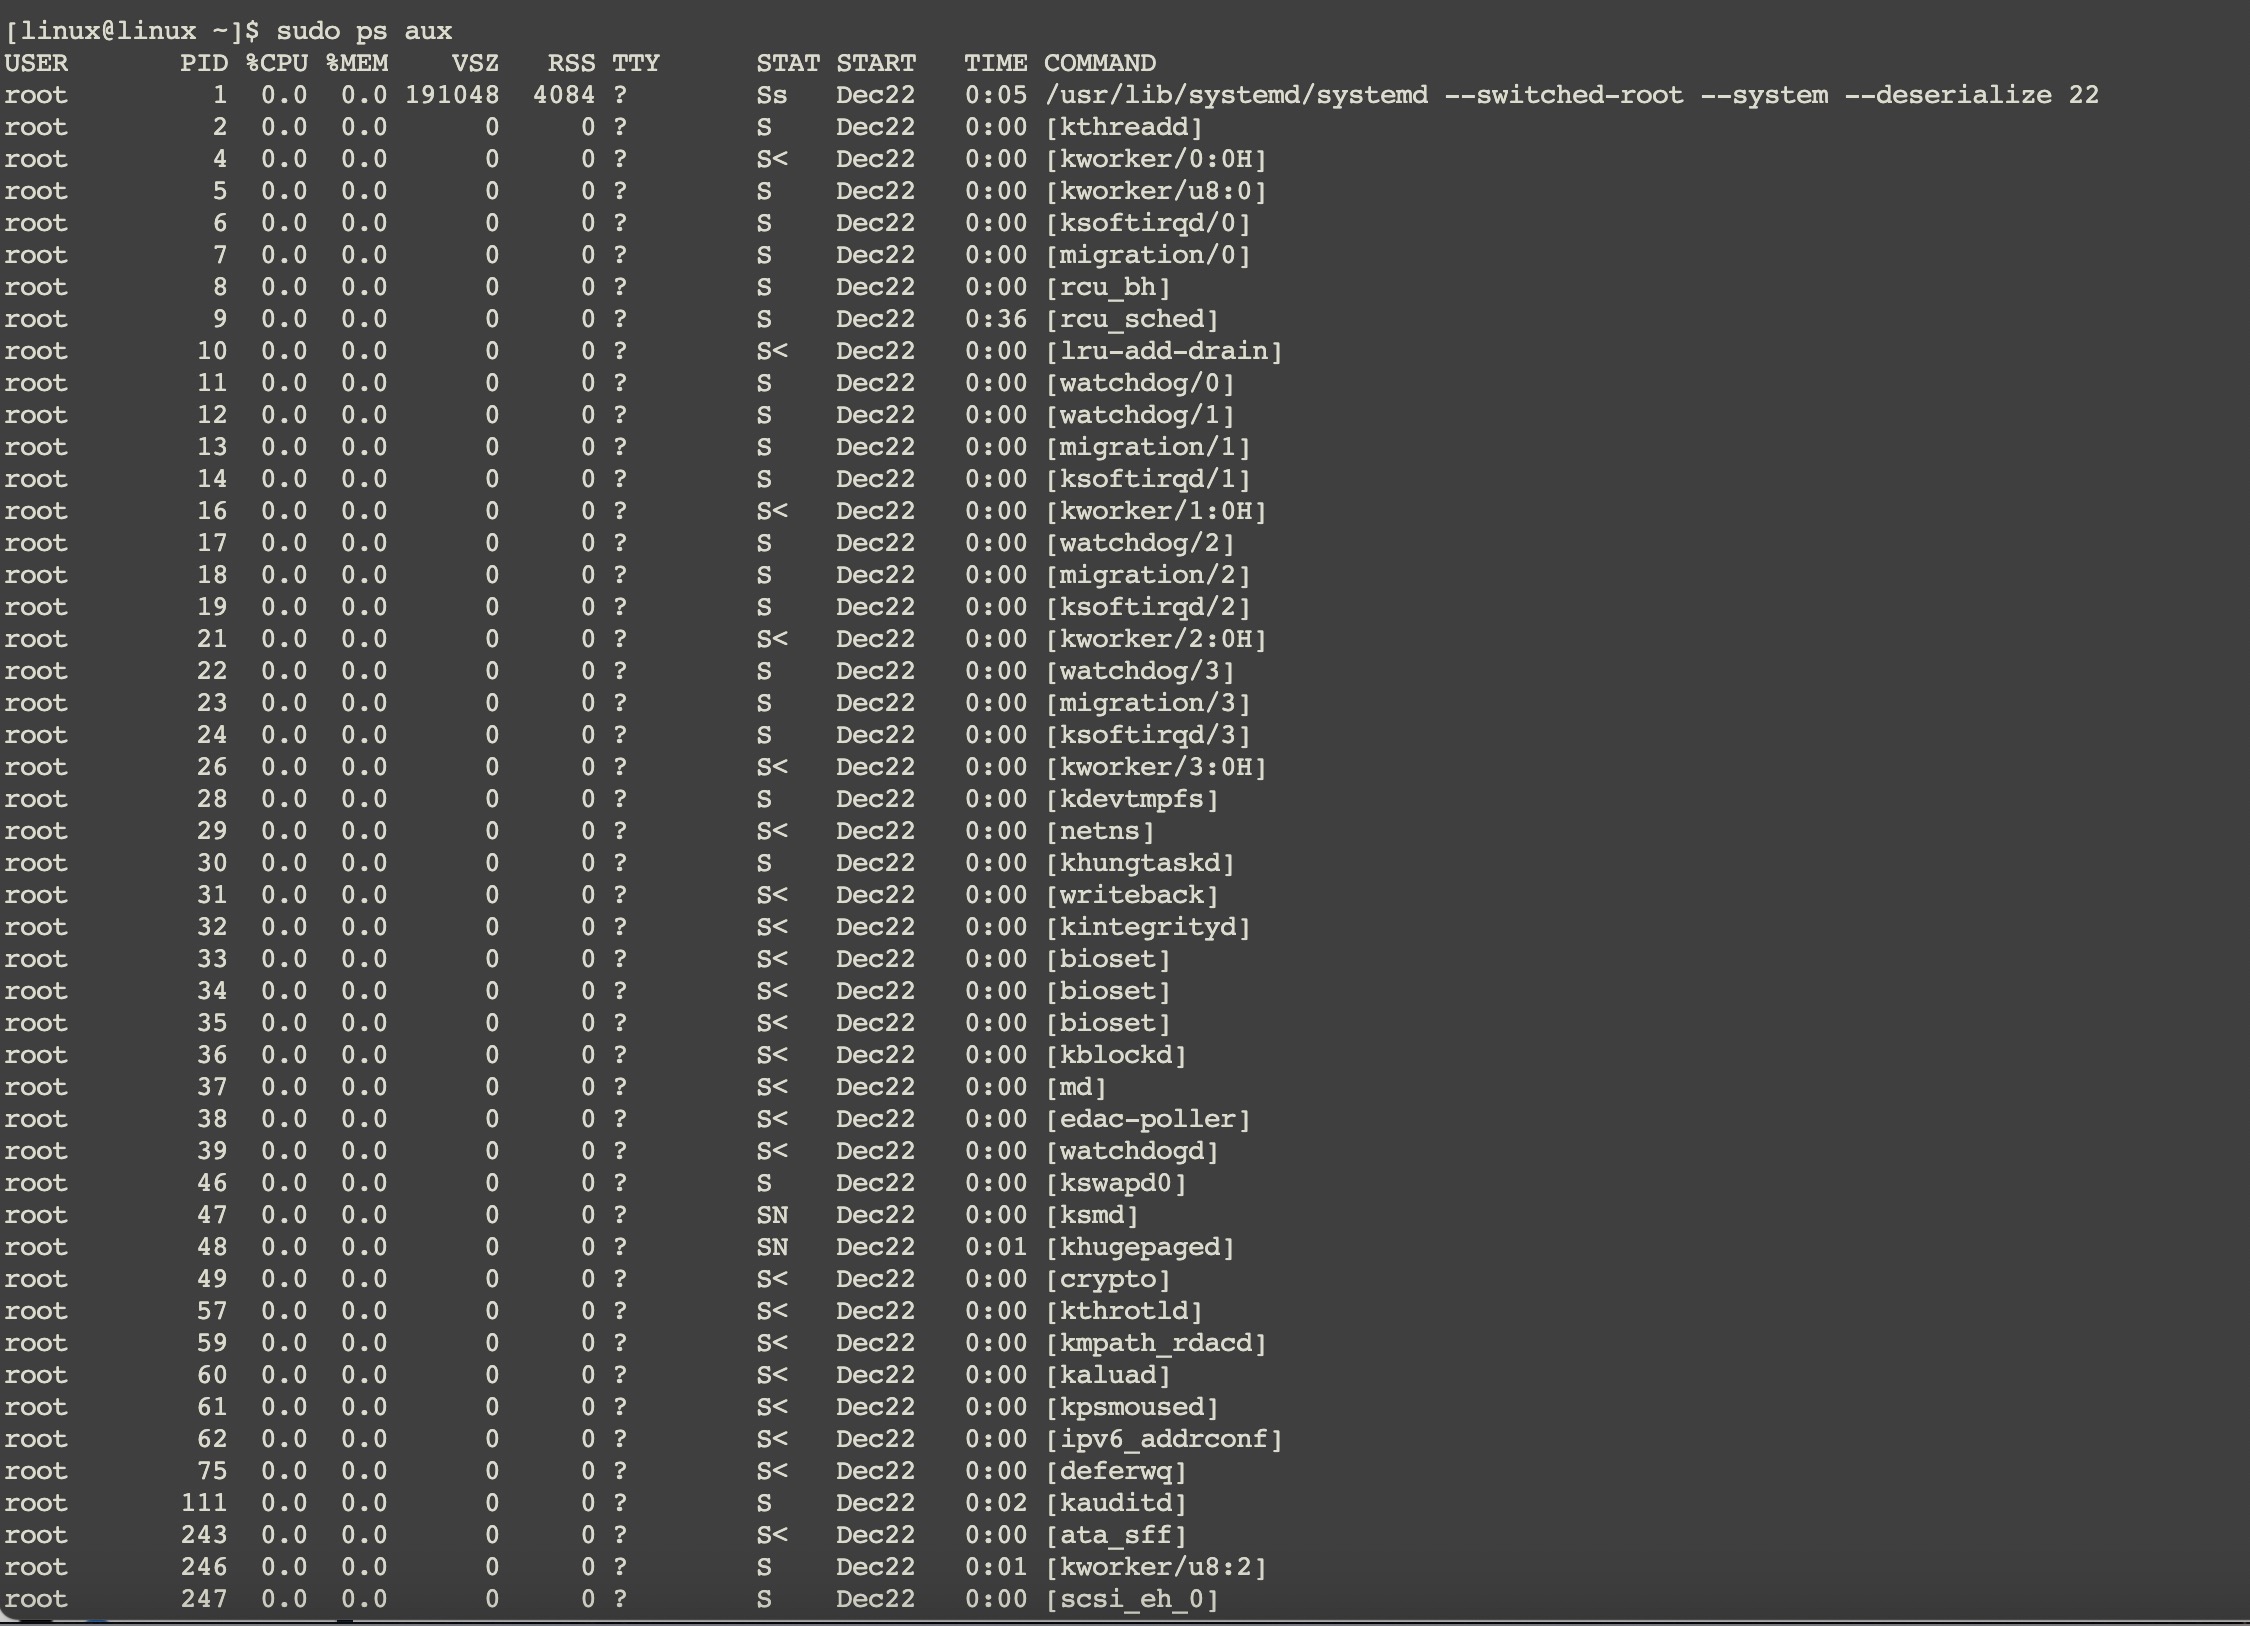
The `ps` command lists the processes currently running on the system. You can use this command to see which processes are running, check their status, identify which processes are using too many resources, and determine if any processes have ended or become zombie processes.
Run the following command:
sudo ps aux