Performance Experience pricing and specifications (China site (aliyun.com))
This topic describes the pricing and specifications of Quick Tracking.
Deployment mode
Quick Tracking supports Alibaba Cloud public cloud multi-tenant SaaS, Alibaba Cloud private deployment, and non-Alibaba Cloud private deployment to meet your deployment requirements.
If you have issues related to private deployment or purchase of SaaS consulting products, you can add the DingTalk number a6kn0hu.
Public Cloud SaaS Pricing
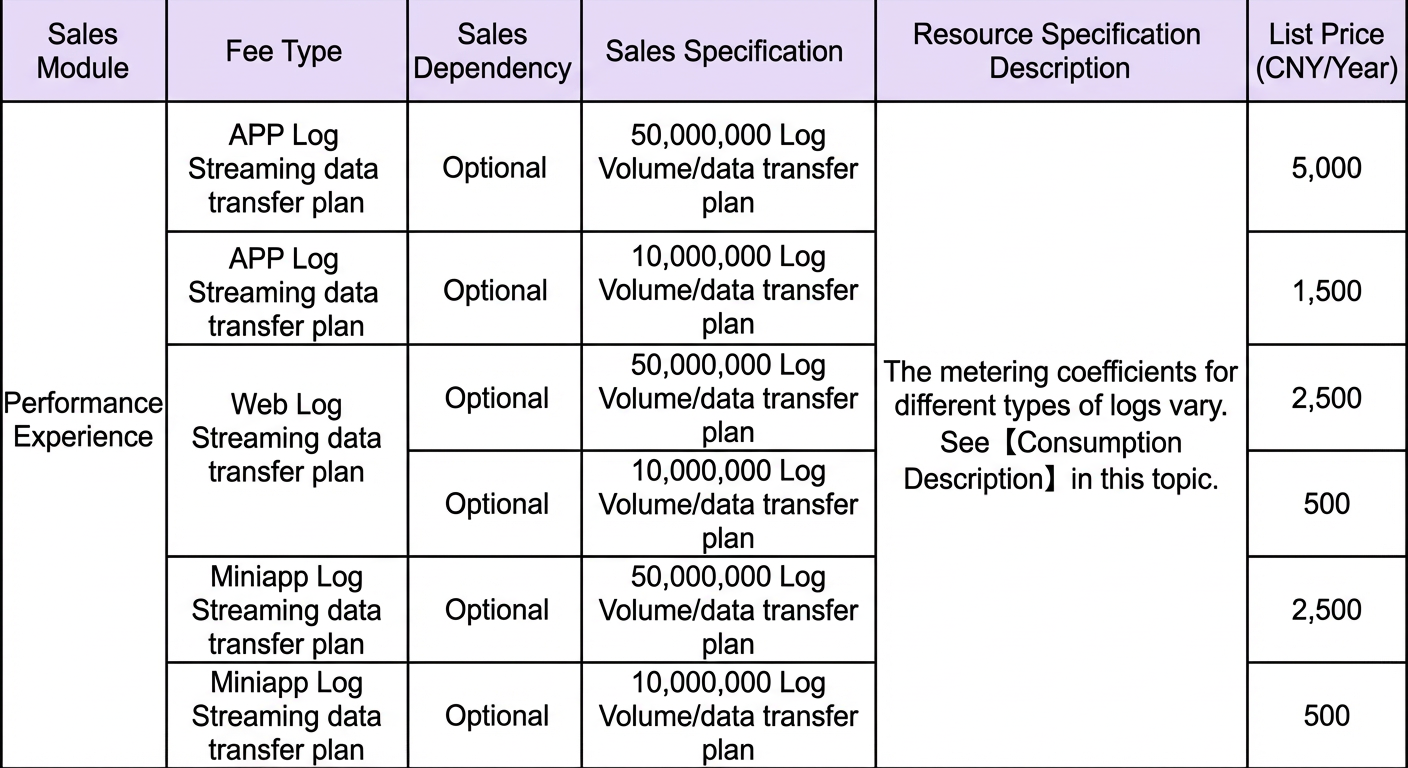
The App/Web /applet side provides 10 million /50 million log volume resource package and purchase address respectively.
It can be purchased separately and supports three-terminal performance monitoring of App, Web and mini programs. You need to order by terminal according to the required quantity.
Different log types consume resource package based on the correlation coefficient. For more information, see Consumption description.
Consumption Description
App
The app provides the following features:
During the validity period of the agreement, after product iteration, new features may be added to the package, which will not affect the features already included when you purchase. If you enable the new feature on the Switch and Sampling Settings page or on the Features page of the new feature, the log volume of the new feature is also included in your total log volume.
The following is the menu for the current App-side package
Function Category | Features | Function description |
Query | Query time range | 90 days |
Management | Activate and manage | You can adjust the network analysis, memory analysis, and H5 page analysis for native pages,. You can also adjust the sample rate of network analysis, Caton analysis, startup analysis, H5 page analysis, and native page analysis. You can also adjust the upper limit of custom exceptions and the sending policy. |
Purchase Management | You can view the consumption progress of a plan. | |
Stability monitoring | Raw Log | ☑️ 15 days |
Caton module | ☑️ | |
OOM exception | ☑️ | |
Memory Usage | ☑️ | |
Performance analysis | Start analysis | ☑️ Adjustable sampling |
Network Analysis | ☑️ Adjustable sampling | |
H5 Page Analysis | ☑️ Adjustable sampling | |
Monitoring and Alerting | Monitoring and alerting | ☑10 Plans |
Features | User details | ☑️ |
User Session Tracking | ☑️ | |
Manage symbol tables | ☑Supported uploading 100 symbol tables | |
Custom aggregation | ☑️ | |
Log fishing | ☑️ |
Billing and consumption description:
Log specifications | [Package Specifications] The maximum number of logs is subject to the specifications displayed on the page where the service is purchased and the payment is completed. [Validity Period] The validity period is 365 days. The annual package takes effect from the date of activation, and becomes invalid when the upper limit of the package log volume is consumed or the package validity period expires (whichever is earlier). After the package expires, Quick Tracking has the right to unilaterally terminate the service. |
Package log volume description:
The Quick Tracking performance experience updates the list of applications that enable the service in the product background every day. The Quick Tracking performance experience includes the consumption of the total log volume of the package based on the log usage of all App applications that use the "Quick Tracking performance experience" report logs under the user account (including new apps created by the user under the user account and activated the "Quick Tracking performance experience" during the service validity period).
Total number of logs under a user account=(Number of logs reported for each type × Factor of the corresponding log type) The following table describes the log types and coefficients of Quick Tracking.
Type | Log | Coefficient |
Application startup | Start PV | 1 |
Stability | OOM exception | 25 |
Collapse | 25 | |
ANR | 25 | |
Custom Exceptions | 25 | |
Caton | 25 | |
Memory metrics | 25 | |
Performance | Startup performance | 1 |
H5 Page Analysis | 1 | |
Network Analysis | 1 | |
Native page | 1 | |
Log fishing | Calculated based on the number of returned log entries, each row counts 0.1 log entries. |
Memory metrics are collected after the application is started. If a large number of applications are started, the memory consumption may be large. If you have concerns, lower the sample rate or disable
mini program side
The Quick Tracking Performance Experience applet provides the following features:
During the validity period of the agreement, after product iteration, new features may be added to the package, which will not affect the features already included when you purchase. If you enable the new feature on the Switch and Sampling Settings page or on the Features page of the new feature, the log volume of the new feature is also included in your total log volume.
The following is the menu of the current mini program package
Function Category | Features | Function description |
Query | Query time range | 90 days |
Management | Activate and manage | Supports adjusting the sample rate of cold start, JS exception, and request monitoring. |
Purchase Management | You can view the consumption progress of a plan. | |
Stability monitoring | JS exception | ☑️ Adjustable sampling |
Performance analysis | Request Monitoring | ☑️ Adjustable sampling |
Monitoring and alerting | Monitoring and alerting | 10 Plans |
Features | User Session Tracking | ☑️ |
Billing and consumption description:
Log Meal Set Specifications | [Package Specifications] The maximum number of logs is subject to the specifications displayed on the page where the service is purchased and the payment is completed. [Validity Period] The validity period is 365 days. The annual package takes effect from the date of activation, and becomes invalid when the upper limit of the package log volume is consumed or the package validity period expires (whichever is earlier). After the package expires, Quick Tracking Performance Experience has the right to unilaterally terminate the service. |
Package log volume description:
The Quick Tracking experience updates the list of applications that enable the service in the product background every day. The Quick Tracking experience includes the total log consumption of the package based on the log usage of all mini program applications that use the Quick Tracking experience under the user account (including new mini programs that are created under the user account and activated the Quick Tracking experience within the service validity period).
Total number of logs under a user account=(Number of logs reported for each type × Factor of the corresponding log type) The current log types and coefficients are defined as follows:
Type | Log | Coefficient |
Small program startup | Start PV | 1 |
Stability | JS exception | 25 |
Performance | Request monitoring | 1 |
Web
The Quick Tracking Performance Experience web-side has the following features:
During the validity period of the agreement, after product iteration, new features may be added to the package, which will not affect the features already included when you purchase. If you enable the new feature on the Switch and Sampling Settings page or on the Features page of the new feature, the log volume of the new feature is also included in your total log volume.
The following is the menu for the current Web-side package
Function Category | Features | Function description |
Query | Query time range | 90 days |
Management | Activate and manage | Supports adjusting the sample rate of cold start, JS exception, request monitoring, page monitoring (unified control of user perception, loading performance, slow loading), and white screen monitoring. |
Purchase Management | You can view the consumption progress of a plan. | |
Stability monitoring | JS exception | ☑️ Adjustable sampling |
Performance analysis | Request Monitoring | ☑️ Adjustable sampling |
User perception | ☑️ Adjustable sampling | |
Loading performance | ☑️ Adjustable sampling | |
Slow loading | ☑️ Adjustable sampling | |
White screen monitoring | ☑️ Adjustable sampling | |
Monitoring and alerting | Monitoring and alerting | 10 Plans |
Features | User Session Tracking | ☑️ |
Billing and consumption description:
Log specifications | [Package Specifications] The maximum number of logs is subject to the specifications displayed on the page where the service is purchased and the payment is completed. [Validity Period] The validity period is 365 days. The annual package takes effect from the date of activation, and becomes invalid when the upper limit of the package log volume is consumed or the package validity period expires (whichever is earlier). After the package expires, Quick Tracking Performance Experience has the right to unilaterally terminate the service. |
Package log volume description:
The Quick Tracking performance experience updates the list of applications that have the service enabled in the background of the product every day. The Quick Tracking performance experience includes the consumption of the total log volume of the package based on the log usage of all Web applications that use the "Quick Tracking performance experience" under the user account (including the new Web created by the user under the user account and activated the "Quick Tracking performance experience" within the service validity period).
Total number of logs under a user account=(Number of logs reported for each type × Factor of the corresponding log type) The current log types and coefficients are defined as follows:
Type | Log | Coefficient |
Web Start | Start PV | 1 |
Stability | JS exception | 25 |
Performance | Request monitoring | 1 |
Page monitoring (user perception; loading performance; slow loading; unified use of logs collected by pages) | 1 | |
White screen data | 1 | |
White Screen Screenshot | 50 |
White screen monitoring is divided into two types: "very likely white screen" and "likely white screen". "likely white screen" only collects white screen data, "very likely white screen" collects white screen data and screenshots when white screen occurs. because screenshots consume a lot of pictures, the coefficient is 50. If you have concerns about large consumption, you can adjust the threshold of the white screen in the white screen monitoring interface to reduce the possibility of "most likely white screen".
Note: New product features may be added to the Quick Tracking performance experience in the future. The Quick Tracking performance experience will state the log volume factor for new features when they are launched. If you use new features, logs must be included in the total number of logs based on the coefficient of the new features. In this case, follow the instructions when the new features of Quick Tracking are launched.