Configure and enable audit mode

更新时间:
复制 MD 格式

Data Security Center (DSC) provides a data audit feature that analyzes audit logs to help you track malicious activity, identify unauthorized access, and investigate security incidents. To use the data audit feature, you must configure an audit mode. DSC then collects audit logs from the relevant databases according to the configured mode. This topic explains how to configure auditing.

Prerequisites

  • You have activated the Free Edition of Data Security Center or purchased an Enterprise instance of Data Security Center.For more information, see Free Edition of Data Security Center or Purchase Data Security Center.

  • You have authorized data assets. For more information, see Asset authorization.

  • To enable the data audit feature for an ApsaraDB for OceanBase instance, you must first enable SQL Audit for a target tenant in the OceanBase instance. For more information, see SQL Audit.

    Important

    You can enable the audit mode for a target OceanBase instance as described in this document only after you enable SQL Audit for the target tenant in that instance. After you successfully enable the audit mode, the data audit service becomes available for all databases that belong to tenants with SQL Audit enabled in the OceanBase instance.

Background

The audit mode for a newly authorized instance is disabled by default. You must enable and configure an audit mode for your database assets. DSC then collects operation logs for the corresponding data assets and stores them as audit logs. Based on these audit logs and audit alert rules, DSC detects risks such as data breaches, vulnerability attacks, and SQL injection, and reports alerts.

Audit modes

DSC supports two audit modes: native log collection and traffic collection (agent). You can select the appropriate audit mode based on your actual situation.

Note

Use the native log collection audit mode for native databases and the traffic collection (agent) audit mode for self-managed databases.

Audit mode comparison

Audit mode

Data asset types

Mechanism

Features

native log collection

  • OSS

  • Alibaba Cloud native databases (self-managed databases and Redis are not supported)

Data Security Center (DSC) automatically establishes a data collection link with the corresponding product to collect logs. The logs record all DQL, DML, and DDL operations. The database kernel outputs this information with minimal impact on CPU consumption. For more information, see the FAQ section in this topic.

Warning

In this audit mode, cloud products prioritize business operations over auditing. This may cause a small number of logs to be lost during periods of high business workload.

traffic collection (agent)

  • RDS

  • PolarDB

  • self-managed databases (must be enabled in the asset center)

A data collection link is established through PrivateLink. An agent is deployed on the application server or database server that accesses the database. The agent forwards log traffic to the DSC audit server to complete log collection.

DSC provides a one-click Establish Network Connection feature to automatically configure PrivateLink. For more information about PrivateLink, see What is PrivateLink?.

The one-click Establish Network Connection feature automatically configures PrivateLink by reading the security group and vSwitch of your ECS instance. Therefore, the vSwitch for the ECS instance where the agent is installed must be in a supported zone for the data audit service. For more information, see the Supported zones for ECS instances with traffic collection agents section in this topic.

The one-click network connection feature works as follows:

  • If your ECS instance uses a basic security group, the system creates a security group in the corresponding VPC and establishes a network connection by authorizing access between your ECS security group and the new security group.

  • If your ECS instance uses an enterprise security group, the system modifies a security group rule under the ECS instance to allow inbound traffic on port 13001/13002 to establish the network connection.

Important
  • You can deploy the agent only on ECS instances that are in the same Alibaba Cloud account as your Data Security Center service.

  • This audit mode consumes server resources such as CPU, memory, and network bandwidth.

    Average CPU usage is 2%. Maximum memory usage is 300 MB. The agent's own bandwidth consumption is negligible. The primary consumption is the forwarded database traffic.

    You can customize usage thresholds for CPU, memory, and other resources. For more information, see Manage agents in this topic.

  • Stable agent operation is ensured under the following conditions: database traffic on the server does not exceed 800 Mbps, the server has at least 500 MB of available storage, the process has a memory limit of at least 300 MB, the agent's CPU limit is at least 20%, and the network connection between the server and the data audit service is stable.

  • Requires PrivateLink configuration and agent deployment.

  • No additional collection fees.

Supported zones for agents

List of supported zones

Public cloud

Region name

Region ID

Zones

Zone name

Zone ID

China (Hangzhou)

cn-hangzhou

7

Hangzhou Zone B

cn-hangzhou-b

Hangzhou Zone F

cn-hangzhou-f

Hangzhou Zone G

cn-hangzhou-g

Hangzhou Zone H

cn-hangzhou-h

Hangzhou Zone I

cn-hangzhou-i

Hangzhou Zone J

cn-hangzhou-j

Hangzhou Zone K

cn-hangzhou-k

China (Shanghai)

cn-shanghai

7

Shanghai Zone B

cn-shanghai-b

Shanghai Zone E

cn-shanghai-e

Shanghai Zone F

cn-shanghai-f

Shanghai Zone G

cn-shanghai-g

Shanghai Zone L

cn-shanghai-l

Shanghai Zone M

cn-shanghai-m

Shanghai Zone N

cn-shanghai-n

China (Qingdao)

cn-qingdao

2

Qingdao Zone B

cn-qingdao-b

Qingdao Zone C

cn-qingdao-c

China (Beijing)

cn-beijing

8

Beijing Zone C

cn-beijing-c

Beijing Zone E

cn-beijing-e

Beijing Zone F

cn-beijing-f

Beijing Zone G

cn-beijing-g

Beijing Zone H

cn-beijing-h

Beijing Zone I

cn-beijing-i

Beijing Zone K

cn-beijing-k

Beijing Zone L

cn-beijing-l

China (Zhangjiakou)

cn-zhangjiakou

3

Zhangjiakou Zone A

cn-zhangjiakou-a

Zhangjiakou Zone B

cn-zhangjiakou-b

Zhangjiakou Zone C

cn-zhangjiakou-c

China (Hohhot)

cn-huhehaote

2

Hohhot Zone A

cn-huhehaote-a

Hohhot Zone B

cn-huhehaote-b

China (Shenzhen)

cn-shenzhen

3

Shenzhen Zone D

cn-shenzhen-d

Shenzhen Zone E

cn-shenzhen-e

Shenzhen Zone F

cn-shenzhen-f

China (Chengdu)

cn-chengdu

2

Chengdu Zone A

cn-chengdu-a

Chengdu Zone B

cn-chengdu-b

China (Guangzhou)

cn-guangzhou

2

Guangzhou Zone A

cn-guangzhou-a

Guangzhou Zone B

cn-guangzhou-b

China (Ulanqab)

cn-wulanchabu

3

Ulanqab Zone A

cn-wulanchabu-a

Ulanqab Zone B

cn-wulanchabu-b

Ulanqab Zone C

cn-wulanchabu-c

China (Hong Kong)

cn-hongkong

3

Hong Kong Zone B

cn-hongkong-b

Hong Kong Zone C

cn-hongkong-c

Hong Kong Zone D

cn-hongkong-d

Singapore

ap-southeast-1

3

Singapore Zone A

ap-southeast-1a

Singapore Zone B

ap-southeast-1b

Singapore Zone C

ap-southeast-1c

Malaysia (Kuala Lumpur)

ap-southeast-3

2

Kuala Lumpur Zone A

ap-southeast-3a

Kuala Lumpur Zone B

ap-southeast-3b

Indonesia (Jakarta)

ap-southeast-5

3

Jakarta Zone A

ap-southeast-5a

Jakarta Zone B

ap-southeast-5b

Jakarta Zone C

ap-southeast-5c

Germany (Frankfurt)

eu-central-1

2

Frankfurt Zone A

eu-central-1a

Frankfurt Zone B

eu-central-1b

Finance cloud

Region name

City

Zones

Zone name

Zone ID

China South 1 Finance Cloud

Shenzhen

2

China South 1 Finance Cloud Zone D

cn-shenzhen-finance-1d

China South 1 Finance Cloud Zone E

cn-shenzhen-finance-1e

China East 2 Finance Cloud

Shanghai

3

China East 2 Finance Cloud Zone F

cn-shanghai-finance-1f

China East 2 Finance Cloud Zone G

cn-shanghai-finance-1g

China East 2 Finance Cloud Zone K

cn-shanghai-finance-1k

Government cloud

Region name

City

Zones

Zone name

Zone ID

China North 2 Ali Gov Cloud 1

Beijing

2

China North 2 Ali Gov Cloud 1 Zone C

cn-north-2-gov-1c

China North 2 Ali Gov Cloud 1 Zone D

cn-north-2-gov-1d

Enable native log collection

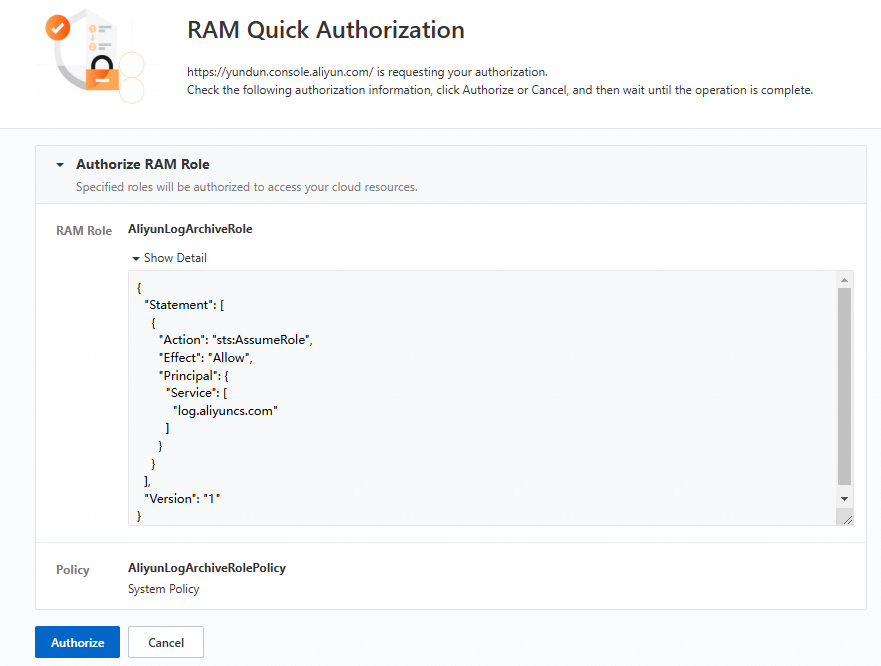
Step 1: Grant SLS access to data assets

Native log collection requires SLS permissions to access your cloud resources.

  1. Log on to the Data Security Center console.

  2. In the left-side navigation pane, choose Data Auditing > Native Data Auditing.

  3. On the Asset Management > Asset Configurations tab, click Authorize Now.

  4. On the RAM Quick Authorization page, click Confirm Authorization.

    image

Step 2: Enable an audit mode

  1. On the Asset Configurations tab, select a cloud product type, such as RDS.

  2. In the asset list, find the target asset and, in its Audit Mode column, select Cloud-native Audit Log Collection.

image

Enable traffic collection (agent)

A traffic collection agent captures, analyzes, and reports network traffic data for security detection, performance monitoring, or troubleshooting. It is typically deployed on network devices, servers, or virtual machines.

Install agent

  1. Log on to the Data Security Center console.

  2. In the left-side navigation pane, choose Data Auditing > Native Data Auditing.

  3. On the Asset Management > Asset Configurations tab, select a cloud product type.

  4. In the Audit Mode column for the target asset, select Traffic Collection (Agent).

  5. In the Enable Traffic Collection (Agent) panel, configure the network and install the agent.

    If an agent is already installed on a host, you do not need to install it again. You can click View Hosts With Installed Agents at the top of the panel.

    1. Configure network: Select the region and the VPC where you want to install the agent.

      If a network connection is not established for this VPC, click Establish Network Connection. In the confirmation message, click OK. After the network connection is established, click Next.

    2. Install agent: Select automatic deployment for an Alibaba Cloud ECS instance. Select manual deployment for a server outside of Alibaba Cloud.

      • Automatic deployment (recommended)

        1. On the Auto-deploy Agent sub-tab, if the PrivateLink Connection Status of the target asset is not Connected, click Establish Network Connection in the Actions column of the target instance.

          To perform this operation on multiple instances, select the instances and click Batch Establish Network Connection.

        2. After the PrivateLink Connection Status changes to Connected, click Auto Install in the Actions column.

          To perform this operation on multiple instances, select the instances and click Batch Auto Install.

          After the installation is successful, the Agent Status of the target asset changes to Running.

        Note

        If the target instance is not in the list, click Asset synchronization. After the synchronization is complete, retry the operation.

      • Manual Agent Deployment

        • On the Manual Agent Deployment sub-tab, deploy the agent by following the steps for your server's operating system.

          Windows

          1. On the Windows tab, click Download Installation Package.

            The installation package downloads to your browser's default directory.

          2. Log on to your Windows server.

          3. Upload the downloaded agent installation package to the Windows server.

          4. Decompress the agent installation package to a specified runtime directory and then run the installation application.

            Important

            The decompression path cannot contain special characters, including <space>, (), [], {}, ^, =, ;, !, ', +, ,, `, ~, and &. If you must run the script in a directory that contains special characters, run the script from a command prompt with administrator privileges.

          5. Select Install winpcap or Install npcap, and then click Next.

            1. If the database asset is an RDS or PolarDB instance, select Install winpcap.

            2. If the database asset is a self-managed database and the database application and the database reside on the same ECS instance, select Install npcap. Otherwise, select Install winpcap.

          6. Click Install and follow the prompts. Accept the default options to complete the installation.

          Linux

          1. On the Linux tab, click Download Installation Package.

            The installation package downloads to your browser's default directory.

          2. Log on to your Linux server.

          3. Upload the downloaded agent installation package to a specified directory on the Linux server.

            You can customize the directory where the agent installation package is stored.

          4. Run the tar -xf dbagent_linux_V2.29.tar.gz command to decompress the agent installation package.

            Replace dbagent_linux_V2.29.tar.gz with the actual file name of the installation package.

            Important

            The decompression path cannot contain special characters, including <space>, (), [], {}, ^, =, ;, !, ', +, ,, `, ~, and &. If you must run the script in a directory that contains special characters, run the script from a command prompt with administrator privileges.

          5. Go to the installation directory and run the ./install.sh command to install and enable the agent.

            Important
            1. Do not run the binary file directly.

            2. You must run the agent installation script as the root user and specify bash as the interpreter, or leave the interpreter unspecified.

            3. The ./install.sh command includes the start.sh operation. You only need to run ./install.sh. No further action is required.

  6. After completing the configuration, click OK.

Other actions

  • Collection Configuration: After the agent is running, you can click Collection Configuration in the Actions column to configure parameters such as Collection Direction, Rows Saved, and Maximum Save Length.

  • Agent Configuration: The traffic collection (agent) audit mode consumes server resources such as CPU, memory, and network bandwidth. After the agent is running, click Agent Configuration in the Actions column to manage its resource use and monitoring parameters. For more information, see Manage Agents.

Manage agents

  1. On the Asset Management tab, click the Agents tab.

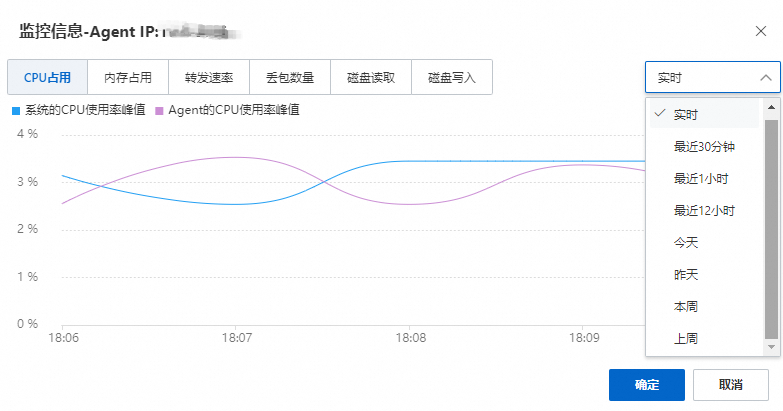
  2. View the resource consumption trend graph.

    1. In the Actions column for the target asset, click Monitoring.

    2. In the monitoring information dialog box, click the tab for the corresponding resource and select a time range in the upper-right corner to view its resource usage.

      image

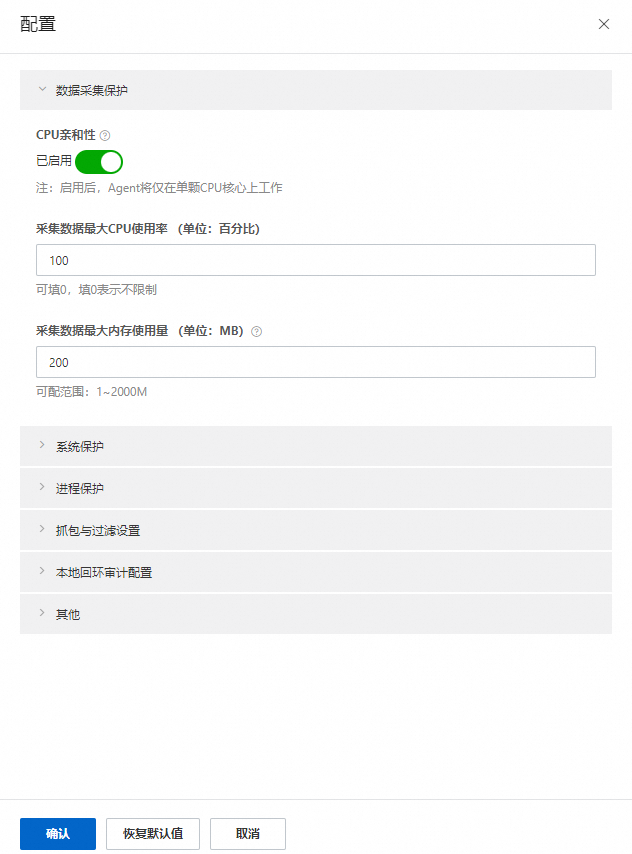
  3. Configure monitoring parameters for the agent.

    1. In the Actions column for the target asset, click Configuration.

    2. In the Configuration panel, expand the relevant configuration items and adjust the settings according to your server's operating conditions.

      image

      Parameter

      Description

      Data collection protection

      Limits on agent resource usage.

      • Cpu affinity

        CPU affinity keeps a process running on a designated CPU for as long as possible without being migrated to other processors. In a multi-core system, each CPU has its own cache to store process information. If a process is scheduled to run on a different CPU, the original cached information might not be usable, which lowers the cache hit ratio and degrades processing performance.

        When cpu affinity is enabled, the agent runs on a single CPU core. When it is disabled, the agent runs on multiple CPU cores, which may consume more CPU resources. This feature is enabled by default. We recommend keeping cpu affinity enabled.

        If you modify this configuration, the agent automatically restarts to apply the changes.

      • Maximum CPU utilization for data collection (unit: %)

        Sets the maximum CPU utilization for the agent. Default: 100%. Range: 0% to 100%. A value of 0 indicates no limit.

        The agent's CPU utilization will not exceed this value. Set a reasonable value to avoid incomplete audit data.

      • Maximum memory usage for data collection (unit: MB)

        Sets the maximum memory usage for the agent.

        The memory used by the agent to cache data packets will not exceed this value. If this value is set too low, it can result in incomplete audit data. The default value is 200 MB. This value cannot exceed 2,000 MB or the device's total memory, whichever is less.

      System protection

      If any system resource exceeds its specified threshold, the agent pauses its operation until all metrics fall below their thresholds.

      • CPU utilization threshold (unit: %)

        Default: 100%. Range: 0% to 100%. A value of 0 indicates no limit.

      • Memory usage threshold (unit: %)

        Default: 100%. Range: 0% to 100%. A value of 0 indicates no limit.

      • System disk read IO threshold (unit: KB/s)

        Default: 0, which indicates no limit. This value cannot exceed the maximum read rate of the system disk.

      • System disk write IO threshold (unit: KB/s)

        Default: 0, which indicates no limit. This value cannot exceed the maximum write rate of the system disk.

      Process protection

      If the agent's CPU or memory usage exceeds the specified value, the agent automatically recovers from the anomaly.

      • CPU exception protection threshold (unit: %)

        Under normal conditions, the agent's CPU usage will not exceed the configured limit. This setting serves as a safeguard against unexpected situations.

        The default value is 100%. A value of 0 disables the CPU exception protection feature.

      • Memory exception protection threshold (unit: MB)

        This setting serves as a safeguard against unexpected situations. The default value is 300 MB. A value of 0 disables the memory exception protection feature.

      Packet capture and filtering settings

      No configuration is required by default. The agent captures traffic based on the IP addresses configured in Asset Management. In special scenarios, the agent can collect traffic from specific network interfaces based on these settings.

      • Packet capture network port

        Specify the network port for packet capture. Separate multiple port names with spaces.

        After setting this parameter, the data audit service captures traffic only from the specified network ports. If this parameter is not set, the data audit service captures traffic from all network ports by default.

      • Packet capture filter string

        Sets the filter string for packet capture.

        After you configure this setting, the data audit service no longer captures packets based on the configured assets. Instead, it only captures traffic on the specified network ports that matches this filter string. Example: (host 192.168.1.100 and port 3306) or (host 192.168.1.101 and port 3306).

      • Filter by tool

        After you configure this parameter, the data audit service no longer forwards traffic from the specified client tools. You can enter multiple tool names, separated by commas. Example: JDBC,Navicat Premium.exe.

      • Filter by account

        After you configure this parameter, the data audit service no longer forwards traffic from the specified database accounts. You can enter multiple account names, separated by commas. Example: root,sa.

      Local loopback audit configuration

      If the agent is installed on the database server and receives access requests that do not use a TCP connection, you can configure local audit to monitor local, non-TCP/IP database access.

      Note

      Local audit supports auditing of non-network database communications, such as inter-process communication. It currently supports only specific versions of Oracle, PostgreSQL, MySQL, SQL Server, and DB2.

      • Loopback port

        Sets the name of the loopback port.

        If this parameter is not set, the loopback port name is automatically detected. We recommend leaving this parameter unset.

      • Loopback packet capture filter string

        Sets the filter string for loopback packet capture.

        After you configure this setting, the agent stops capturing packets based on the configured assets. Instead, it only captures traffic on the loopback port that matches this filter string. Example: (port 3306) or (port 3307).

      • Loopback port replacement IP (v4)

        Sets the IPv4 address for local loopback.

        After setting this address, the data audit service replaces the local loopback IPv4 address in network traffic with this address. If this parameter is not set, the data audit service makes no changes.

      • Loopback port replacement IP (v6)

        Sets the IPv6 address for local loopback.

        After setting this address, the data audit service replaces the local loopback IPv6 address in network traffic with this address. If this parameter is not set, the data audit service makes no changes.

      Other

      Other agent configurations

      • Debug mode

        Enable or disable debug mode.

        When enabled, the data audit service records more detailed debug logs.

      • Encryption in transit

        Enable or disable encryption in transit.

        When enabled, the agent encrypts the data it forwards.

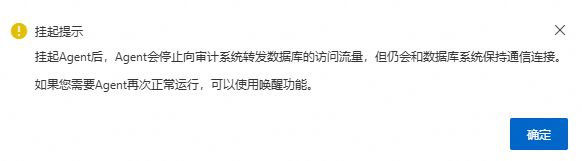
  4. Suspend, stop, or uninstall the agent on a target asset.

    1. In the Actions column for the target asset, click the image icon, and then click Suspend, Stop, or Uninstall.

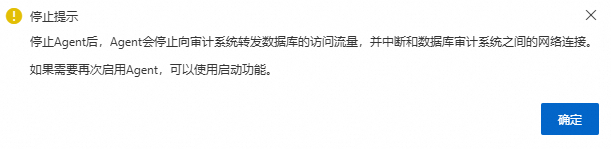
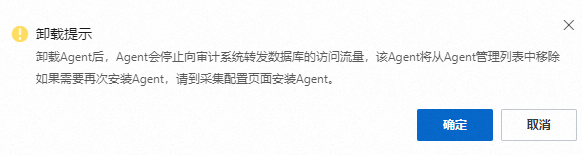
    2. In the dialog box that appears, review the impact of the Suspend, Stop, or Uninstall operation, and then click OK.

      • Suspend

        image

      • Stop

        image

      • Uninstall

        image

Other operations

  • Network Management:

    1. In the upper-right corner of the list, click Network Management.

    2. In the Network Management panel, enable or disable the VPC network connection.

  • Install Agent: In the upper-right corner of the list, click Install Agent to install an agent on an asset in the target VPC. For more information, see Install Agent.

Configure audit alerts

  • By default, DSC provides built-in audit rules for data assets, including database audit rules, OSS audit rules, and MaxCompute audit rules. DSC also supports custom audit rules. After you enable audit alert rules, you can use audit logs to detect risks such as abnormal operations, data breaches, vulnerability attacks, and SQL injections. For more information, see Configure and enable audit alert rules.

  • After you enable audit alert rules, DSC reports matching behaviors as DSC audit alerts. You can use the alert information and audit logs to analyze and handle related risks. For more information, see View and handle audit alerts.

FAQ

Q: Does enabling native log collection affect database performance? If so, what is the impact?

A: Yes, but the impact is negligible.

The impact on resources is as follows:

  • CPU and memory: Consumption is negligible.

  • Storage space: This is mainly used to store audit information. However, the data audit feature provided by DSC uses the storage space provided by DSC and does not occupy the storage space of the database instance.

  • Network: It does not affect network performance.

  • Disk performance: It does not affect disk performance because audit data is stored in DSC, not on the database instance's disk.

Q: How do I configure a whitelist for audit alerts?

A: You can add IP addresses and accounts that access your data assets to a whitelist. DSC will not generate audit alerts for access from these whitelisted entries. This helps you reduce false positives. For more information, see Manage whitelists.

Related documents

  • After you configure the audit mode for a data asset, you can view its audit logs on the Log Analysis page. For more information, see View audit logs.

  • Data Security Center saves audit logs for online queries to its storage space. You can view your current storage usage and manage storage rules for online and archived logs. For more information, see Manage log storage.