This topic describes how to view the stack and heap memory information of an application pod in the EDAS console. You can use this information to troubleshoot performance issues, such as high CPU usage or deadlocks.
Procedure
Log on to the EDAS console. In the navigation pane on the left, click Application Management > Application List.
In the top menu bar, select a region and a microservices namespace. From the Cluster Type drop-down list, select K8s Cluster. Find the application that you want to manage and click its name to go to the Application Overview page.
In the upper-right corner of the Application Overview page, click Configuration Details.
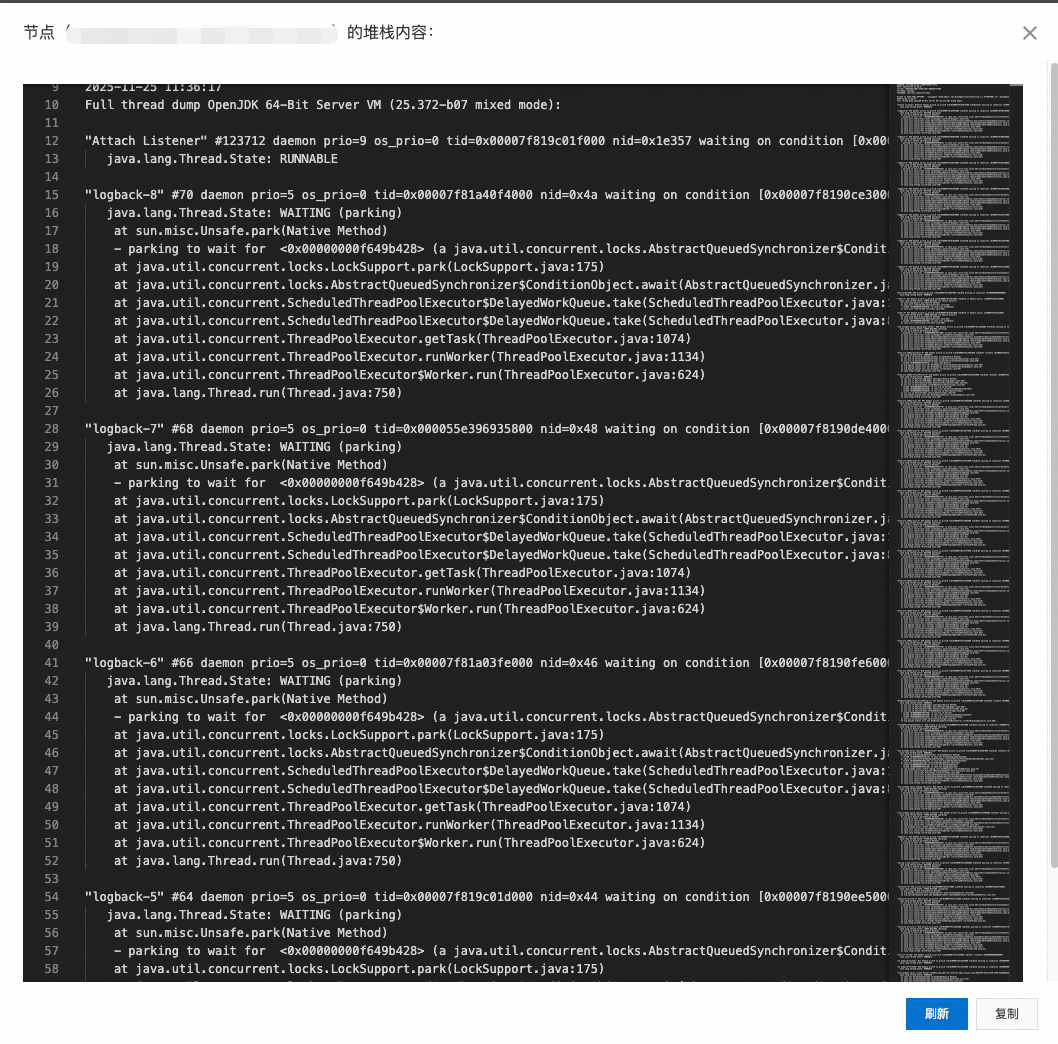
On the Application Configuration Details page, in the Container Group (Pod) area, find the target pod instance. In the Actions column, click More and select View Stack or View Memory Distribution.
Viewing stack information:
Memory distribution