Customize and subscribe to operations reports
Operations reports provide the offline analytics data of your accelerated domain names over different time periods. Use this data to understand how your accelerated domain names are running and to analyze the status of your business.
Prerequisites
An accelerated domain name is added. If you have not added one, add it as described in Add a service domain name.
Features
By default, operations reports collect and display user access data such as PV/UV, Regions and ISPs, Domain Names, Popular Referer Headers, Popular URLs, , and Top Client IPs. Customize and subscribe to reports based on your business requirements. The following table describes each type of report content.
Report content | Description |
PV/UV | Query the PV and UV of a domain name by time. |
Regions and ISPs | View the access region distribution and the ISP distribution of users in the Chinese mainland, China (Hong Kong), Macao (China), Taiwan (China), and regions outside China over a specified time range. |
Domain Names | Displays the access ranking of each accelerated domain name, including the percentage, traffic or peak bandwidth, time of peak, and number of requests. Note The minimum granularity for a domain name ranking query is one day. For example, after you select a date to query, the system displays the top 200 records for that date. |
Popular Referer Headers | Displays the traffic, traffic percentage, number of requests, and request percentage of popular Referers used for hotlink protection. Note When the operations report feature analyzes user logs, it collects statistics on the |
Popular URLs | Query the popular URLs of a specified domain name for a specified status code and date, including the traffic, traffic percentage, number of requests, and request percentage. Note The minimum granularity for a popular URL query is one day. For example, after you select a date to query, the system displays the top 3,000 records for that date. |
Popular Back-to-origin URLs | Query the popular back-to-origin URLs of a specified domain name for a specified status code and date, including the traffic, traffic percentage, number of requests, and request percentage. Note The minimum granularity for a popular back-to-origin URL query is one day. For example, after you select a date to query, the system displays the top 100 records for that date. |
Top Client IPs | Query the top client IPs of a specified domain name for a specified region and date. You can sort the results by traffic or by number of requests. Note The minimum granularity for top client IPs is one day. After you select a date to query, the system displays the top 200 records for that date if you query all regions, or the top 20 records for that date if you query a single region. |
After you subscribe to operations reports, Alibaba Cloud DCDNperiodically sends report emails to your mailbox. The traffic data in these reports is measured in bytes.
Considerations
Before you customize or subscribe to operations reports, review the following items:
Customization comes first — The system generates statistics only for the domain names and the report content that you customize. If you have not customized the reports, the subscription fails.
Subscription quota — The subscription feature is in trial operation. Each Alibaba Cloud account, including its Resource Access Management (RAM) users, can create a maximum of five subscription tasks.
Data latency — Because of log integrity latency, operations report data is delayed by more than 6 hours. If you create an operations report on Day T, you can obtain the report data for Day T+1 and later, but not for Day T or earlier. Therefore, the report data for Day T+1 is available only after 06:00 on Day T+1. For a subscription, the system sends a report only after it collects all the data.
Data generation intervals — The generation interval varies by metric from 1 to 6 hours:
Popular URL (sorted by number of requests or traffic): 6 hours
Popular Referer (sorted by number of requests or traffic): 1 hour
Popular back-to-origin URL (sorted by number of requests or traffic): 1 hour
Top client IP (sorted by number of requests or traffic): 6 hours
Ranking of domain names (sorted by traffic only): 1 [TODO: confirm time unit]
PV/UV: 1 hour
Access region distribution: 1 hour
ISP distribution: 1 hour
Console display — Other report data is not displayed in the console by default. Subscribe to those reports, have them sent to a specified mailbox, and then query the data.
Customize an operations report
Customize an operations report so that the system starts to generate statistics for the domain names and the report content that you select.
Log on to the DCDN console.
In the left-side navigation pane, choose Operations Reports.
On the Operations Reports page, click Customize Operations Report.
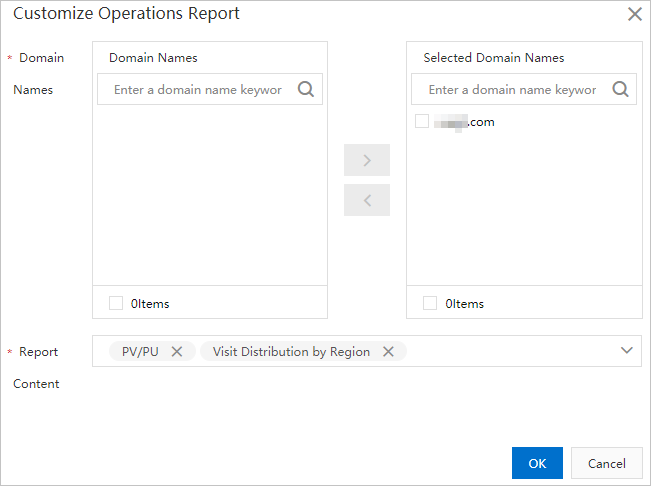
In the Customize Operations Report dialog box, configure the domain names and the report content.
Parameter
Description
Domain Names
Select the accelerated domain names for which you want to customize an operations report. You can select multiple domain names.
Report Content
Select the report content that you want to customize. You can select multiple items of report content.
Click OK to complete the report customization.
The system starts to generate statistics for the domain names and the report content that you selected. A customized report is usually available at about 06:00 on Day T+1. For example, a report that you customize on July 16, 2025 becomes available at about 06:00 on July 17, 2025.
If you remove a domain name or a report type from Customize Operations Report and cancel the customization, the subscription task no longer generates the corresponding data. Update the Tracking Tasks accordingly to remove the domain name or report type from the existing subscription, as described in Modify a subscription task.
Modify a customized operations report
Modify the Customize Operations Report settings when the domain names or the report content that you need changes.
Repeat the preceding steps to add or remove report content.
Subscribe to operations reports
Subscribe to operations reports to have them delivered by email. After you subscribe, the system sends the reports to the mailbox that you specify, and you can analyze the report content. Customize the report content before you subscribe, and check the subscription quota in Considerations.
Log on to the DCDN console.
On the Operations Reports page, click the Tracking Tasks tab.
On the Tracking Tasks tab, create a subscription task and configure the following parameters.

Parameter
Description
Task Name
Enter a name for the subscription task.
Report Type
Daily reports, weekly reports, and monthly reports are supported. Daily report: The system sends the report to your mailbox after the log data of the previous day is fully collected and calculated. Weekly report: Calculated by calendar week. The system sends the report to your mailbox after the log data of the week is fully collected and calculated. The report for the previous week is usually sent on Monday morning of the following week. Monthly report: Calculated by calendar month. The system sends the report to your mailbox after the log data of the month is fully collected and calculated.
Email Address
The email addresses that receive the operations reports. You can enter multiple email addresses separated by commas (
,).Domain Names
Select the accelerated domain names for which you want to subscribe to operations reports.
Report Content
Select the report content to which you want to subscribe.
Click OK. The system displays the message The tracking task is created..
After you subscribe to a report, if you delete an item of report content from the customization settings, that item is displayed abnormally as a report ID when you click Edit to view the subscription task. The report ID indicates that the report content is no longer customized and that you can no longer subscribe to it. You can find the mappings between report IDs and report names in Report mappings.
Modify a subscription task
Modify a subscription task on the Tracking Tasks tab.
Select the subscription task that you want to modify, click Edit, configure the settings as described in Subscribe to operations reports, and then click OK.
Disable a customized operations report
If you disable Customize Operations Report, all subscription tasks stop generating data, but the tasks remain on the Tracking Tasks tab. If your business no longer needs a subscription task, you can manually delete it on the Tracking Tasks tab, as described in Delete a subscription task.
Log on to the DCDN console.
On the Operations Reports page, click Disable Operations Report.
Click OK to disable the customized operations report.
Delete a subscription task
Delete a subscription task when your business no longer needs it. Disabling a customized operations report only stops data generation and keeps the subscription tasks, whereas deleting a subscription task removes the task.
Log on to the DCDN console.
On the Tracking Tasks tab, select the subscription task that you want to delete and click Delete.
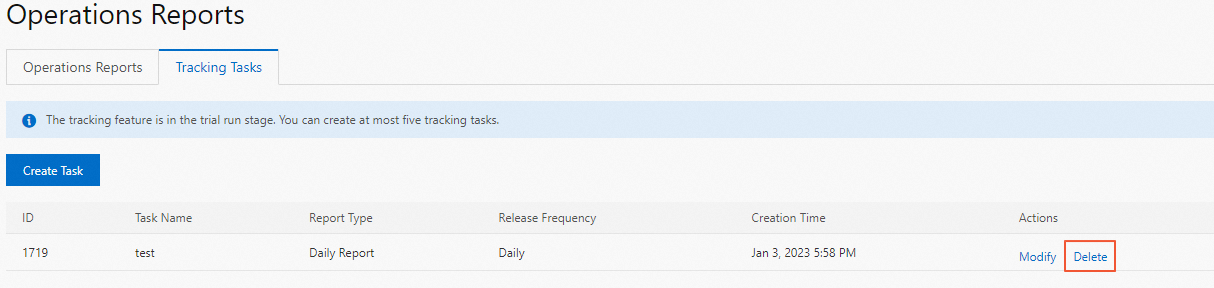
Click OK to delete the subscription task.
Report mappings
The following table describes the mappings between report IDs and report names. Use this table when a subscription task displays a report ID instead of a report name.
Report ID | English Name | Report Name | Calculation Method |
2 | TopUrlByAcc | Popular URL (sort by number of requests or traffic) | Counted by the number of URLs. |
4 | TopUrlByTraf | Popular URL (sort by number of requests or traffic) | Sorted by traffic. The traffic value includes the TCP packet header coefficient. For more information, see Why is the traffic amount found by using the Monitoring & Usage Analytics or Usage Statistics feature or the usage statistics feature different from the logged traffic amount?. |
6 | TopReferByAcc | Popular Referer (sort by number of requests or traffic) | Counted by the number of requests. |
8 | TopReferByTraf | Popular Referer (sort by number of requests or traffic) | Sorted by traffic. The traffic value includes the TCP packet header coefficient. |
10 | OriginTopUrlByAcc | Popular back-to-origin URL (sort by number of requests or traffic) | Counted by the number of URLs. |
12 | OriginTopUrlByTraf | Popular back-to-origin URL (sort by number of requests or traffic) | Sorted by traffic. The traffic value includes the TCP packet header coefficient. |
14 | TopIpByAcc | Top client IP (sort by number of requests or traffic) | Sorted by the number of requests from each client IP address. |
16 | TopIpByTraf | Top client IP (sort by number of requests or traffic) | Sorted by traffic. The traffic value includes the TCP packet header coefficient. |
18 | DomainByTraf | Ranking of domain names (sorted by traffic) | Sorted by the traffic of each domain name. |
20 | DomainPvUv | PV/UV | PV: Counted by the number of daily terminal accesses. UV: Counted by the number of unique IP addresses. Each IP address is counted only once. |
22 | AreaTrafStat | Access region distribution | Statistics on the distribution of a domain name in a specific region. |
24 | IspTrafStat | ISP distribution | Statistics on the distribution of a domain name for a specific ISP. |