DNS analytics
DNS analytics gives you insight into your website's DNS traffic. It helps you monitor key metrics, analyze trends, and visualize data from multiple dimensions. Use these insights to track the real-time status of your DNS services and adjust your business strategy.
Features
DNS analytics helps you analyze data across the following dimensions:
-
Multi-dimensional data insights: DNS analytics shows trends over time for key metrics such as total queries, average queries per second, and average processing time. This helps you understand website traffic patterns and identify peak and off-peak hours.
-
Performance and efficiency evaluation: Analyze metrics such as total queries and average processing time to evaluate content delivery efficiency and website health. This helps you quickly detect and resolve issues.
-
Resource optimization and planning: Use DNS data to plan bandwidth resources, optimize caching strategies, reduce origin server load, and improve service performance.
Metrics
Overview
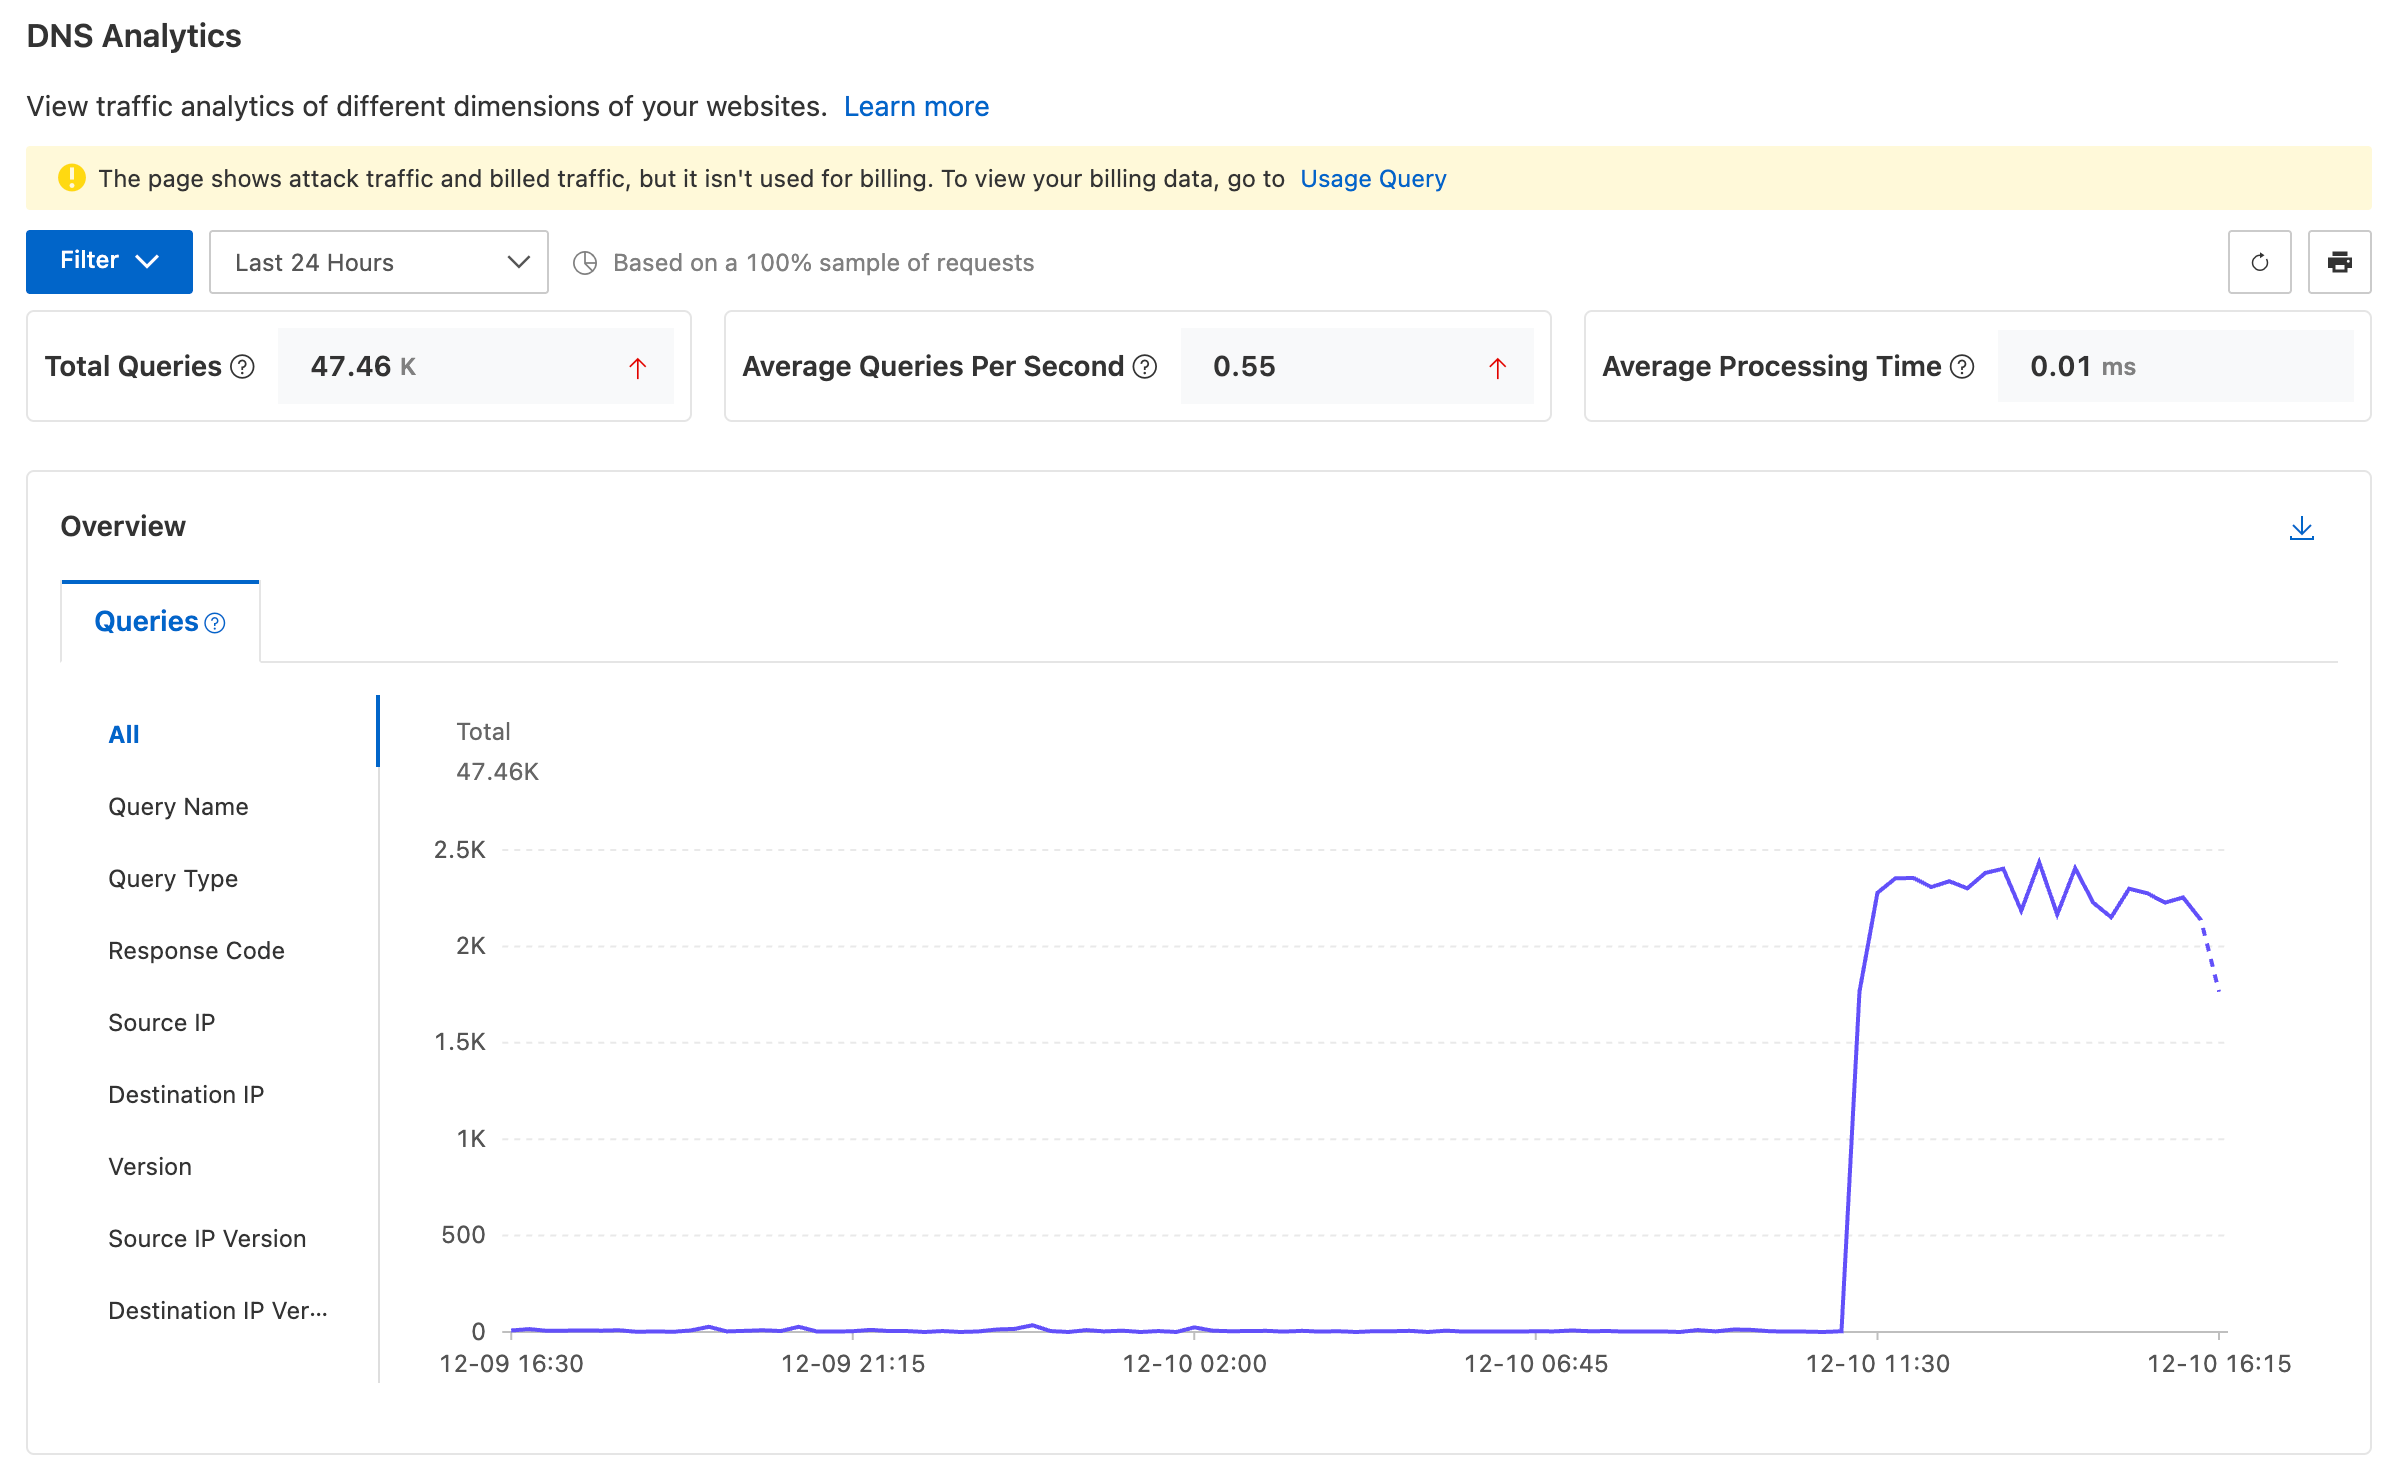
The overview panel features a line chart that visualizes different DNS query types, offering an intuitive way to analyze your website's historical access trends.
-
Total Queries: The total number of domain name resolution requests, such as those for accessing a website or sending an email, received and processed by ESA DNS servers.
-
Average Queries Per Second: The number of domain name resolution requests, such as those for accessing a website or connecting to a service, processed by the ESA DNS service per second.
-
Average Processing Time: The average time ESA DNS servers take to process a request, from receipt to response.
-
Metric change: The percentage change for a metric is a period-over-period comparison between the selected time range and the previous time range of the same length. If no data is available for the previous time range, the rate of change is not displayed.
For example, if you select Last 30 Days and the requests increased by 2.03%, this means the number of requests received by ESA servers in the last 30 days increased by 2.03% compared to the previous 30-day period.
Top data by dimension
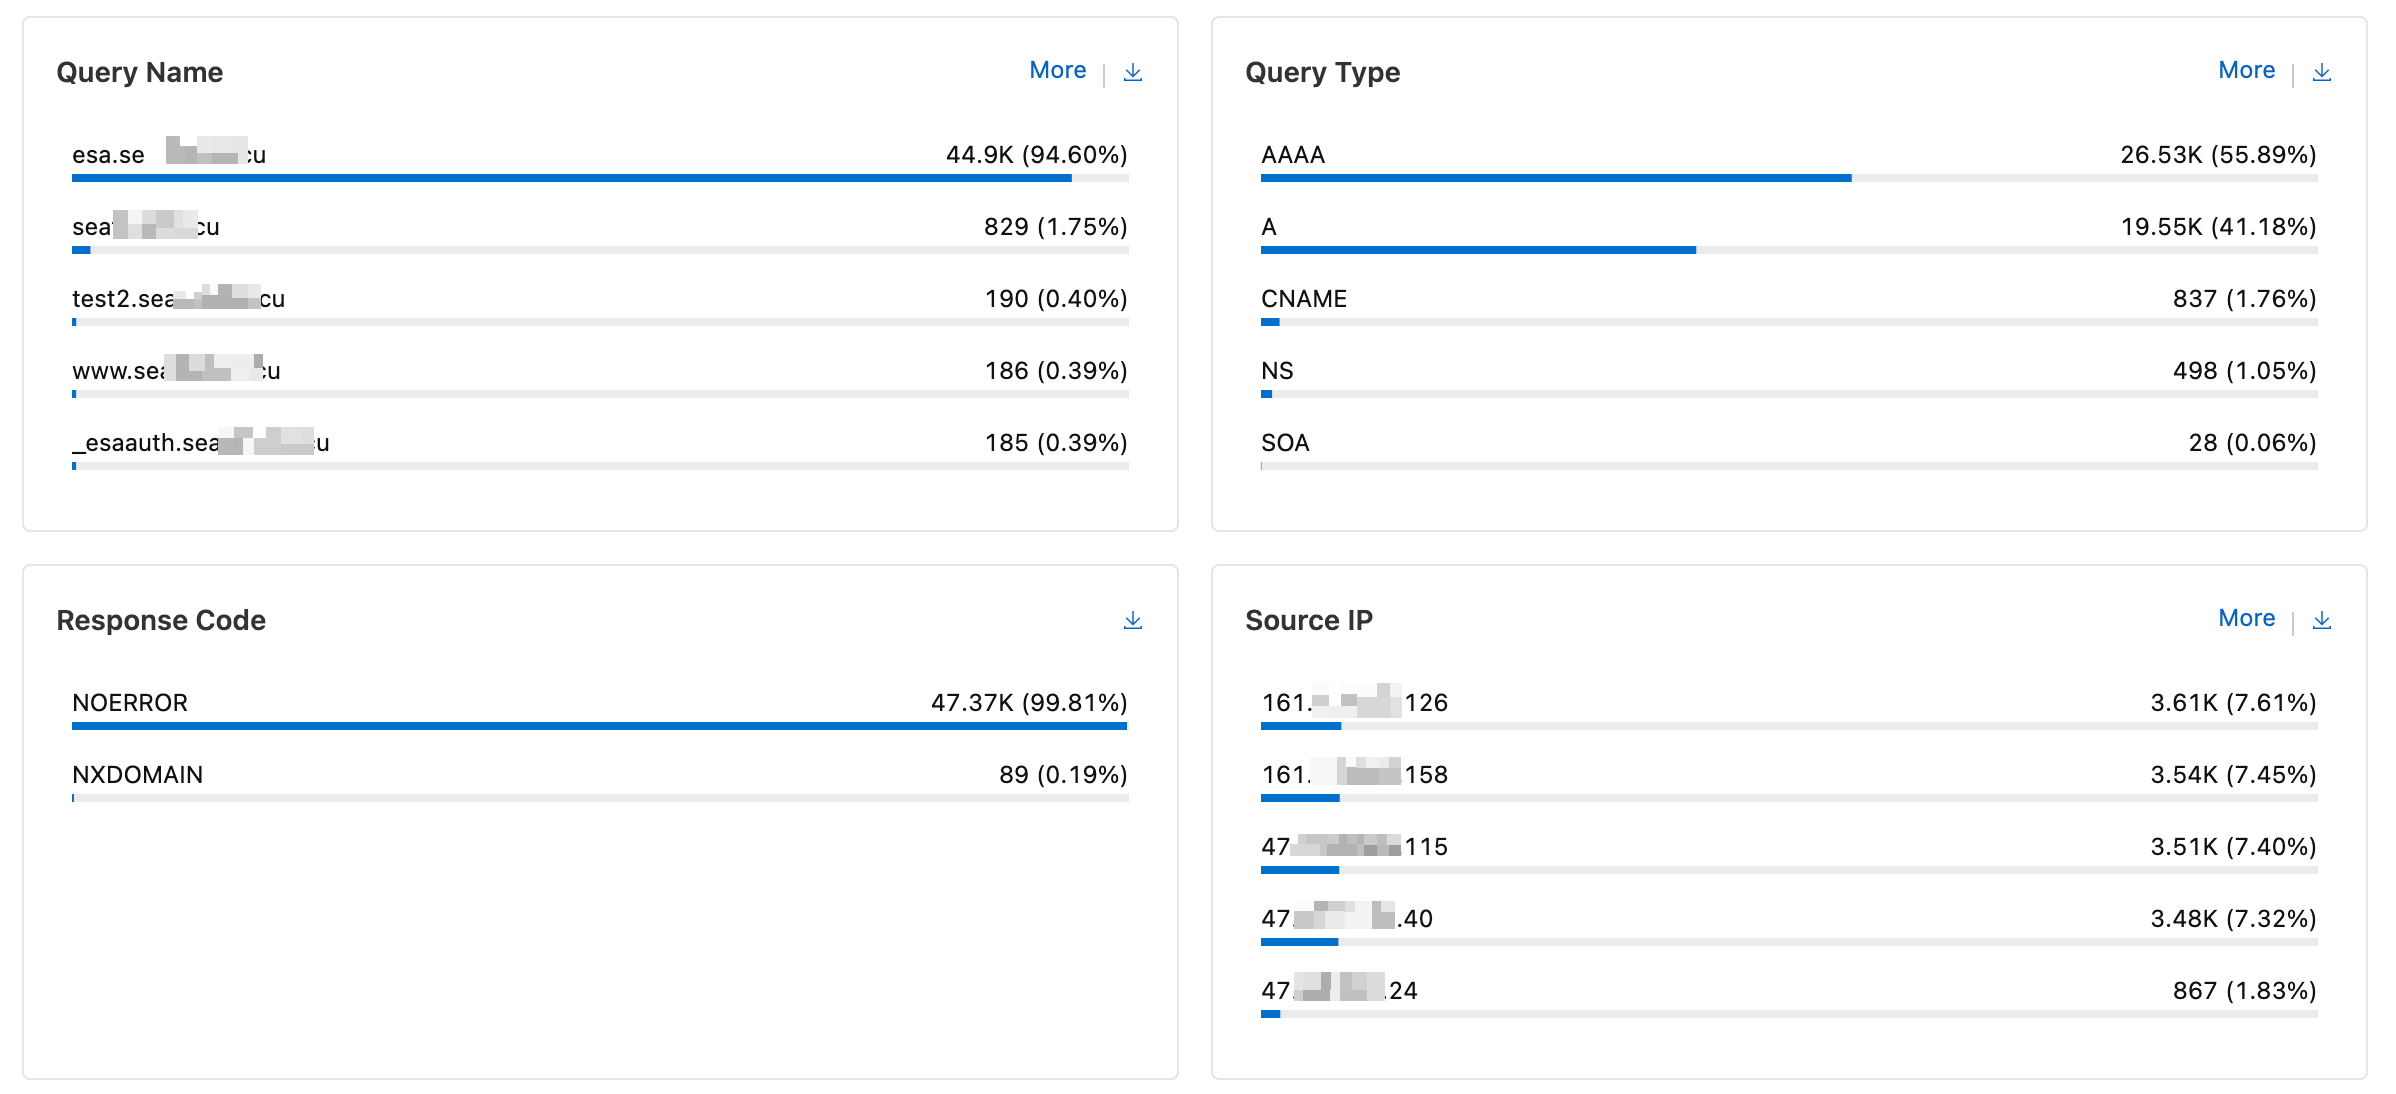
The DNS analytics feature analyzes query counts and user behavior across multiple dimensions. These panels provide an overview of DNS activity and user insights. You can select a time range to view detailed data and visualizations for these dimensions.
By default, DNS analytics displays the top 5 results. Click More to view additional results.
View the DNS analytics report
-
In the ESA console, select Websites. In the Website column, click the target website.
-
In the navigation pane on the left, select .
-
On the DNS Analytics page, view the total queries and average processing time. Click the
 icon to print the report or the
  icon to download the data. Use the filter to refine the data. For more information, see How to use filters.