ESA analyzes access logs and back-to-origin logs to provide multi-dimensional traffic analytics and visualizations for your website data to help you monitor business operations and support your business adjustments.
Benefits
Traffic analytics data comes from the access logs processed by ESA. These logs record information for every request that passes through an ESA node, including the client IP, request time, request type, and response status. By summarizing and analyzing these logs, ESA provides accurate traffic statistics and analysis reports.
Traffic analytics helps you analyze data from the following dimensions:
Geographic distribution analysis: Data distribution by country/region helps you understand the geographic origin of your traffic or requests. This information supports service optimization and market strategies for specific regions.
Performance and efficiency assessment: Analyze metrics such as page views and the number of error codes. This helps you evaluate content delivery efficiency and website health, allowing you to promptly identify and resolve issues.
Resource optimization and planning: Use data such as traffic volume and request counts to plan bandwidth resources. You can also optimize cache policies, reduce back-to-origin pressure, and improve service performance.
Security and compliance monitoring: Use metrics such as secure encrypted requests to improve your awareness of the security landscape and ensure data transmission security.
View and download reports
In the ESA console, select Websites. In the Website column, click the target website.
In the left navigation pane, choose .
On the Traffic Analytics page, view traffic statistics and analysis. You can also click the
 icon to print the page report or click the
  icon to download the data as a CSV file. You can filter the data. For more information, see How to use filter conditions.
Data metric descriptions
Overview
The Overview section contains line charts for total traffic and ESA response traffic. These charts provide intuitive traffic visualization to help you better analyze historical traffic trends.
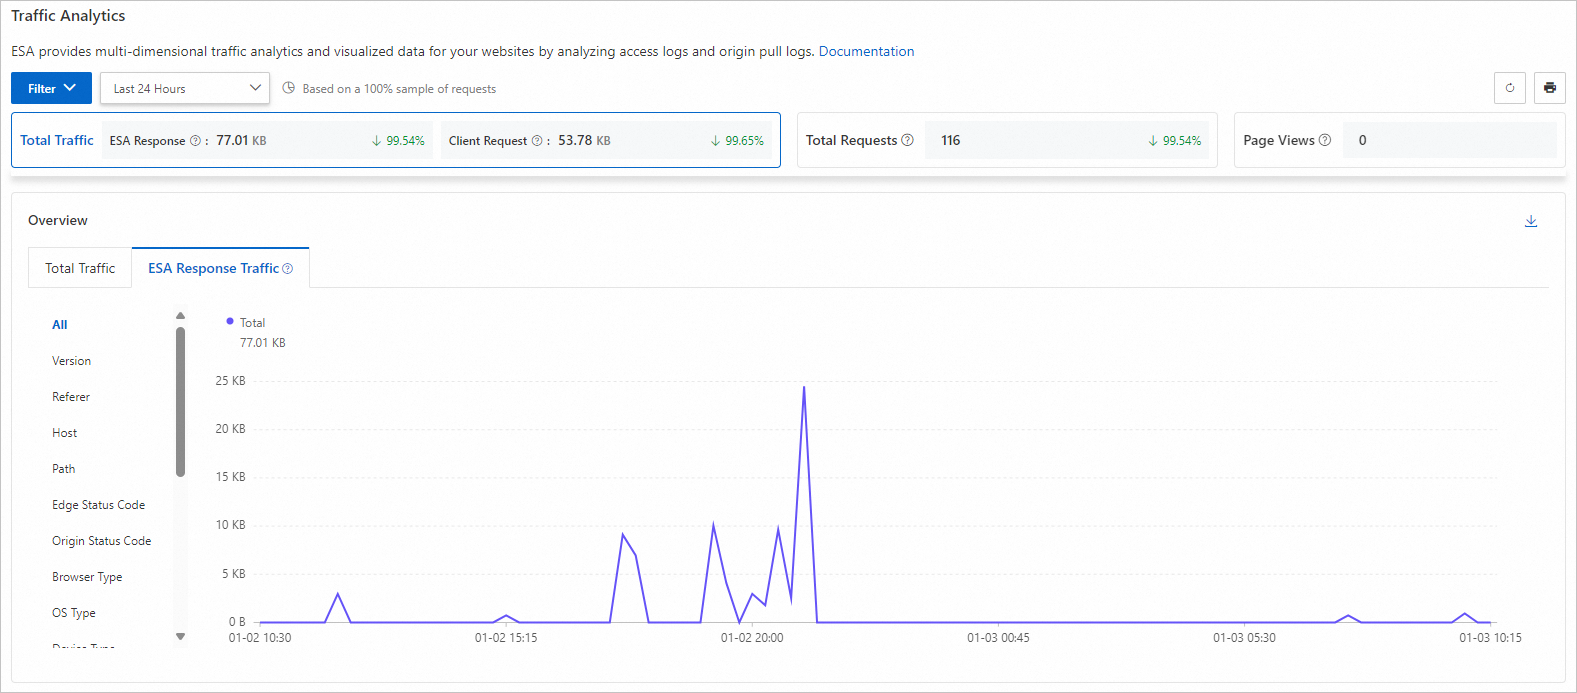
Total Traffic: All traffic transmitted from ESA to clients.
Total Requests: All requests that ESA receives from clients.
Page Views: The number of successful HTTP responses with a content type of HTML.
Metric change percentage: The percentage change for each data metric is a period-over-period comparison. It compares the data from the current time range with the data from the previous equivalent time range. If there is no data for the previous time range, the rate of change is not displayed.
For example, if you select the Last 30 Days time range, a 2.03% increase in requests means that the number of requests received by the ESA server in the last 30 days is 2.03% higher than the number of requests received in the preceding 30-day period (from 60 days ago to 30 days ago).
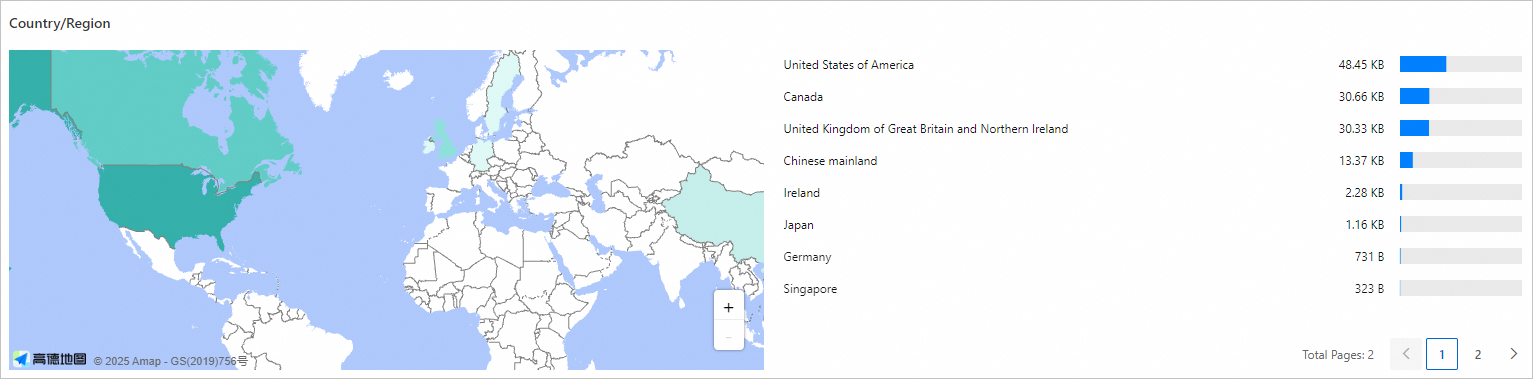
Country/Region
Use this section to understand the geographic distribution of your traffic in detail. This helps you more effectively target markets and optimize marketing strategies.
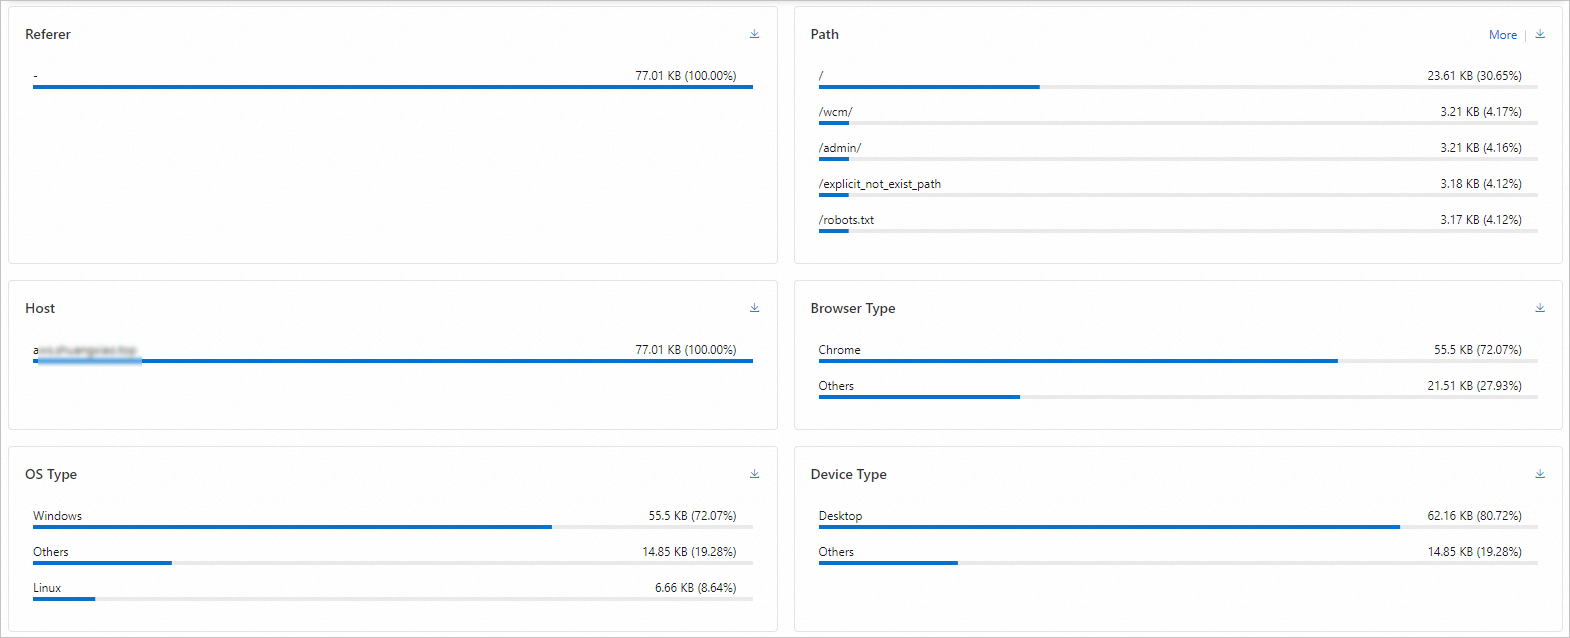
Top data by dimension
The traffic analytics feature provides analysis of traffic and user behavior across multiple dimensions. Together, these sections give you a comprehensive overview of traffic and insights into user behavior. You can select a time range to view detailed data and visualizations for these dimensions.
By default, traffic analytics displays the top 5 data entries. Click More to view more information.
Determine back-to-origin traffic using cache status
The ESA traffic analytics page does not currently have a separate entry for querying back-to-origin traffic. If you need to understand your back-to-origin traffic (for example, to assess origin load and bandwidth consumption after migrating from a Content Delivery Network (CDN) to ESA), you can indirectly determine it using the cache status dimension.
In the dimensional data on the traffic analytics page, the cache status dimension records the cache hit status for each request. A request with a cache status of MISS is a back-to-origin request. This means ESA needed to retrieve the content from the origin. By filtering for requests with a MISS cache status, you can indirectly calculate back-to-origin traffic and assess the actual load on your origin.
Traffic analytics protection example
Background: User A operates an online e-commerce platform. They notice that their website's access speed drops significantly during peak hours. Users report slow loading times, and some pages are even inaccessible. They suspect the issue is caused by network congestion from a traffic surge or a malicious traffic attack. The poor user experience leads to an increase in shopping cart abandonment rates.
Solution: User A decides to connect their website to ESA and use its traffic analytics feature to gain a deeper understanding of their traffic. In the ESA traffic analytics section, they identify client IPs. They discover that during peak hours, a large volume of abnormal requests from a specific IP address is causing high server load. User A takes immediate action. They use ESA's security features to create a WAF custom rule, add the IP address to a blocklist, and prevent it from accessing the website.
好的,我已理解您的要求。作为一名追求极致简洁的文案本地化专家,我将严格遵循您设定的工作流和核心约束,仅对 进行压缩和规范化,其余内容将保持原样。 分析开始... * : 文档中不含