FAQ about open source Elasticsearch
This topic answers frequently asked questions about open source Elasticsearch.
Overview
-
When I query an index, the "statusCode: 500" error is displayed. What do I do?
-
How do I change the value of the auto_create_index parameter?
-
How do I determine the number of shards when creating an index?
-
How do I change the time zone for data visualization in the Kibana console?
-
What are the precautions for using aliases in Elasticsearch?
-
What do I do if the too_many_buckets_exception error is returned during a query?
-
Can I change the value of the script.painless.regex.enabled parameter?
-
How do I use Elasticsearch scroll queries for large-scale data retrieval?
-
How do I find the role management entry in Kibana or modify index mappings?
How do I configure the thread pool size for indexes?
Before changing the thread pool size, confirm whether the write thread pool is under pressure. Run the following command to check:
GET /_cat/thread_pool?v=true&h=id,name,queue,active,rejected,completedA high ratio of rejected to completed tasks in the write thread pool indicates the queue size needs to be increased.
To configure the thread pool size, set the thread_pool.write.queue_size parameter in the YAML configuration file of your cluster. For more information, see Configure the YML file.
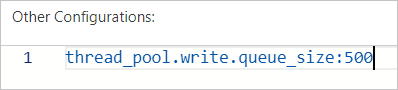
For Elasticsearch clusters earlier than version 6.X, use the thread_pool.index.queue_size parameter instead.
What do I do if Out of Memory (OOM) occurs?
Run the following command to clear the cache. Then, analyze the cause, and upgrade the configuration of your Elasticsearch cluster or adjust your business.
curl -u elastic:<password> -XPOST "localhost:9200/<index_name>/_cache/clear?pretty"| Parameter | Description |
|---|---|
<password> |
The password used to access your Elasticsearch cluster. Set during cluster creation or Kibana initialization. |
<index_name> |
The name of the index whose cache you want to clear. |
For instructions on upgrading, see Upgrade the configuration of a cluster.
How do I manually manage a shard?
Use the reroute API or Cerebro. For details on the reroute API, see Cluster reroute API.
What are the cache clearing policies for Elasticsearch?
Elasticsearch supports three cache clearing scopes:
-
Clear the cache of all indexes:
curl localhost:9200/_cache/clear?pretty -
Clear the cache of a specific index:
curl localhost:9200/<index_name>/_cache/clear?pretty -
Clear the cache of multiple indexes at once:
curl localhost:9200/<index_name1>,<index_name2>,<index_name3>/_cache/clear?pretty
How do I reroute index shards?
If shards are lost or misallocated, run the following command to move or reallocate them:
curl -XPOST 'localhost:9200/_cluster/reroute' -d '{
    "commands" : [ {
        "move" :
            {
              "index" : "test", "shard" : 0,
              "from_node" : "node1", "to_node" : "node2"
            }
        },
        {
          "allocate" : {
              "index" : "test", "shard" : 1, "node" : "node3"
          }
        }
    ]
}'
When I query an index, the "statusCode: 500" error is displayed. What do I do?
Use a third-party tool such as Cerebro to query the same index:
-
If the query succeeds in Cerebro, the index name is invalid. Rename the index. Index names can contain only letters, underscores (
_), and digits. -
If the query fails in Cerebro, the issue is in the index or cluster itself. Check whether the cluster contains the index and is running normally.
How do I change the value of the auto_create_index parameter?
Run the following command:
PUT /_cluster/settings
{
    "persistent" : {
        "action": {
          "auto_create_index": "false"
        }
    }
}The default value of auto_create_index is false, which prevents Elasticsearch from automatically creating indexes. Avoid changing this value — if you do, Elasticsearch may create excessive indexes with mappings or settings that do not match your expectations.
How long does it take to create a snapshot stored in OSS?
When shard counts, memory usage, disk usage, and CPU utilization are all at normal levels, creating a snapshot for 80 GB of index data takes approximately 30 minutes.
How do I determine the number of shards when creating an index?
You can divide the total data size by the data size of each shard to obtain the number of shards. We recommend that you limit the data size of each shard to 30 GB. If the data size of each shard exceeds 50 GB, query performance is severely affected.
You can appropriately increase the number of shards to speed up index creation. The query performance is affected no matter whether the number of shards is small or large.
-
Too many shards — more file handles and inter-node communication overhead, which slows queries.
-
Too few shards — each shard holds more data, which also slows queries.
When I use the elasticsearch-repository-oss plugin to migrate data from a self-managed Elasticsearch cluster, an error is displayed. What do I do?
Error message:
ERROR: This plugin was built with an older plugin structure. Contact the plugin author to remove the intermediate "elasticsearch" directory within the plugin zip.Solution: Rename the ZIP package from elasticsearch to elasticsearch-repository-oss, then copy it to the plugins directory.
How do I change the time zone for data visualization in the Kibana console?
Change the time zone directly in the Kibana console. The following example uses an Elasticsearch 6.7.0 cluster.
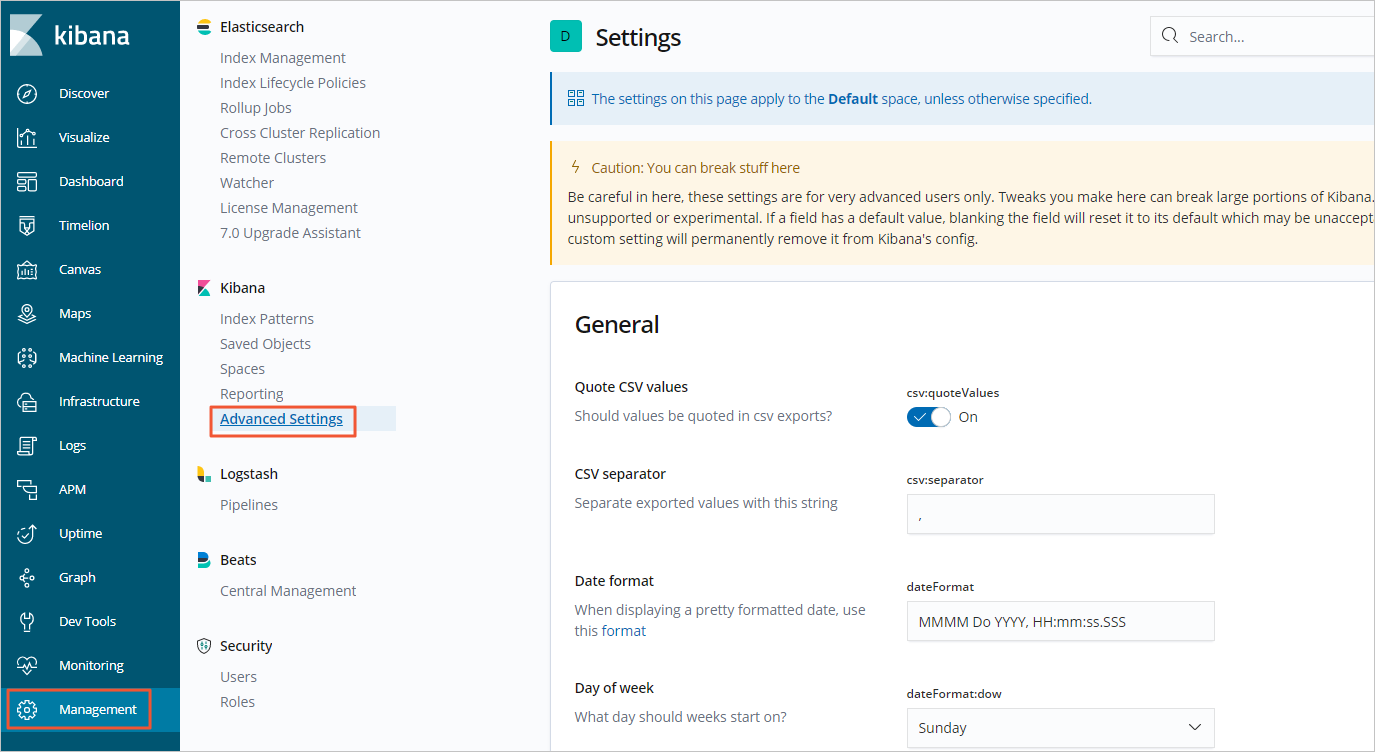
The following figure shows the selected time zone.

What type of data can I run Elasticsearch term queries on?
Term queries are word-level queries that work on structured data: numbers, dates, and keyword fields. They search inverted indexes directly without splitting text into tokens.
Use full-text queries for text fields — full-text queries tokenize the input before searching.
What are the precautions for using aliases in Elasticsearch?
The total number of shards across all indexes that share the same alias must be fewer than 1,024.
What do I do if the too_many_buckets_exception error is returned during a query?
Error message:
"type": "too_many_buckets_exception", "reason": "Trying to create too many buckets. Must be less than or equal to: [10000] but was [10001]"Reduce the size parameter for your bucket aggregations to stay within the 10,000-bucket limit. For details, see Limit the number of buckets that can be created in an aggregation. You can also follow the approach described in Increasing max_buckets for specific visualizations.
How do I delete multiple indexes at a time?
By default, Elasticsearch does not allow bulk index deletion. To enable it, run:
PUT /_cluster/settings
{
  "persistent": {
     "action.destructive_requires_name": false
  }
}
After this setting takes effect, use a wildcard to delete multiple indexes at once.
Can I change the value of the script.painless.regex.enabled parameter?
The default value is false. Regular expressions in Painless scripts consume significant resources, so keep this setting disabled unless you specifically need regex support in your scripts.
To enable regular expressions, set script.painless.regex.enabled to true in the elasticsearch.yml configuration file.
How do I change the mapping configurations, primary shard count, or replica shard count for an index?
Mapping configurations
Changing the mapping of an existing index requires reindexing. For supported field types, see Data field type.
Primary shards
The primary shard count cannot be changed after an index is created. If the current count no longer meets your needs, use the reindex API to migrate data to a new index with the correct shard count.
Replica shards
To change the number of replica shards for each primary shard, run:
PUT test/_settings
{
  "number_of_replicas": 0
}Plan both primary and replica shard counts before creating an index to avoid costly reindexing later.
How do I store the values of a field?
By default, Elasticsearch does not store individual field values — it stores only the _source field, which contains the full original JSON document and lets you retrieve any field at query time.
To store a specific field's values separately, set store: true in the field's mapping:
PUT /my_index
{
  "mappings": {
    "properties": {
      "my_field": {
        "type": "text",
        "store": true
      }
    }
  }
}Enabling field-level storage increases disk usage. Unless you have a specific reason to store field values separately, rely on _source instead.
How do I control whether a field is aggregatable?
Whether a field can be aggregated depends on its data type and whether the underlying field data (doc_values or fielddata) is enabled.
Fields that are aggregatable by default
Numeric, date, and keyword fields support aggregation via doc_values, which uses a column-oriented storage model optimized for sorting, aggregation, and scripting.
Text fields (not aggregatable by default)
To aggregate text fields, enable fielddata in the mapping:
PUT /my_index
{
  "mappings": {
    "properties": {
      "my_text_field": {
        "type": "text",
        "fielddata": true
      }
    }
  }
}Enabling fielddata loads all text data for that field into JVM heap memory, which significantly increases memory usage.
Disabling aggregation for a field
To prevent a field from being aggregated:
-
Set
enabled: falsefor the field in the mapping. -
Exclude the field from the document entirely.
What do I do if the "Unknown char_filter type [stop] for **" error is displayed when I configure Elasticsearch?
The stop type is a token filter, not a character filter. Placing it in the char_filter section causes this error.
Move the stop configuration from char_filter to the filter section of your analyzer:
"settings": {
  "analysis": {
    "analyzer": {
      "my_custom_analyzer": {
        "type": "custom",
        "tokenizer": "standard",
        "filter": [
          "lowercase",
          "stop"
        ]
      }
    },
    "filter": {
      "stop": {
        "type": "stop",
        "stopwords": "_english_"
      }
    }
  }
}
Also verify that all component types specified in char_filter, tokenizer, and filter are valid Elasticsearch filter types.
How do I determine whether my Elasticsearch ingest pipeline is a default_pipeline or a final_pipeline?
Elasticsearch provides two index-level settings to configure ingest pipelines: index.default_pipeline and index.final_pipeline. These settings differ in processing stage and override behavior.
default_pipeline
The index.default_pipeline setting specifies the ingest pipeline that is applied to indexing requests that do not explicitly specify a pipeline. If a request includes the ?pipeline= parameter, the request-specified pipeline takes precedence over the default pipeline.
final_pipeline
The index.final_pipeline setting specifies the ingest pipeline that always runs last. This pipeline is applied after both the default pipeline and any request-specified pipeline. Unlike the default pipeline, the final pipeline cannot be overridden by request-level parameters.
Check the current pipeline configuration
Run the following command to check which ingest pipelines are configured for a specific index:
GET /<index_name>/_settings?filter_path=*.settings.index.default_pipeline,*.settings.index.final_pipelineSample response:
{
  "<index_name>": {
    "settings": {
      "index": {
        "default_pipeline": "my_default_pipeline",
        "final_pipeline": "my_final_pipeline"
      }
    }
  }
}
If neither default_pipeline nor final_pipeline is returned in the response, no ingest pipeline is configured for the index.
How do I use Elasticsearch scroll queries for large-scale data retrieval?
The scroll API retrieves large numbers of results from a single search request. Unlike regular search, scroll maintains a point-in-time snapshot, which makes it suitable for bulk data export or batch processing. Do not use scroll for real-time user-facing search requests because scroll contexts consume cluster resources and are not optimized for low-latency queries.
Step 1: Initiate the initial scroll request
Send a search request with the scroll parameter to specify how long the scroll context should remain active. For example, 1m keeps the context for one minute.
POST /<index_name>/_search?scroll=1m
{
  "size": 1000,
  "query": {
    "match_all": {}
  }
}
The response includes a _scroll_id and the first batch of results. Save the _scroll_id for subsequent requests.
Step 2: Retrieve subsequent batches
Use the _scroll_id from the previous response to fetch the next batch of results.
POST /_search/scroll
{
  "scroll": "1m",
  "scroll_id": "<scroll_id_from_previous_response>"
}
Each response returns a new _scroll_id. Always use the most recent _scroll_id for the next request.
Step 3: Repeat until all data is retrieved
Continue calling the scroll API with the latest _scroll_id until the hits.hits array in the response is empty. An empty array indicates that all matching documents have been retrieved.
Step 4: Clear the scroll context
After all data is retrieved, explicitly clear the scroll context to free cluster resources.
DELETE /_search/scroll
{
  "scroll_id": "<scroll_id>"
}Scroll contexts consume cluster memory. Always clear scroll contexts when they are no longer needed, and set the shortest practical scroll timeout to minimize resource usage.
How do I find the role management entry in Kibana or modify index mappings?
Role management
To manage roles in Kibana, log on to the Kibana console of your Alibaba Cloud Elasticsearch instance through the visual console. In the Kibana left-side navigation pane, go to Stack Management > Security > Roles to create or edit roles.
Modify index mappings
For standard Elasticsearch instances (not Advanced Edition), index mappings cannot be modified directly in the Alibaba Cloud Elasticsearch console. To add new fields to an index mapping, perform the following steps:
-
Log on to the Kibana console of your Alibaba Cloud Elasticsearch instance through the visual console.
-
In the Kibana left-side navigation pane, go to Stack Management > Index Management and locate the target index.
-
In the Kibana left-side navigation pane, open Dev Tools.
-
Run a
PUTmapping request to add new fields to the index. Example:PUT /<index_name>/_mapping { "properties": { "new_field_name": { "type": "keyword" } } }
Elasticsearch only supports adding new fields to an existing mapping. Modifying the data type of an existing field is not supported. To change a field type, create a new index with the correct mapping and reindex the data from the original index.