This document explains how to use the Elastic Stack (Beats, Elasticsearch, Logstash, and Kibana) to collect, aggregate, and parse client SDK logs for Alibaba Cloud Message Queue for RocketMQ in a distributed environment, helping you quickly identify and resolve application development issues.
Background information
Alibaba Cloud Elasticsearch provides the full Elastic Stack (Elasticsearch, Logstash, Kibana, and Beats) for log aggregation, fast analysis, and data visualization. Compared to open source solutions, it provides the following advantages:
Data is transmitted over a private network for high speed and security.
The fully managed Elastic Stack requires no deployment and minimal maintenance. This eliminates the need to install and configure Beats collectors on each node and simplifies collecting scattered logs from distributed message middleware.
You can quickly add and remove Beats instances in the console to adapt to the elastic scaling of RocketMQ.
This solution uses Alibaba Cloud Message Queue for RocketMQ and Alibaba Cloud Elasticsearch. The solution architecture is shown in the following figure.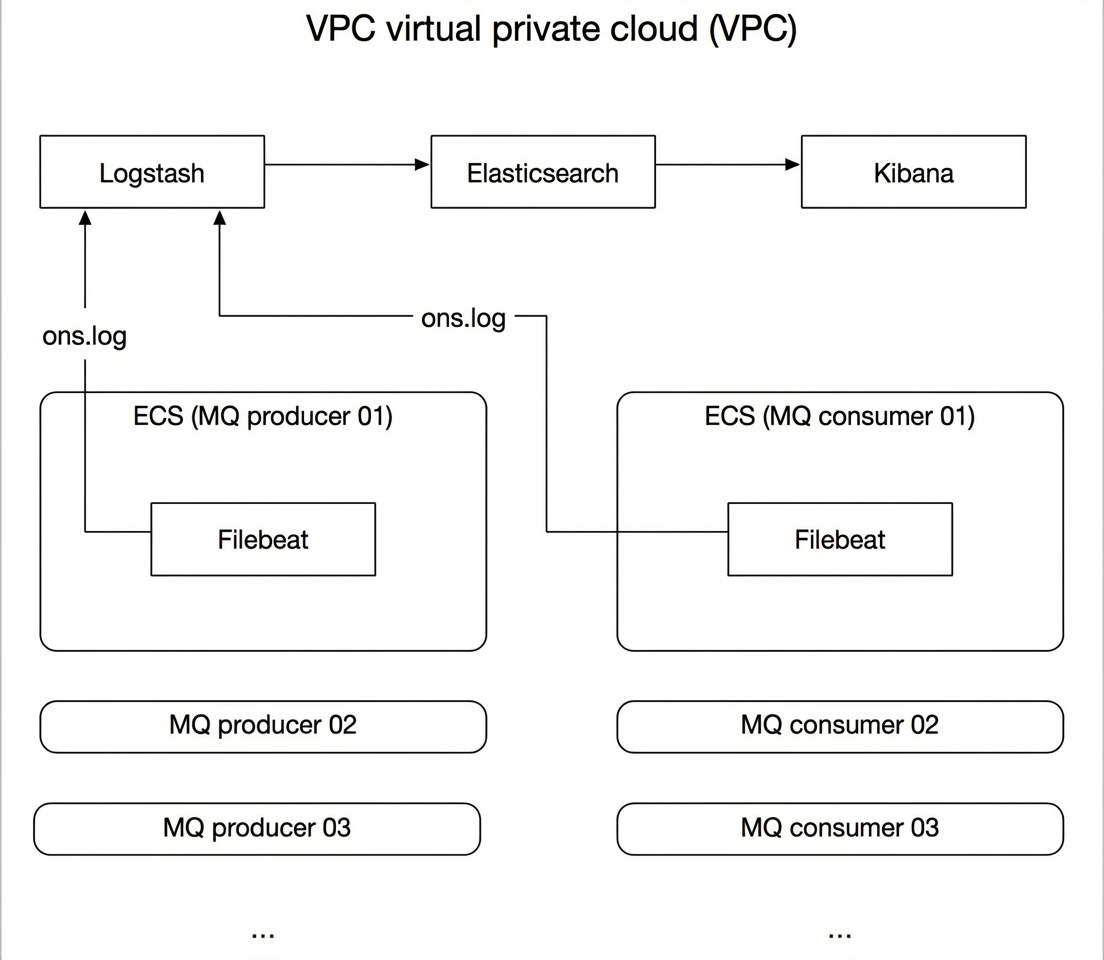
Procedure
Create an Alibaba Cloud Elasticsearch instance, a Logstash instance, and an ECS instance with Cloud Assistant and Docker installed. You also need to activate Alibaba Cloud Message Queue for RocketMQ. The resources serve the following purposes:
Alibaba Cloud Message Queue for RocketMQ: Provides RocketMQ resources, including an instance, a topic, and a group.
ECS instance: Hosts the Filebeat collector and runs a RocketMQ test project to generate client logs.
Alibaba Cloud Logstash instance: Uses a pipeline to sync logs collected by Filebeat to your Alibaba Cloud Elasticsearch instance.
Alibaba Cloud Elasticsearch instance: Analyzes and visualizes the logs.
ImportantMake sure that your Alibaba Cloud Elasticsearch instance, Logstash instance, and ECS instance are in the same Virtual Private Cloud (VPC).
Step 1: Create and configure a Filebeat collector
Use Filebeat to collect RocketMQ client logs and send them to Logstash.
Step 2: Create and run a Logstash pipeline
Use a pipeline configuration with the Grok filter plugin to process the RocketMQ client logs collected by Filebeat, and then sync them to your Alibaba Cloud Elasticsearch instance.
Step 3: Simulate RocketMQ client logs
Run a RocketMQ client test project on the ECS instance to generate log data.
Create an index pattern and view the log details on the Discover page in Kibana.
Step 5: Analyze logs in Kibana
This step shows how to analyze log data in Kibana by filtering for ERROR-level logs.
Prerequisites
Create an Alibaba Cloud Elasticsearch instance and enable automatic index creation.
For more information, see Create an Alibaba Cloud Elasticsearch instance and Access and configure an instance.
Create an Alibaba Cloud Logstash instance in the same VPC as the Alibaba Cloud Elasticsearch instance.
For more information, see Create a Logstash instance.
Activate Alibaba Cloud Message Queue for RocketMQ and create the required resources, including an instance, a topic, and a group.
For more information, see Activate Alibaba Cloud Message Queue for RocketMQ and grant permissions and Create resources.
Create one or more ECS instances in the same VPC as the Alibaba Cloud Elasticsearch and Logstash instances.
For more information, see Create an instance by using the wizard.
ImportantThe operating system of the ECS instance must be Alibaba Cloud Linux (Alinux), Red Hat, or CentOS. Beats supports only these three operating systems.
Install Cloud Assistant and Docker on the ECS instance.
For more information, see Install the Cloud Assistant agent and Deploy and use Docker.
ImportantCloud Assistant and Docker must be installed and running on the selected ECS instance. Beats installation depends on these two services.
Step 1: Create and configure a Filebeat collector
Log on to the Alibaba Cloud Elasticsearch console.
In the left-side navigation pane, click Beats Data Collection Center.
In the Create Shipper area, click ECS Logs.
Configure and install the shipper.
For more information, see Use Filebeat to collect logs from ECS instances and Configure the YML file of a shipper. This example uses the following configurations.
Parameter
Description
Shipper name
Enter a custom name for the shipper.
Installation version
Only version 6.8.5 is supported.
Shipper output
Specify the instance ID of the destination Alibaba Cloud Logstash instance. You do not need to specify the output again in the YML configuration.
Filebeat file directory
Enter the data source directory. You also need to enable log data collection and configure the log path in the YML configuration.
Shipper YML configuration
Enable log data collection. Change
enabledtotrue.Change
pathsto the specific log file path. Make sure it is consistent with the Filebeat file directory.Adjust the multiline options to handle multiline logs and Java stack traces.
 multiline.pattern: '^([0-9]{4}-[0-9]{2}-[0-9]{2})'
 multiline.negate: true
 multiline.match: after
 multiline.timeout: 120s #default 5s
 multiline.max_lines: 10000 #default 500
The complete filebeat.yml configuration is as follows.
###################### Filebeat Configuration Example #########################

#=========================== Filebeat inputs =============================

filebeat.inputs:

  # Each - is an input. Most options can be set at the input level, so
  # you can use different inputs for various configurations.
  # Below are the input specific configurations.

  - type: log

    # Change to true to enable this input configuration.
    enabled: true

    # Paths that should be crawled and fetched. Glob based paths.
    paths:
      - /root/logs/ons.log
      #- c:\programdata\elasticsearch\logs\*

    ### Multiline options

    # Multiline can be used for log messages spanning multiple lines. This is common
    # for Java Stack Traces or C-Line Continuation

    multiline.pattern: '^([0-9]{4}-[0-9]{2}-[0-9]{2})'
    multiline.negate: true
    multiline.match: after

    multiline.timeout: 120s #default 5s
    multiline.max_lines: 10000 #default 500

#==================== Elasticsearch template setting ==========================

setup.template.settings:
  index.number_of_shards: 3
  #index.codec: best_compression
  #_source.enabled: false

#================================ Processors =====================================

# Configure processors to enhance or manipulate events generated by the beat.

processors:
  - add_host_metadata: ~
  - add_cloud_metadata: ~
Click Next.
In the Shipper Installation configuration wizard, select the ECS instance on which you want to install the shipper.
The page lists the available ECS instances in the selected VPC, with details such as instance ID/name, status, operating system, IP address, and shipper status. Select the target ECS instance.
Start the shipper and check its installation status.
Click Start.
After a successful startup, the Startup Successful dialog box appears.
Click View in Collection Center to go to the Beats Data Collection Center page. In the Shipper Management area, view the Filebeat shipper that you started.
Wait for the Shipper Status to change to 1/1 Enabled, and then click View Running Instances in the Actions column.
On the View Running Instances page, check the Shipper Installation Status. When the Shipper Installation Status shows Heartbeat Normal, the shipper is installed successfully.
The shipper management table displays the shipper's ID, name, status, type, version, and output information. The View Running Instances panel shows the ECS instance ID, running status, operating system, IP address, and shipper installation status.
Step 2: Create and run a Logstash pipeline
Go to the Logstash Clusters page.
Navigate to the target cluster.
In the top navigation bar, select the region where the cluster resides.
On the Logstash Clusters page, find the cluster and click its ID.
In the left-side navigation pane, click Pipeline Management.
Click Create Pipeline.
On the Create Pipeline Task page, enter a pipeline ID and configure the pipeline.
This example uses the following configuration.
input {
    beats {
        port => 8000
    }
}
filter {
    grok    {
          match => {
              "message" => "%{TIMESTAMP_ISO8601:log_time} %{LOGLEVEL:log_level} %{GREEDYDATA:log_message}"
        }
    }
}
output {
  elasticsearch {
    hosts => "http://es-cn-4591jumei000u****.elasticsearch.aliyuncs.com:9200"
    user =>"elastic"
    password =>"<your_password>"
    index => "rocketmq-%{+YYYY.MM.dd}"
 }
}
input: The input plugin. The configuration above uses the beats plugin and specifies port 8000.
filter: The filter plugin. The configuration above provides a Grok filter example that parses RocketMQ client SDK logs to extract the
log_time,log_level, andlog_messagefields, making log analysis easier. You can also modify the content offilter.grok.matchbased on your needs.output: The output plugin. The configuration above uses the elasticsearch plugin. Its parameters are described in the following table.
Parameter
Description
hosts
The private endpoint of the Alibaba Cloud Elasticsearch instance. Set this to
http://<private_endpoint_of_the_Alibaba_Cloud_Elasticsearch_instance>:9200.NoteYou can obtain the private endpoint from the basic information page of your Alibaba Cloud Elasticsearch instance. For more information, see View the basic information of an instance.
user
The username to access the Alibaba Cloud Elasticsearch instance. The default is elastic. You can also use a custom user. For more information, see Manage user permissions by using Elasticsearch X-Pack roles.
password
The password to access the Alibaba Cloud Elasticsearch instance, which you set when creating the instance. If you forget the password, you can reset it. For information about how to reset the password, see Reset the access password of an instance.
index
The index name. Setting it to
rocketmq-%{+YYYY.MM.dd}creates a daily index with therocketmq-prefix, such asrocketmq-2020.05.27.
For more information about configuration settings, see Logstash configuration files.
Click Next step and configure the pipeline parameters.
Parameter
Description
Pipeline Workers
The number of worker threads to run the filter and output stages of the pipeline in parallel. If you have an event backlog or your CPU is underutilized, consider increasing this value to improve performance. Default value: the number of CPU cores in the instance.
Pipeline Batch Size
The maximum number of events a worker thread collects from inputs before executing filters and outputs. A larger batch size may lead to higher memory overhead. To use a larger batch size effectively, you may need to increase the JVM heap size by setting the LS_HEAP_SIZE variable. Default value: 125.
Pipeline Batch Delay
The duration in milliseconds to wait for each event before dispatching a small batch to a pipeline worker thread. Default value: 50 ms.
Queue Type
The internal queuing model for event buffering. Valid values:
MEMORY: The default value. This specifies a traditional in-memory queue.
PERSISTED: A disk-based persistent queue.
Queue Max Bytes
The maximum amount of data that the queue can store, in
MB. The value must be an integer from1to253-1. Default value:1024.NoteMake sure that this value is less than your total disk capacity.
Queue Checkpoint Writes
When the persistent queue is enabled, this is the maximum number of events that can be written before a checkpoint is forced. A value of 0 indicates no limit. Default value: 1024.
WarningAfter configuration, you must save and deploy the settings for them to take effect. This action triggers an instance restart. Proceed only if this restart will not impact your business.
Click Save or Save and Deploy.
Save: Saves the pipeline configuration but does not apply it. After saving, you are returned to the Pipelines page. In the Pipelines section, you can click Deploy Now in the Actions column to restart the instance and apply the configuration.
Save and Deploy: Saves and deploys the configuration, restarting the instance to apply the changes.
Step 3: Simulate RocketMQ client logs
Connect to the ECS instance on which Filebeat is installed.
For more information, see Connection methods.
Set up and run the Alibaba Cloud Message Queue for RocketMQ test project, send several test messages, and generate logs.
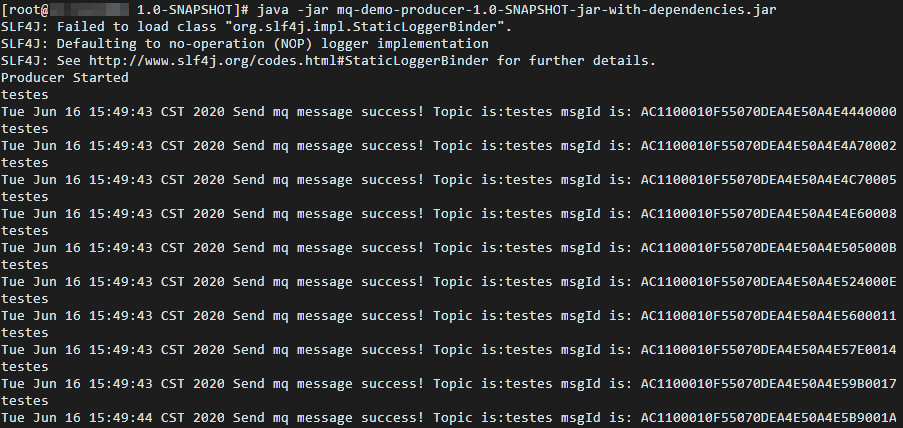
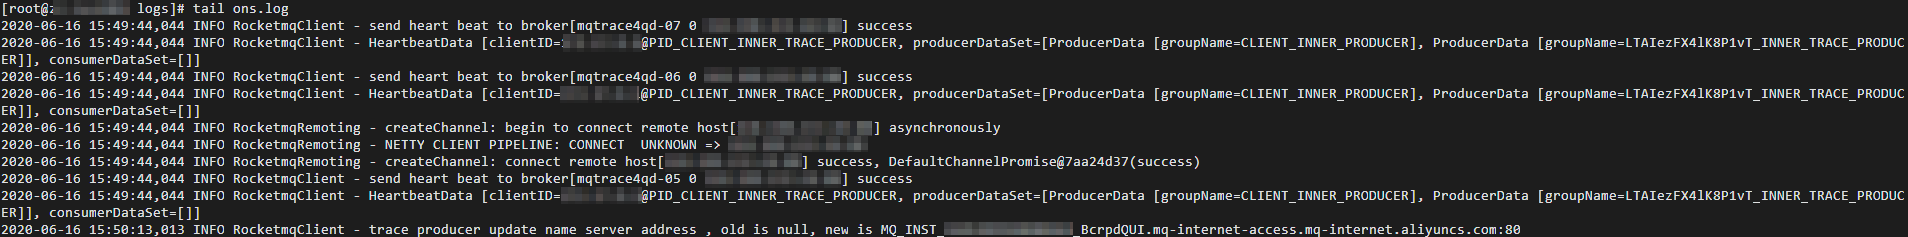
Step 4: View logs in Kibana
Log on to the Kibana console of the target Alibaba Cloud Elasticsearch instance.
For more information, see Log on to the Kibana console.
Create an index pattern.
In the left-side navigation pane, click Management.
In the Kibana section, click Index Patterns.
Click Create index pattern.
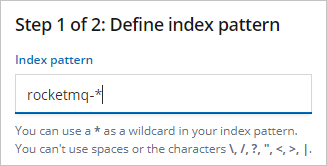
Enter an Index pattern (this example uses rocketmq-*) and click Next step.
Select a Time Filter field name (this example uses @timestamp) and click Create index pattern.
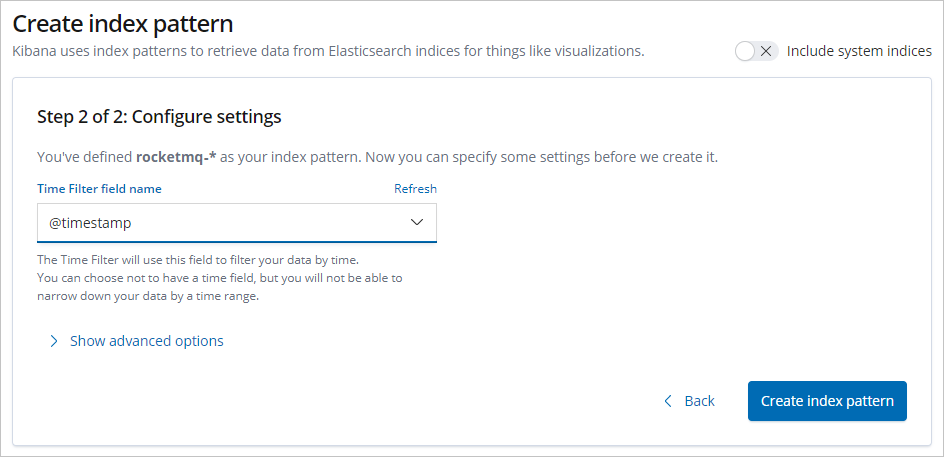 Note
NoteSelecting @timestamp as the time filter makes it easier to visualize log data with histograms and other charts.
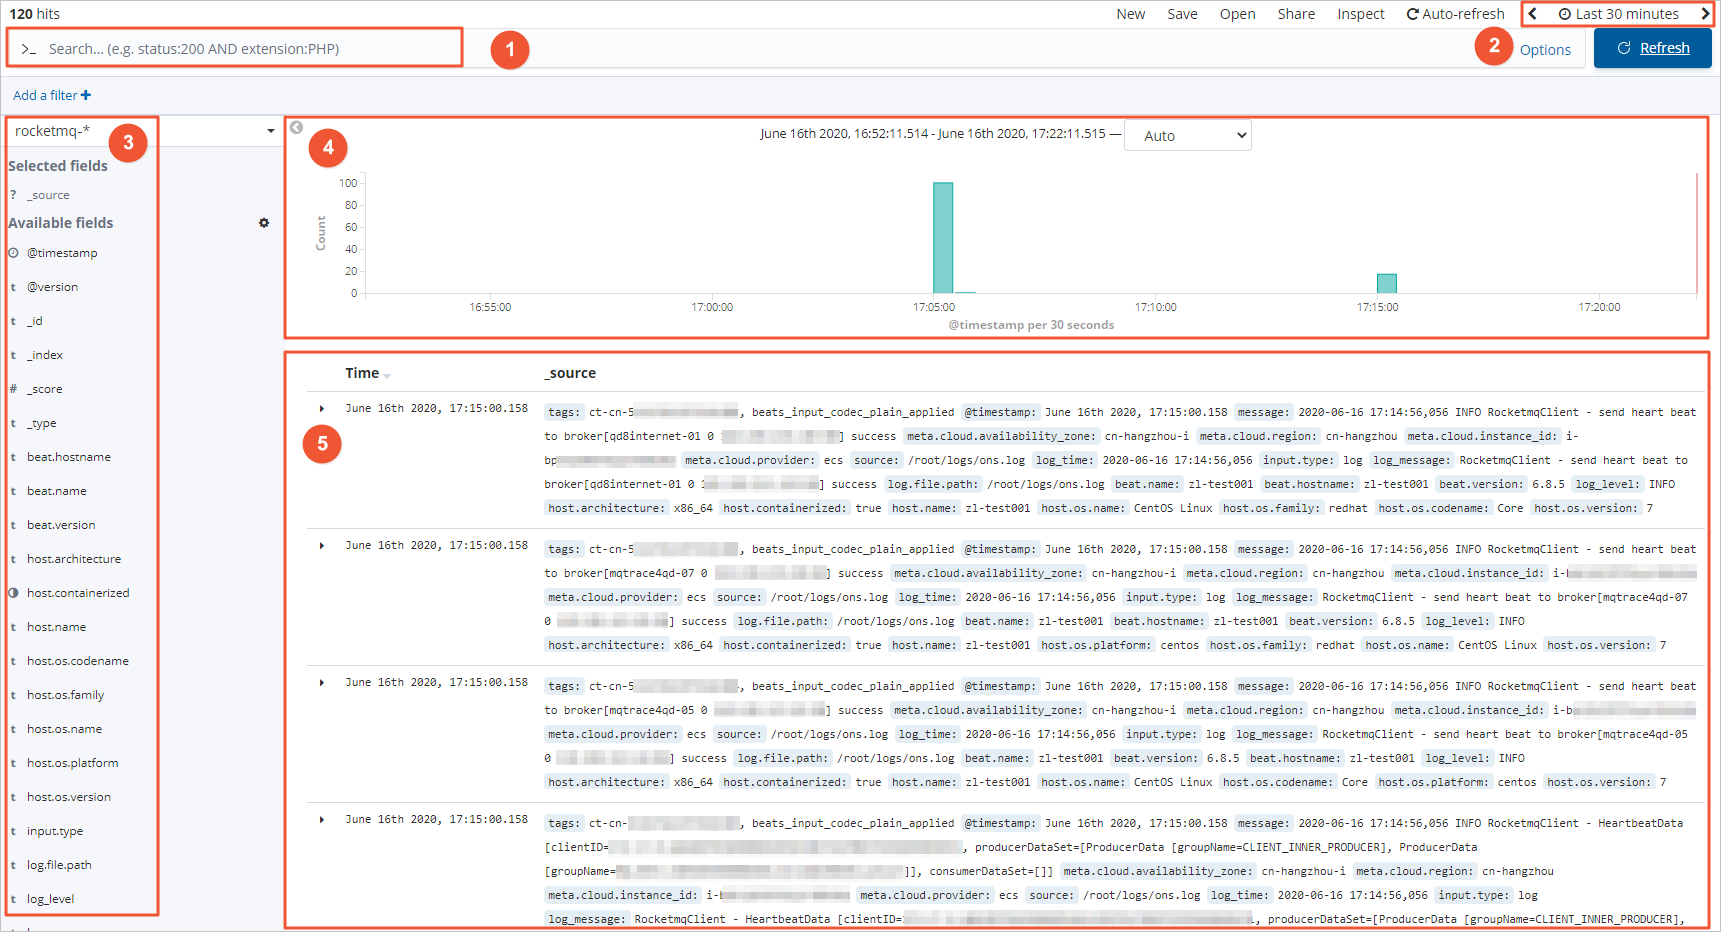
In the left-side navigation pane, click Discover.
From the dropdown list on the left side of the page, select the index pattern you created (rocketmq-*).
In the upper-right corner of the page, select a time range to view the log data collected by Filebeat during that period.

Area
Description
①
Query bar. You can enter a query that complies with the Kibana Query Language, such as
log_level:ERROR.②
Time and refresh frequency controls. Use these to select a time range and set the refresh frequency.
③
Field selector area. You can select the fields to be displayed.
④
Histogram. Displays the data distribution over time.
⑤
Data display area. You can view the data for the selected fields.
Step 5: Analyze logs in Kibana
Developers often need to investigate ERROR logs. This section demonstrates how to filter for ERROR-level logs by simulating an error: deleting the topic in the RocketMQ console.
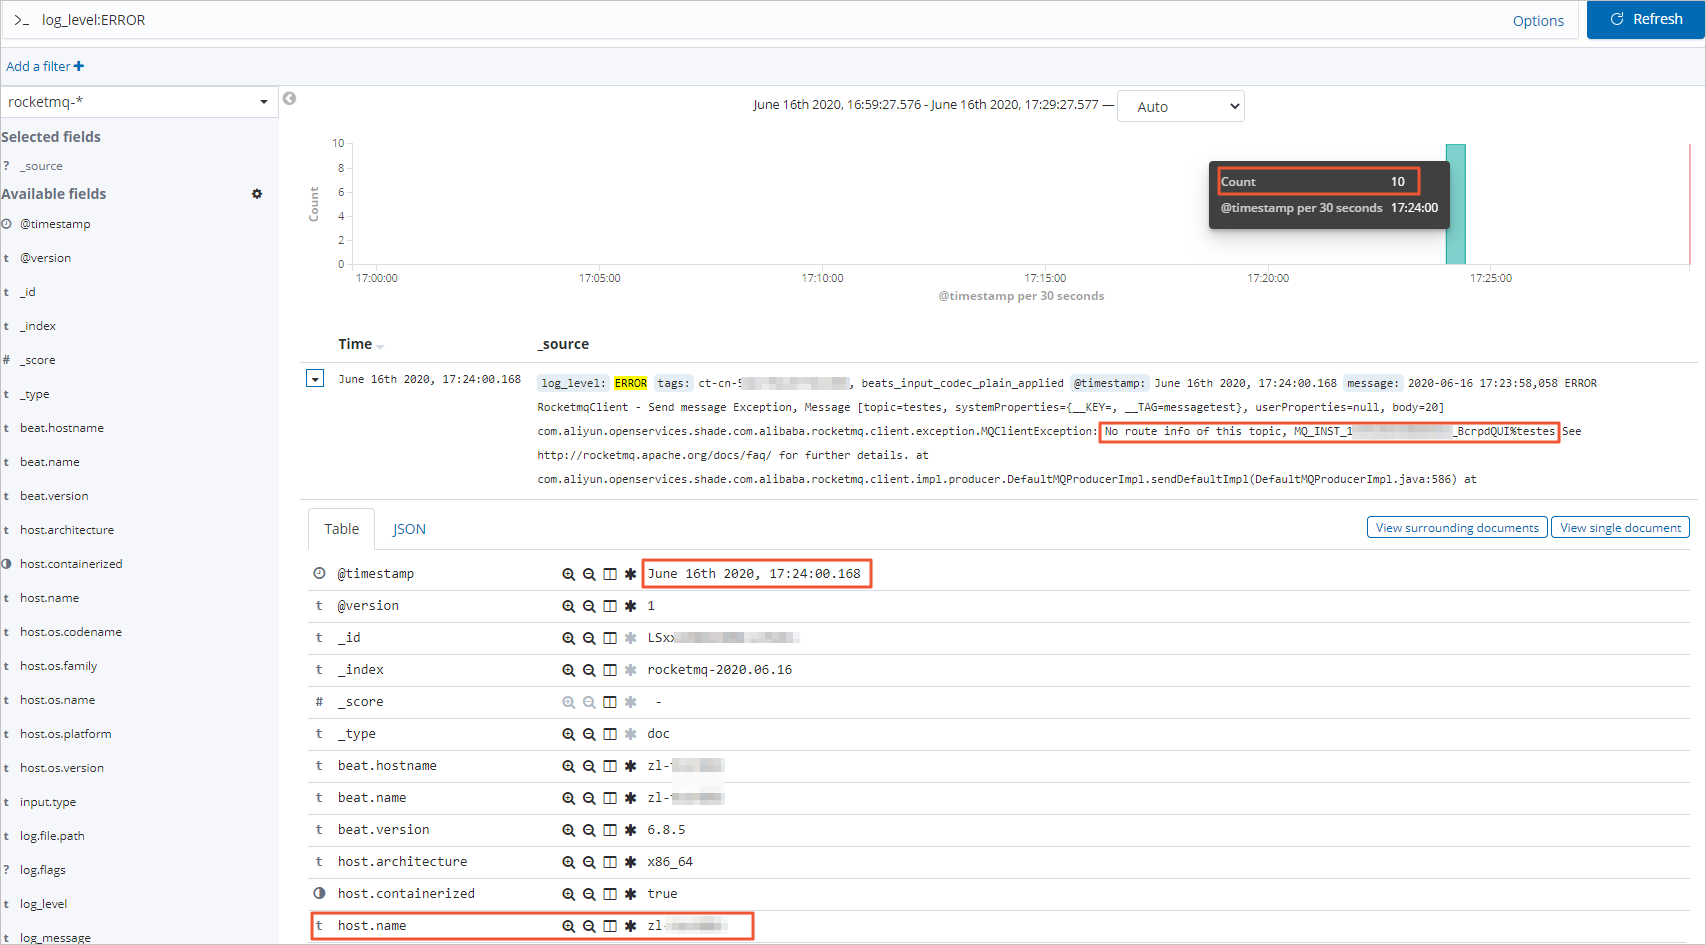
On the Discover page, enter the following search query in the query bar to filter for ERROR-level logs.
log_level:ERRORInterpret the filtered log entries.
The filtered results show the following:
There are 10 ERROR logs in the selected time range.
The error message,
No route info of this topic, MQ_INST_**********_BcrpdQUI%testes, indicates that the routing information for the topictestesin the instanceMQ_INST_**********_BcrpdQUIis missing. Possible causes include an incorrect topic configuration or accidental deletion of the topic.The error occurred at
June 16th 2020, 17:24:00.168.Expanding an error message reveals the source host (
host.name), allowing you to pinpoint the application instance. You can then connect to the instance to begin troubleshooting.