The Advanced Monitoring and Alerting service provides comprehensive metric and log monitoring analysis for your Elasticsearch clusters across all supported regions. It provides visualized monitoring data from multiple dimensions and lets you customize monitoring dashboards and alert rules. This topic describes how to configure alerts using the log alerting feature.
Prerequisites
-
The advanced monitoring and alert service is available in the following regions: Hangzhou, Beijing, Shanghai, Shenzhen, Qingdao, Zhangjiakou, Chengdu, Guangzhou, Ulanqab, Beijing Finance Cloud, US (Virginia), US (Silicon Valley), Japan (Tokyo), Indonesia (Jakarta), and China (Hong Kong). The regions available in the console are definitive.
-
Create a DingTalk robot and configure it with the keywords OK and Alerting. Then, obtain the robot's webhook. For more information, see Receive alert notifications through a DingTalk group.
-
Familiarize yourself with Grafana monitoring dashboards. For more information, see Grafana Dashboards.
Limits
-
Log alert notifications can be sent only through DingTalk and webhook.
-
The custom keywords for the DingTalk robot must be OK and Alerting. Otherwise, you cannot receive alert notifications. The following figure shows an example.
-
Grafana alerts cannot be configured for metric data.
Procedure
Step 1: Go to the Advanced Monitoring and Alerting page
Log on to the Alibaba Cloud Elasticsearch console.
-
In the navigation pane on the left, click Advanced Monitoring and Alerting.
Step 2: Configure information for the log alert contact
-
On the Advanced Monitoring and Alerting page, in the navigation pane on the left, choose .
-
Click Configure Log Alerting to open the Grafana page.
-
In the navigation pane on the left, click the
 icon and choose Notification channels.
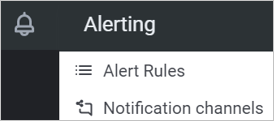
-
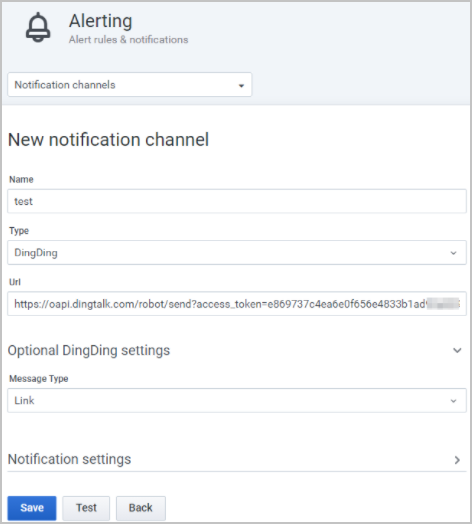
Click Add channel and configure the notification channel.
Parameter
Description
Name
The custom alert name. In this example, the value is test.
Type
Only DingTalk and Webhook are supported. Other methods are not supported. In this example, the value is DingDing.
Url
The webhook path of the DingTalk robot.
Message Type
The message type. Only Link is supported.
-
Click Save to save the configuration.
Step 3: Configure a log alert rule
-
On the Advanced Monitoring and Alerting page, in the navigation pane on the left, choose .
-
Click Configure Log Alerting to open the Grafana page.
-
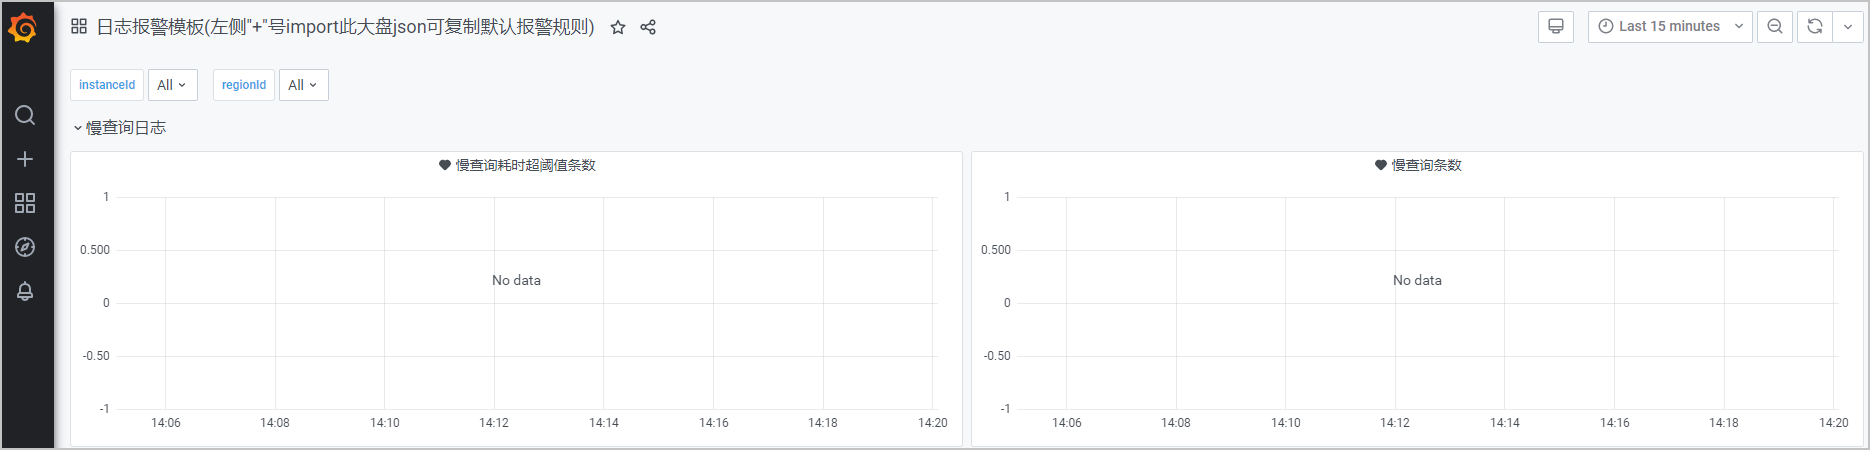
Configure a log alert rule using an alert template. You cannot directly edit log alert templates.
-
On the Grafana page, click the
 icon on the monitoring template.
 -
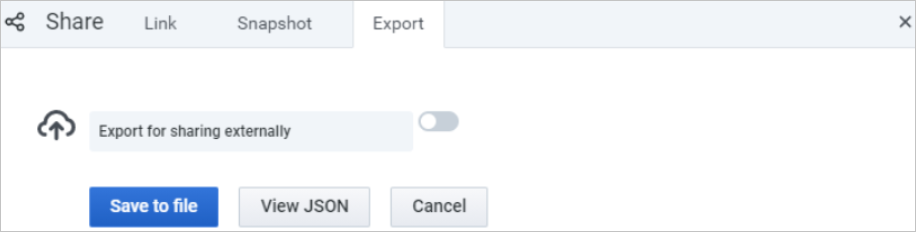
In the dialog box that appears, click the Export tab.

-
Click View JSON.
-
Click Copy to Clipboard to copy the JSON template.
-
In the navigation pane on the left, click the
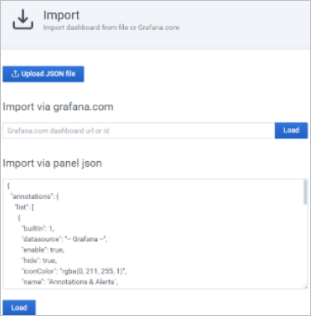
icon and choose Import. -
In the Import via Panel JSON section, paste the default alert rule from the JSON template.
-
Click Load.
-
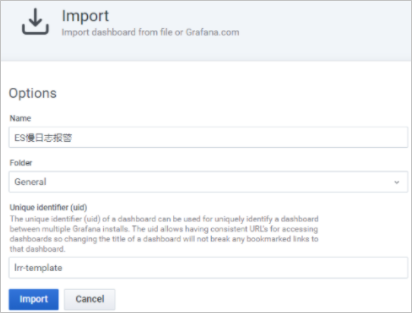
Change the Name and redefine the Unique identifier (uid).
-
Click Import to import the template.
-
-
Adjust the alert rule.
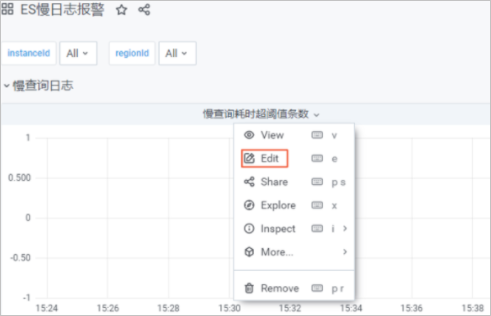
The following example shows how to configure an alert for the Number of slow queries that exceed the time threshold.
-
Click Number of slow queries that exceed the time threshold and choose Edit from the drop-down list.
-
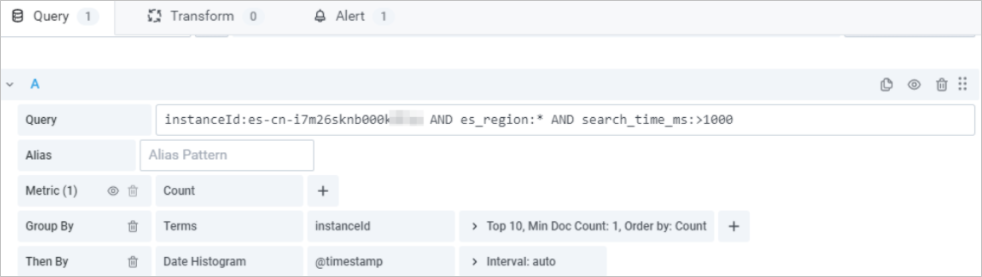
Click the Query tab and set the query conditions. The alert is triggered when these conditions are met.
-
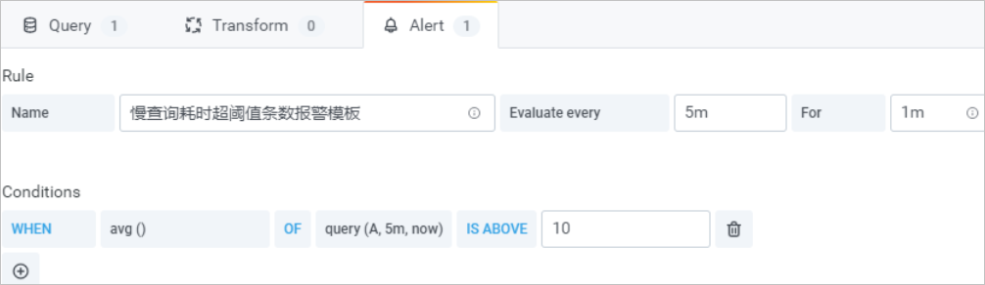
Click the Alert tab and set the Rule and Conditions.
Note-
The default alert rule is as follows: The query condition is executed every 5 minutes. An alert is triggered if the average number of logs for slow queries that take more than 1000 ms is greater than 10 for each data point within the last 5 minutes, and this state persists for more than 1 minute.
-
Evaluate every specifies the detection frequency. The minimum value is 1 minute. Other configuration items do not have specific limits.
-
-
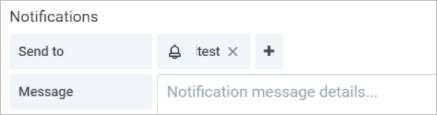
Click the
icon next to Send to to add the log alert contact that you configured in Step 2. -
Click Save.
-
Click Apply.
NoteFor configuration items that are not mentioned, you can use the default values or configure them as needed. For more information about advanced alert configurations, see the official Grafana documentation.
-
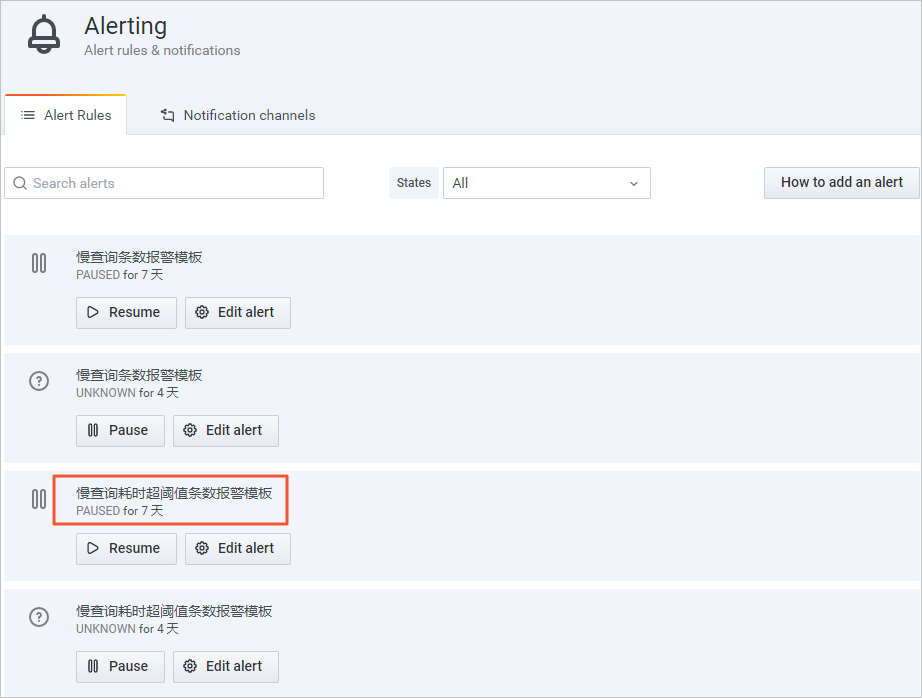
Step 4: View the log alert rule
-
On the Advanced Monitoring and Alerting page, in the navigation pane on the left, choose .
-
Click Configure Log Alerting to open the Grafana page.
-
In the navigation pane on the left, click the
icon and choose Alert Rules to view the list of alert rules.
To view the configured alert dashboard, choose .