The Alibaba Cloud Logstash logging feature lets you find specific log content by entering keywords and a time range. This helps you quickly locate cluster issues and perform daily maintenance. This topic describes how to query logs and explains the available log types.
Procedure
Go to the Logstash Clusters page.
Navigate to the target cluster.
In the top navigation bar, select the region where the cluster resides.
On the Logstash Clusters page, find the cluster and click its ID.
In the left-side navigation pane, click Logs to view the runtime logs of the cluster.
Alibaba Cloud Logstash supports four types of logs: cluster logs, slow logs, gc logs, and debug logs. The following table describes each log type and its use cases. For more information, see Log details.
Log type
Description
Use case
cluster log
Records the operational status of the cluster.
Use cluster logs to check the health of each node and the status of your pipelines. This includes troubleshooting connectivity issues between sources and destinations, verifying pipeline configuration changes, and identifying runtime errors.
ImportantIf your application experiences issues, check the cluster log and cluster monitoring data first. This helps you rule out performance bottlenecks or pipeline configuration issues.
slow log
Records pipeline events that exceed a specified time threshold.
ImportantTo aid in troubleshooting, slow logs are enabled by default in the YML file. Do not remove this slow log configuration. For more information, see Configure a YML file.
If you experience slow write operations, check the slow log. Common causes include:
The source or destination in the pipeline configuration has reached a resource bottleneck. We recommend that you scale up the resources for the source or destination.
The Pipeline Workers setting for Logstash is too small. Increase the Pipeline Batch Size and Pipeline Workers. For more information, see Manage pipelines by using configuration files.
gc log
Records garbage collection (GC) events from the Java Virtual Machine (JVM) heap. You can use gc logs to obtain detailed information about garbage collection, including Old GC, CMS GC, Full GC, and Minor GC mechanisms.
If a cluster experiences a performance bottleneck, you can use gc logs to obtain detailed garbage collection information and check for time-consuming or frequent garbage collection events.
debug log
Shows the output data after a pipeline processes it. This feature is disabled by default. To enable it, you must install the logstash-output-file_extend plug-in and configure the file_extend parameter in the output section.
Use debug logs when you need to view the output of a pipeline configuration directly in the console for debugging.
In the search box on the Logs page, enter a search query, select a start and end time, and then click Search.
You can query logs from the last seven days. By default, logs are displayed in reverse chronological order. Alibaba Cloud Logstash supports Lucene-based query syntax. For more information, see Query string syntax.
For example, to query a cluster log where the content field contains the keyword running, the level is info, and the host is 172.16.xx.xx, use the following query:
host:172.16.xx.xx AND level:info AND content:running.Alibaba Cloud Logstash then displays the search results on the Logs page.
Log details
Cluster log
A cluster log displays the runtime logs of a cluster, including the generation time, the source node's IP address, and detailed log information.
|
Parameter |
Description |
|
Time |
The time when the log was generated. |
|
Node IP Address |
The IP address of the node that generated the log. |
|
Content |
The detailed information of the log, which consists of the following fields: level, host, time, and content.
|
GC log
gc logs are enabled by default. They share the same structure as the cluster log.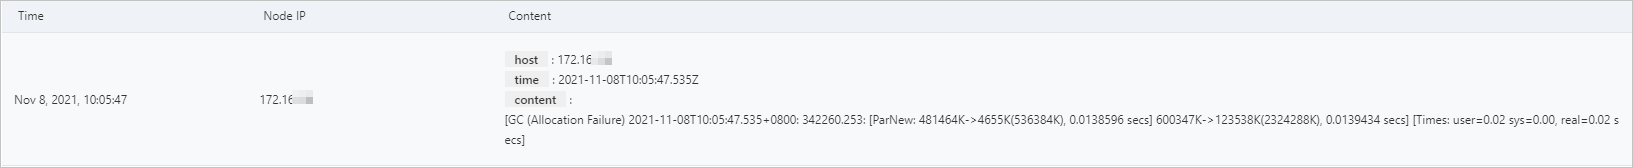
Slow log
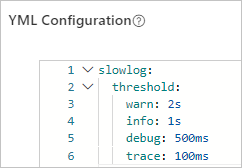
Slow logs are enabled by default. You can view or modify the default slow log configuration in the YML file of your Logstash instance. For more information, see Configure a YML file.
To facilitate future troubleshooting of Alibaba Cloud Logstash, do not remove this slow log configuration.
Debug log
Debugging a pipeline can be a time-consuming process when the output data does not match your expectations. To simplify this, Alibaba Cloud Logstash provides a pipeline debugging feature. For more information, see Use the pipeline configuration debugging feature.
Debug logs are disabled by default. To enable them, perform the following steps:
Install the logstash-output-file_extend plug-in. For more information, see Install or remove a plug-in.
In the output section of the pipeline configuration, configure the file_extend parameter. For more information, see Manage pipelines by using configuration files.
After you enable debug logs, you can view the processed pipeline output data on the Debug Log tab.