Trigger an HTTP API for new DingTalk members
EventBridge integrates with the DingTalk connector, allowing you to build various employee management systems. This topic describes how to send new employee onboarding records from DingTalk to a custom HTTP API endpoint without writing any code.
How it works
This solution integrates several products to create an automated workflow: DingTalk, the DingTalk connector, EventBridge, and Function Compute. The following diagram shows the process: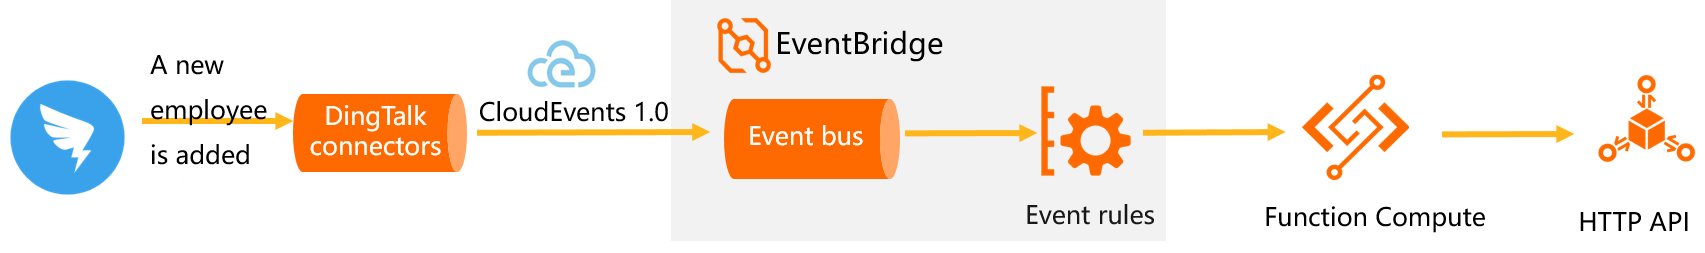
Prerequisites
Make sure that you have completed the following:
Register a DingTalk account and create a DingTalk team as an administrator. For more information, see How to create an organization.
Step 1: Create a custom event bus
Log in to the EventBridge console. In the top navigation bar, select a region.
In the left-side navigation pane, click Event Buses. In the Custom Event Buses section, click Quickly Create.
In the Create Custom Event Bus panel, complete the following steps.
On the Event Bus tab, set the Name and Description, and then click Next Step.
On the Event Sources tab, set the Event Source Name and Description, configure the following parameters, and then click Next Step.
Parameter
Value
Event Provider
HTTP/HTTPS Trigger
Request Type
HTTPS
Request Method
POST
Security Settings
No configuration required
On the Event Rule tab, click Skip. In the Skip Subsequent Steps dialog box, click OK to create the custom event bus without an event rule or event target for now.
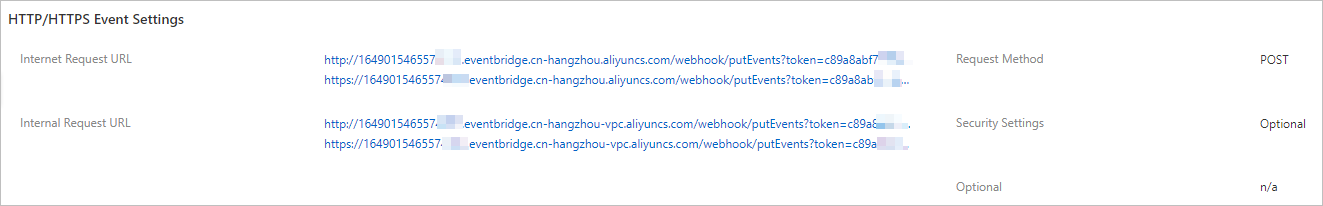
After the event source is created, you can find it in the event source list. Click Details to view its configuration. The Internet Request URL can be used as the inbound webhook URL for the DingTalk connector.
Step 2: Create a DingTalk connection stream
Log in to the DingTalk Open Platform. In the top navigation bar, select .
In the left-side navigation pane, select .
On the My Connection Streams page, from the New list, select Business Stream.
In the Create Stream dialog box, enter a name and description for the connection stream, and set Trigger to .
On the Connection Stream tab, click the
 icon, and then click Network Request.
To the right of the Network Request section, click the
 icon. In the Network Request panel, set the request parameters, and then click Save.
Step 3: Use Function Compute to call an HTTP API
Log on to the Function Compute console. In the left-side navigation pane, click Services & Functions.
In the top navigation bar, select a region. On the Services page, click Create Service.
In the Create Service panel, enter a service name and description, configure the following settings as needed, and then click OK.
Parameter
Description
Logging
Controls whether function execution logs are sent to Simple Log Service:
Enable: Saves function execution logs to Simple Log Service for debugging, troubleshooting, and data analysis.
Disable: Prevents function execution logs from being stored or queried through Simple Log Service.
Advanced Settings
Tracing Analysis
Controls whether to enable Tracing Analysis:
Enable: You can use Jaeger to upload trace information to track function executions and quickly diagnose performance bottlenecks in your serverless architecture. For more information, see Introduction to Tracing Analysis.
Disable: Disables Tracing Analysis.
Service Role
The role that grants permissions to functions in this service. For more information, see Grant Function Compute permissions to access other Alibaba Cloud services.
Access to VPC
Allows functions in this service to access resources in a specified VPC. For more information, see Configure a network.
VPC
Required if Access to VPC is set to Yes. The VPC that functions in this service can access.
vSwitches
Required if Access to VPC is set to Yes. The VSwitch within the selected VPC.
Security Group
Required if Access to VPC is set to Yes. The security group that controls network access for the functions.
Access to Internet
Allows functions in this service to access the Internet. If disabled, the functions in the current service cannot access the Internet through the default elastic network interface of Function Compute.
ImportantIf you use a static public IP address, you must disable Access to Internet. Otherwise, the configured static public IP address will not take effect. For more information, see Configure a static public IP address.
On the Services page, click the name of the target service, and then click Create Function.
On the Create Function page, select a method to create the function, configure the following settings, and then click Create.
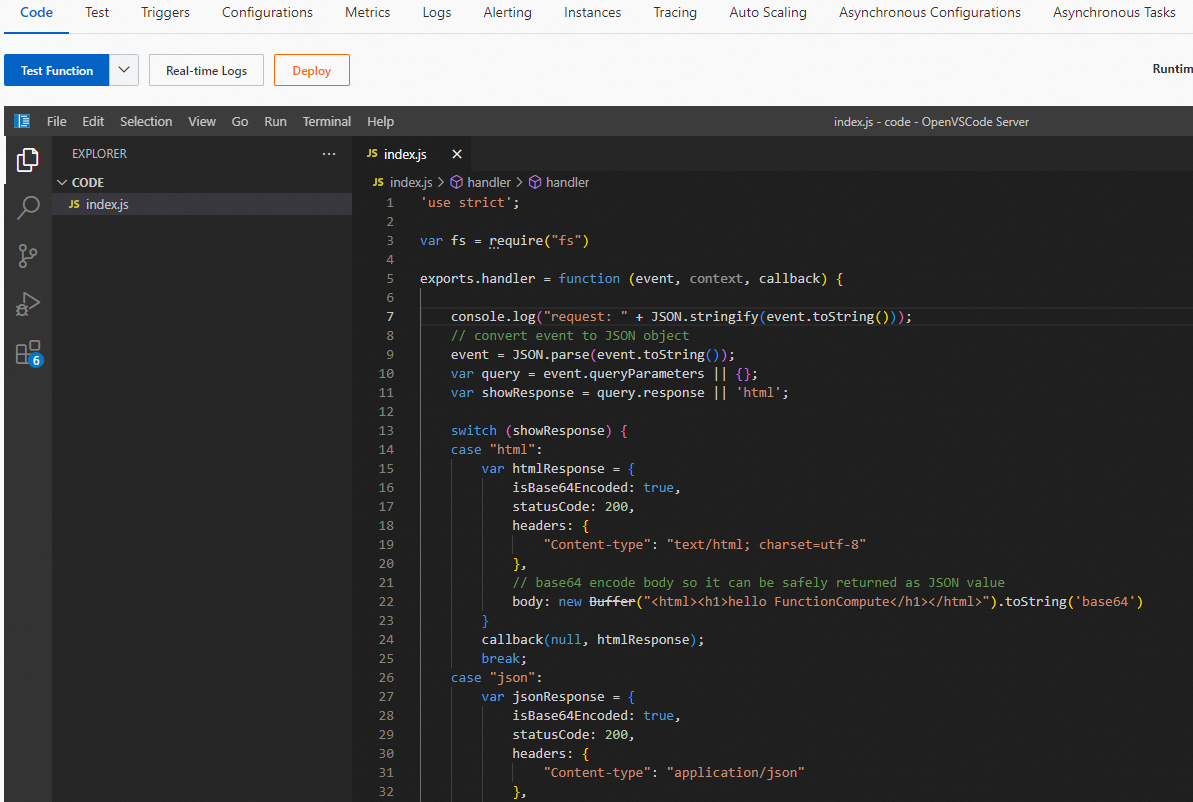
In the Basic Settings section, set the function name and select Process HTTP Requests for Handler Type.
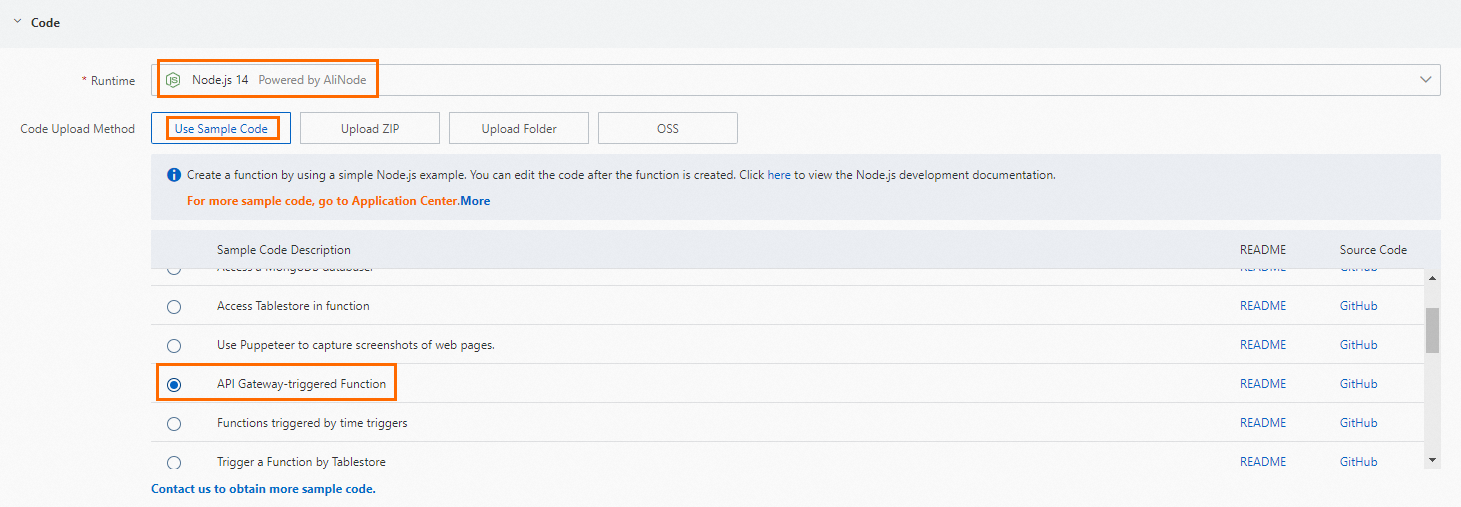
In the Code section, select Runtime for Runtime, select Use Sample Code for Code Upload Method, and click API Gateway-triggered Function.
After you create the function, you can view its details on the Function Details page.
Step 4: Create an event rule
Log in to the EventBridge console and find the custom event bus that you created in Step 1.
Click the name of the custom event bus. In the left-side navigation pane, click Event Rules.
On the Event Rules page, click Create Rule. In the Create Rule configuration wizard, configure the following parameters.
On the Configure Basic Info tab, set the Name and Description for the event rule, and then click Next Step.
On the Configure Event Pattern tab, set Event Source Type to Custom Event Source, set Event Sources to the custom event source that you created in Step 1, and then click Next Step.
On the Configure Targets tab, set the following parameters, and then click Next Step.
Parameter
Description
Example
Service Type
The type of service that will receive the event.
Function Compute
Service
Select the service that you created in Step 3: Use Function Compute to call an HTTP API.
testserver
Function
Configure the function that you created in Step 3: Use Function Compute to call an HTTP API.
testfunction
Event
Select Complete Event.
Full Event
Invocation Mode
Select Synchronous.
Sync
Step 5: Test the integration
Invite a member to join your DingTalk team. For more information, see How to add organization members.
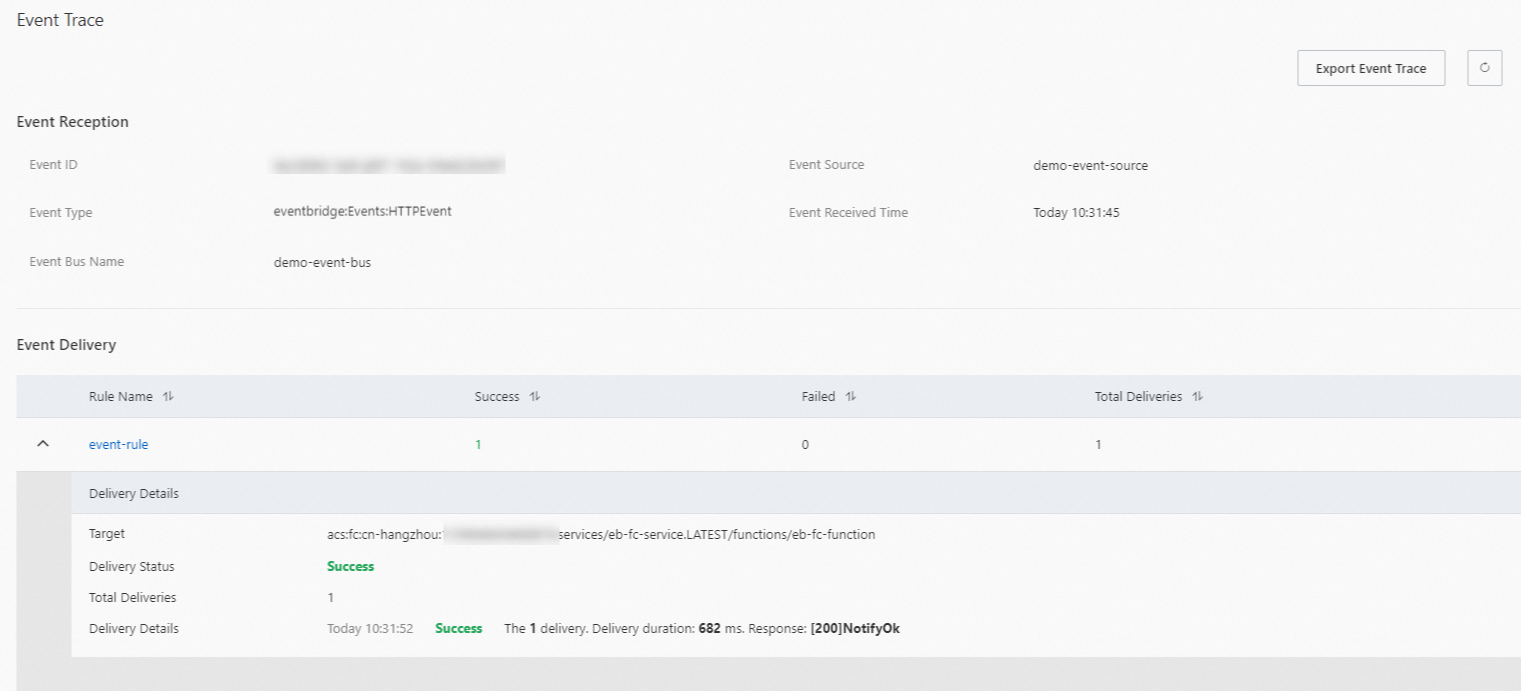
On the details page of the custom event bus that you created in Step 1, click Event Tracking, set a time range for the query, and then click Query.
In the query results, find the event and click Event Trace in the Actions column to confirm its successful delivery.
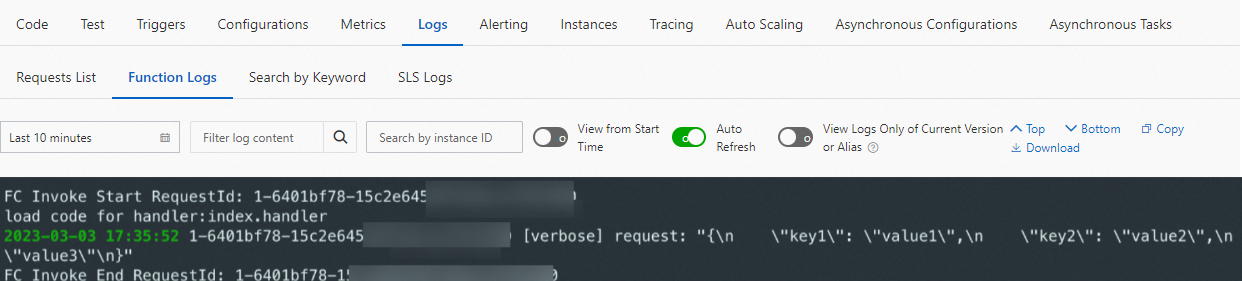
Verify the results
Log in to the Function Compute console. On the details page for the function created in Step 3, click the Function Logs tab to view the logs.