Configure tracing analysis
Function Compute supports integration with Alibaba Cloud Managed Service for OpenTelemetry. This service is based on OpenTelemetry, a de facto standard for observability. It helps you identify and diagnose performance bottlenecks in distributed applications and significantly improves developer and operations and maintenance (O&M) efficiency in serverless architectures. This topic describes how to enable tracing analysis for your functions and view function call chain information for end-to-end request monitoring and performance analysis.
Background information
In serverless architectures, conventional logging methods are insufficient for tracing call chains and analyzing performance. This creates the following pain points:
Difficulty in locating cold start latency: The process relies on piecing together logs, which makes it impossible to distinguish between system and business latency.
Inconsistent cross-service calls: Broken contexts prevent the reconstruction of a complete trace.
Lack of visual analytics: It is difficult to accurately identify performance bottlenecks.
To improve system observability and O&M efficiency, Function Compute integrates with the end-to-end observability of Managed Service for OpenTelemetry. This integration enables end-to-end tracing through W3C header pass-through and supports span segmentation. This allows for call path visualization and rapid identification of performance issues.
Features
End-to-end transparency
This feature enables the pass-through of Function Compute (FC) system-level spans. It also automatically joins custom business spans with system spans to form an end-to-end trace view. This view exposes potential performance bottlenecks, such as cold start latency and resource contention.
Cross-environment interoperability
It is compatible with headers such as traceparent, tracestate, and baggage. This ensures lossless context propagation between FC functions and downstream services, such as databases and message queues.
This feature supports trace context pass-through across functions, Alibaba Cloud services, and services from other cloud providers. This allows for seamless integration with existing OpenTelemetry toolchains.
Dynamic cost control
You can adjust the sample rate in the function configuration, from 1% for low-load sampling to 100% for troubleshooting, to balance data volume and resource overhead.
Billing
Function Compute does not charge extra for enabling tracing analysis. However, Alibaba Cloud Managed Service for OpenTelemetry bills you separately based on the volume of trace data that you report.
Prerequisites
You have created a function and enabled the logging feature for it.
You have activated Alibaba Cloud Tracing Analysis. If you have not, log on to the Alibaba Cloud Tracing Analysis service console with your Alibaba Cloud account to activate it.
Enable tracing analysis
Log on to the Function Compute console. In the left-side navigation pane, click Functions.
In the top navigation bar, select a region. On the Functions page, click the function that you want to manage.
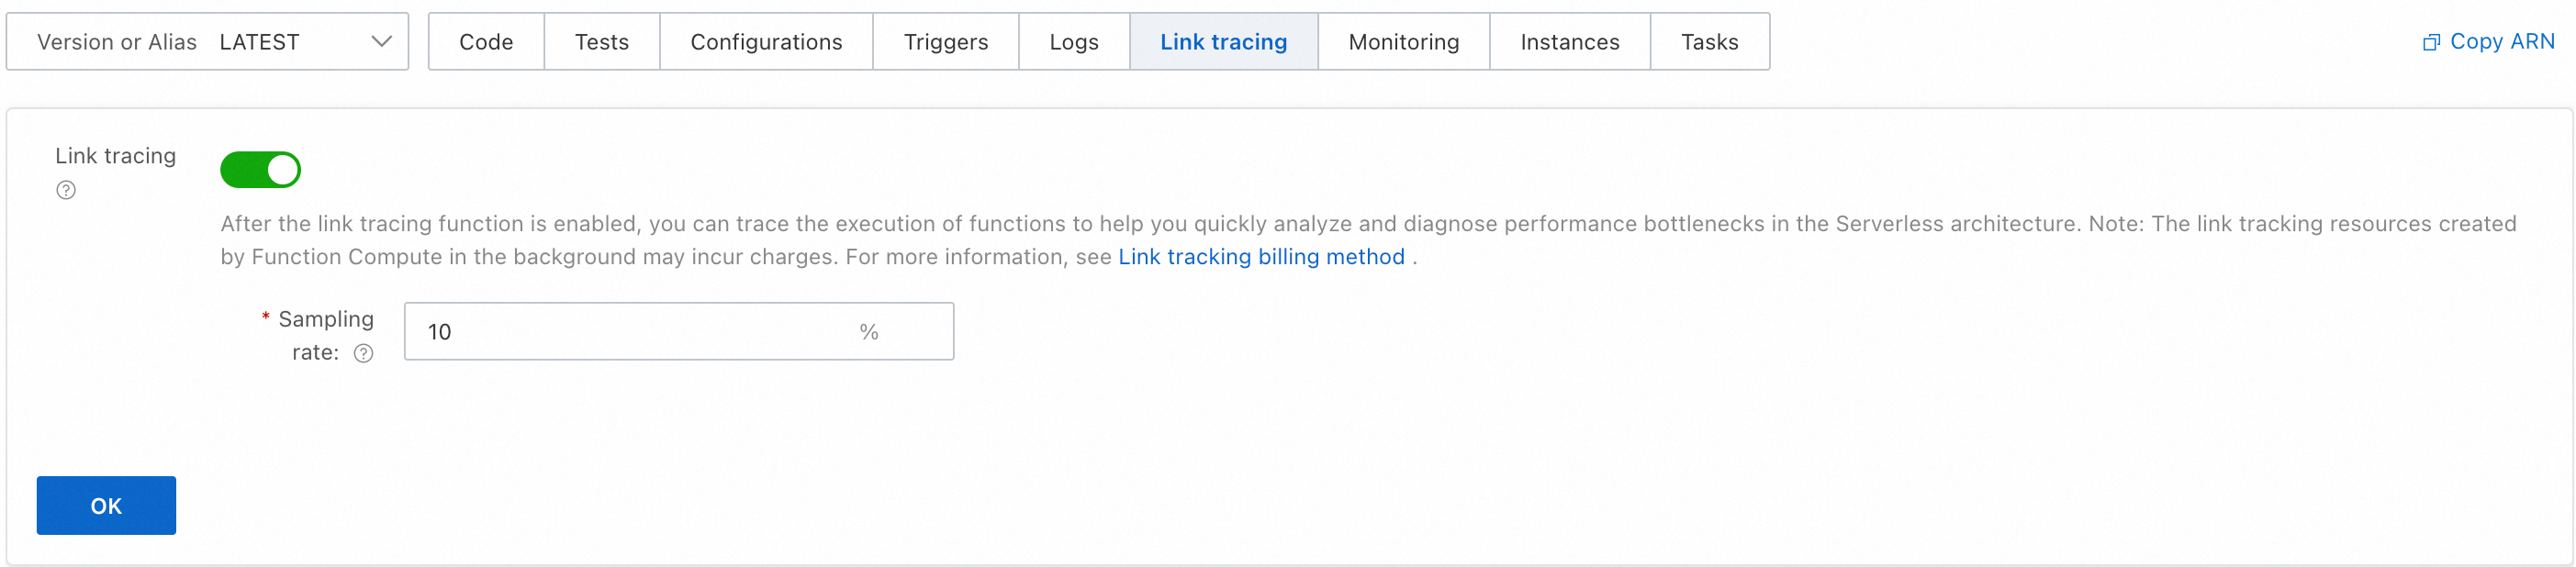
On the Function Details page, select the Tracing Analysis tab. Turn on the Tracing Analysis switch, configure the Sample Rate, and then click OK.
View function call chain information
On the Function Details page, select the Code tab. After you confirm that the code is correct, click Test Function.
Select the Tracing Analysis tab to view the detailed call chain analysis.
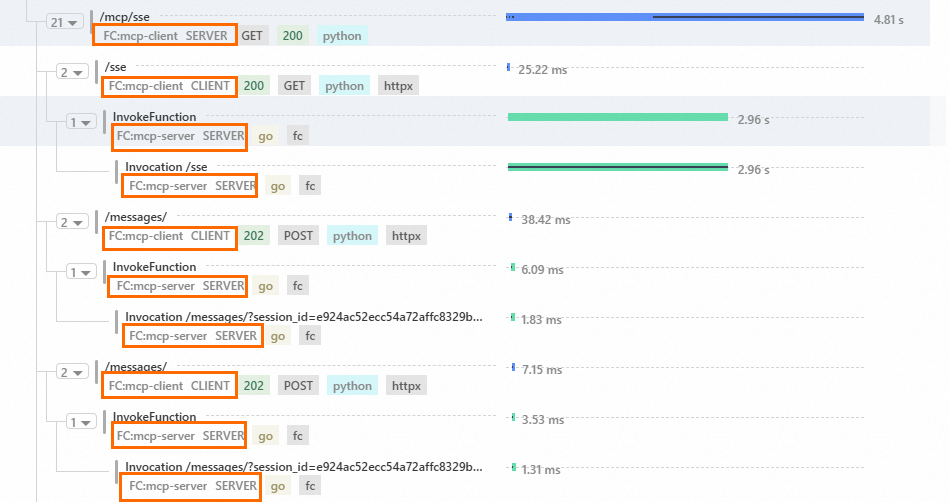
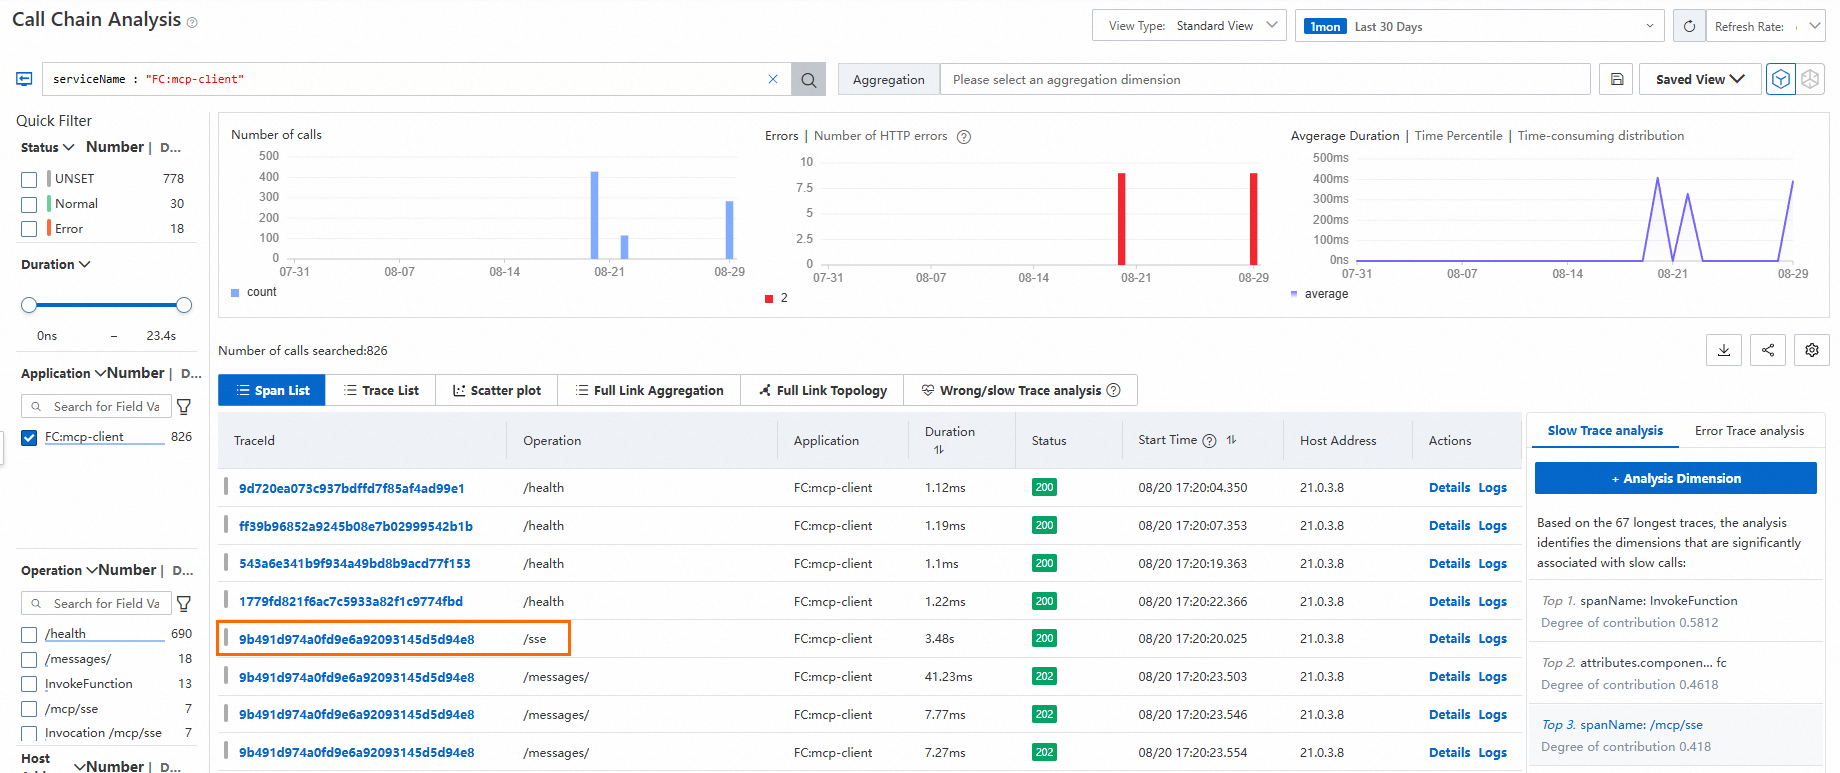
For example, in a scenario where an MCP client calls the Amap Weather Query MCP server, you can view the complete call chain information. This includes the cold start process, Server-Sent Events (SSE) connection, message communication, and agent calls.
As shown in the following figure, on the call chain analysis page, click the target TraceId.
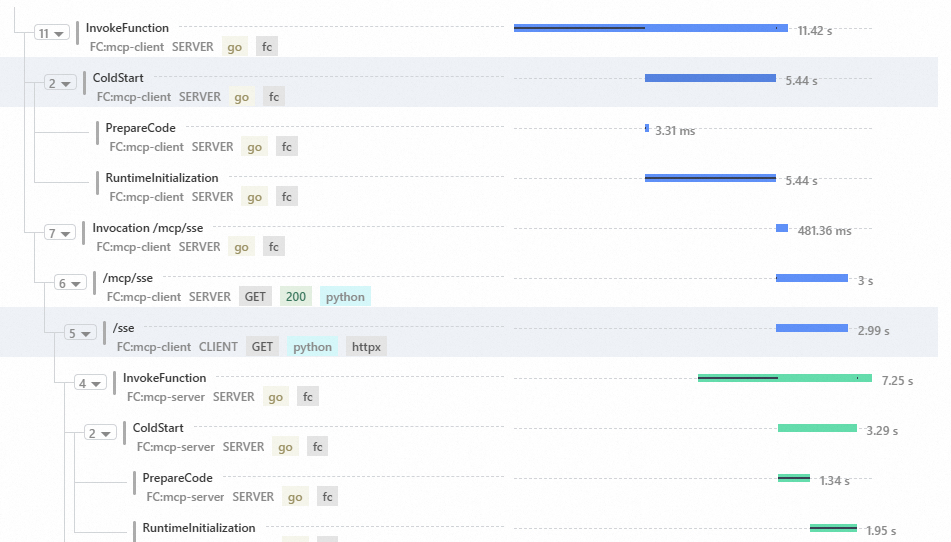
In the panel that appears on the right, you can view the cold start duration. If the PrepareCode time is longer than expected, streamline the code package.
If an exception occurs, click the corresponding TraceId to view the exception details in the panel on the right. You can also use the AI O&M Assistant to analyze the trace.
When Function Compute acts as an endpoint in a distributed trace, tracing analysis can link upstream and downstream services, such as the mcp-client and mcp-server endpoints, to show the request latency at each step.