This topic describes how to use Hologres Dynamic Tables with incremental and full refresh modes to meet diverse business analytics requirements. It also explains how to connect Hologres to BI tools such as DataV to support real-time and batch analytics on large-scale data, enabling fast data analysis and exploration.
Background information
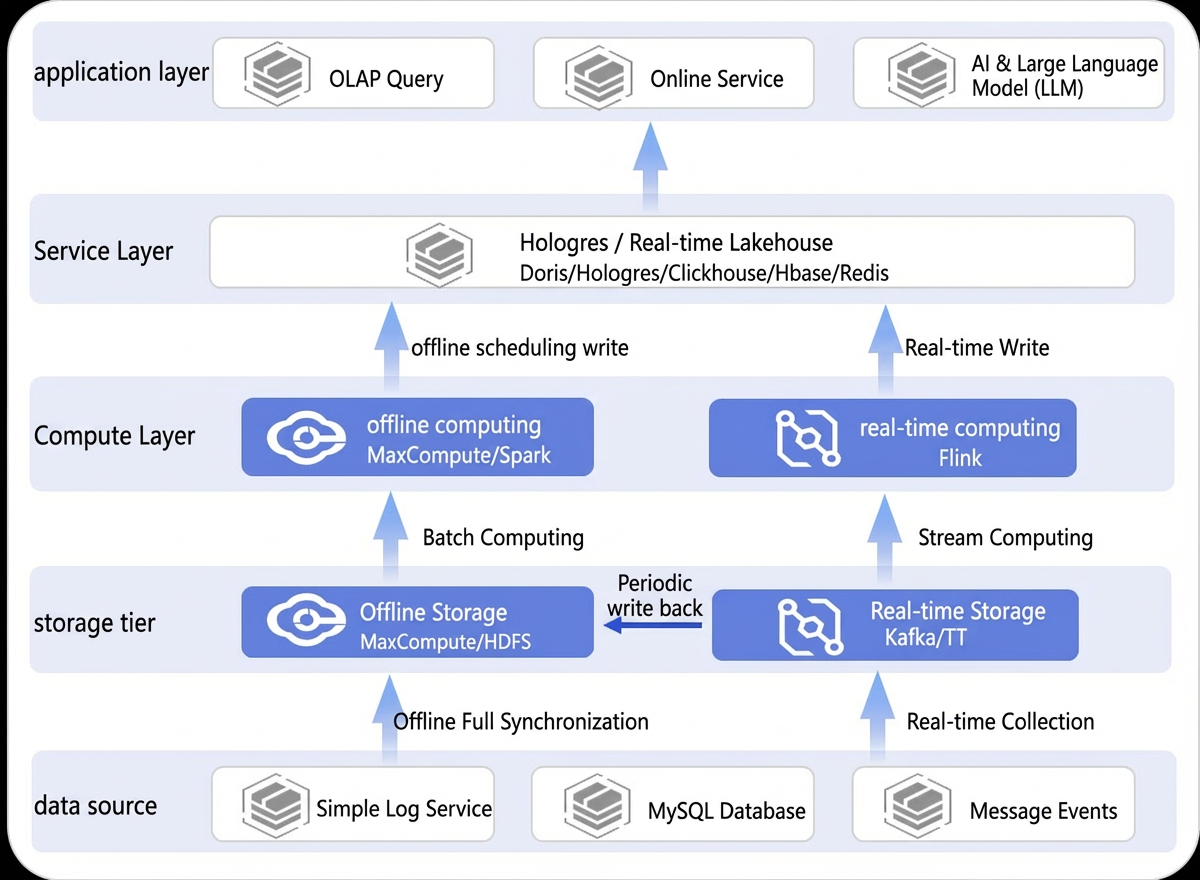
Traditional data warehouse architecture
In traditional architectures, separate systems are required to support offline, near-real-time, and real-time queries. The Lambda architecture commonly used in traditional data warehouses has several drawbacks, including complex architecture, numerous components, high operational overhead, and high cost. Inconsistent compute engines make it difficult to standardize data transformation, leading to data redundancy and synchronization challenges that increase resource consumption. In addition, the lack of an effective data warehouse layering strategy results in high query latency, inconvenient operations, and low development efficiency.
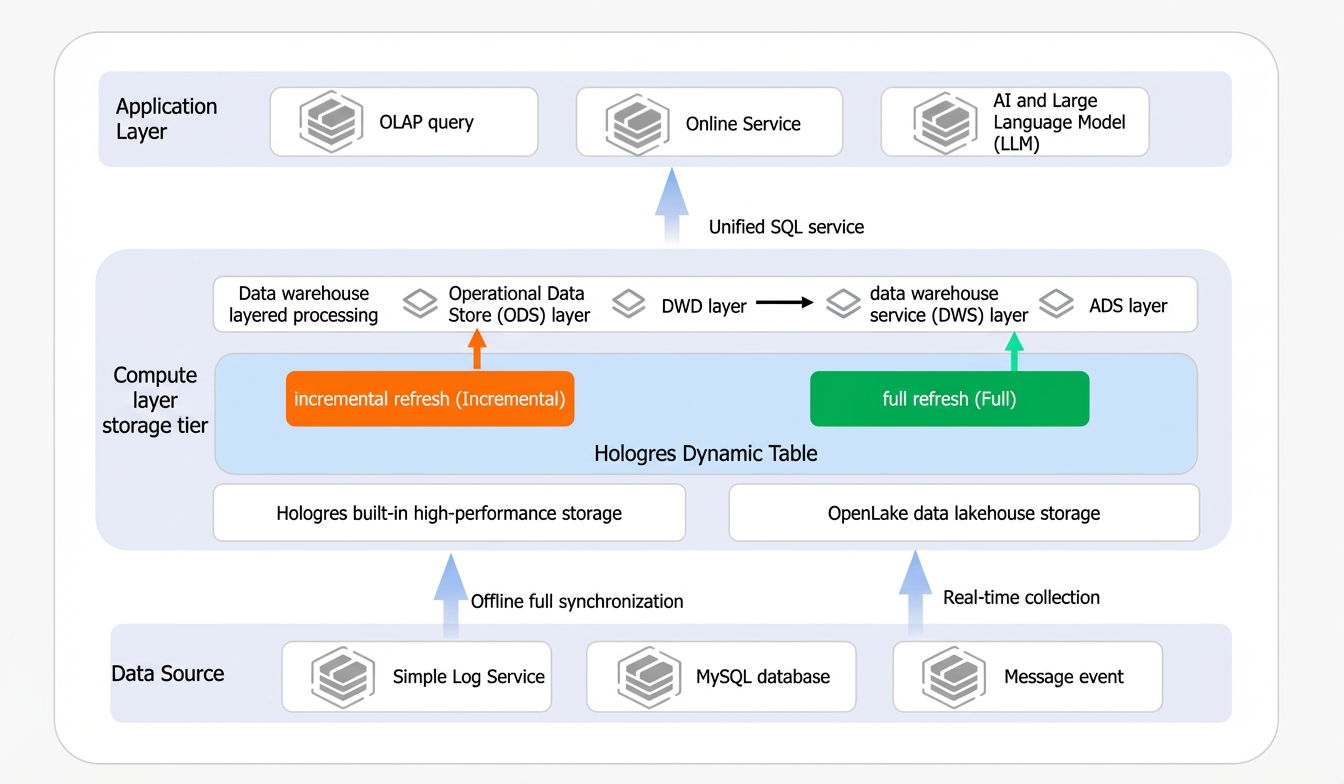
Unified multi-mode compute architecture based on Hologres Dynamic Tables
Hologres supports Dynamic Tables starting from version 3.0. Dynamic Tables support two refresh modes: full refresh and incremental refresh. They also support auto-refresh and streaming refresh. A unified multi-mode compute architecture addresses key requirements such as data warehouse layering and stream-batch integration for real-time data warehouses while balancing performance, cost, and timeliness.
Scenarios
Hologres Dynamic Tables support the following two refresh modes:
Incremental refresh: Scenario 1: Cumulative incremental transaction analysis.
Full refresh: Scenario 2: Historical ad data analysis and data backfill.
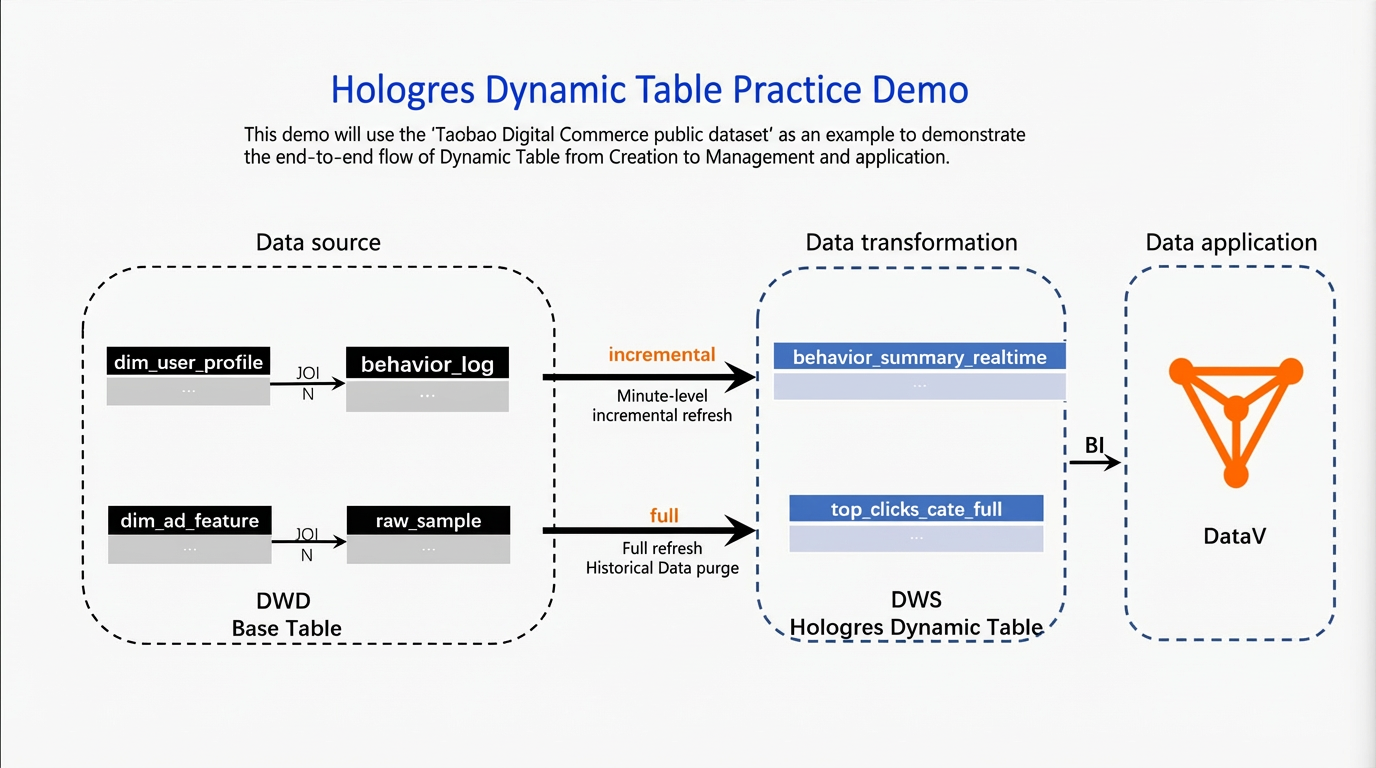
The following illustrates the data link.
Data source: In this example, data comes from the public dataset in MaxCompute. You must write this data into an internal table in Hologres. This internal table becomes the base table for a Dynamic Table.
Data transformation: In Hologres, transform the base table into two Dynamic Tables. Configure one for incremental refresh and the other for full refresh. This creates a data warehouse service (DWS) that meets different query timeliness requirements.
Data application: In this example, use DataV to visualize changes in Dynamic Table data.
Preparations
Environment setup
Set up a Hologres environment.
You must activate Hologres, create a Hologres database, and connect to it. Later, run commands in the Hologres database to read data.
NoteYou can apply for a free Hologres resource plan to try core steps in this tutorial at no cost. For details about free resource plans and how to apply, see Free trial for new users.
We recommend activating Hologres Serverless resources. Submit refresh tasks to a serverless cluster to isolate them from each other. For details, see Serverless Computing.
Set up a DataWorks development environment.
This example uses DataWorks to create Dynamic Tables and develop SQL. Use the new DataStudio interface for data development. Make sure the Join Data Studio public preview parameter is enabled. For instructions, see Create a workspace.
You must attach the Hologres data source created earlier to your DataWorks development environment. For instructions, see New data development: Attach Hologres compute resources.
(Optional) Set up a dashboard tool. This example uses DataV.
This example uses DataV to show the final dashboard.
Data preparation (Prepare the Hologres base table)
Create the following tables and import data from the MaxCompute public dataset (Digital Commerce Dataset) into Hologres internal tables. Then create Dynamic Tables for data transformation.
public.dim_ad_featurepublic.behavior_logpublic.raw_samplepublic.dim_user_profile
The DDL statements to create internal tables and the SQL statements to import data are as follows.
-- Create a foreign table
CREATE SCHEMA foreign_holo;
IMPORT FOREIGN SCHEMA "BIGDATA_PUBLIC_DATASET#commerce" LIMIT to
(adv_raw_sample,adv_ad_feature,user_profile,behavior_log)
  FROM server odps_server INTO foreign_holo options(if_table_exist 'error');


-- Create the dimension table for ad features
DROP TABLE IF EXISTS public.dim_ad_feature;
BEGIN;
CREATE TABLE public.dim_ad_feature (
   adgroup_id bigint NOT NULL,
    cate_id bigint,
    campaign_id bigint,
    customer_id bigint,
    brand bigint,
    price double precision
    ,PRIMARY KEY (adgroup_id)
) WITH (
orientation = 'column',
storage_format = 'orc',
distribution_key = 'adgroup_id'
);
END;
-- Import dimension table data
INSERT INTO dim_ad_feature SELECT
   try_cast(adgroup_id as bigint) as adgroup_id,
   try_cast(cate_id as bigint) as cate_id,
   try_cast(campaign_id as bigint) as campaign_id,
   try_cast(customer_id as bigint) as customer_id,
   try_cast(brand as bigint) as brand,
    price::double precision
 FROM foreign_holo.adv_ad_feature;

-- Create the user behavior table
DROP TABLE IF EXISTS public.behavior_log;
BEGIN;
CREATE TABLE public.behavior_log (
    user_id bigint,
    ds text,
    "time" text,
    behavior_type text,
    cate bigint,
    brand bigint
) WITH (
orientation = 'column',
storage_format = 'orc',
binlog_level = 'replica',
binlog_ttl = '2592000',
bitmap_columns = 'ds,"time",behavior_type',
dictionary_encoding_columns = 'ds:auto,"time":auto,behavior_type:auto',
distribution_key = 'cate'
);
END;
-- Import data
INSERT INTO behavior_log SELECT
    "user"::bigint,
    date(to_timestamp(time_stamp::bigint)),
    to_timestamp(time_stamp::bigint),
    btag::text,
    cate::bigint,
    brand::bigint
 FROM foreign_holo.behavior_log
 WHERE date(to_timestamp(time_stamp::bigint))='2017-05-13' ;


-- Create the ad detail table
DROP TABLE IF EXISTS public.raw_sample;
BEGIN;
CREATE TABLE public.raw_sample (
    user_id bigint,
    adgroup_id bigint,
    ds text,
    "time" text,
    pid text,
    noclk integer,
    clk integer
) WITH (
orientation = 'column',
storage_format = 'orc',
binlog_level = 'replica',
binlog_ttl = '2592000',
bitmap_columns = 'ds,"time",pid',
dictionary_encoding_columns = 'ds:auto,"time":auto,pid:auto',
distribution_key = 'user_id'
);
END;
-- Import data
INSERT INTO raw_sample SELECT
    user_id::bigint,
    adgroup_id::bigint,
    date(to_timestamp(time_stamp::bigint)),
    to_timestamp(time_stamp::bigint),
    pid::text,
    noclk::integer,
    clk::integer
 FROM foreign_holo.adv_raw_sample;


-- Create the user profile dimension table
DROP TABLE IF EXISTS public.dim_user_profile;
BEGIN;
CREATE TABLE public.dim_user_profile (
    user_id bigint NOT NULL,
    cms_seg_id bigint,
    cms_group_id bigint,
    final_gender_code integer,
    age_level integer,
    pvalue_level integer,
    shopping_level integer,
    occupation integer,
    new_user_class_level integer
    ,PRIMARY KEY (user_id)
) WITH (
orientation = 'column',
storage_format = 'orc',
distribution_key = 'user_id'
);
END;
-- Import data
INSERT INTO dim_user_profile SELECT
    try_cast(userid as bigint),
    try_cast(cms_segid as bigint),
    try_cast(cms_group_id as bigint),
    try_cast(final_gender_code as integer),
    try_cast(age_level as integer),
    try_cast(pvalue_level as integer),
    try_cast(shopping_level as integer),
    try_cast(occupation as integer),
    try_cast(new_user_class_level as integer)
FROM foreign_holo.user_profile WHERE userid != 'userid';
Scenario 1: Cumulative incremental transaction analysis
In practice, some business scenarios do not require real-time analysis. For example, you may need to accumulate hourly behavioral or transaction data, and a small delay is acceptable. This is a near-real-time analysis scenario. Use incremental refresh for Dynamic Tables to process only new data. This reduces computation load and improves data processing timeliness to meet near-real-time analysis needs.
Create a Dynamic Table
To create a Dynamic Table in DataWorks, enter a table name and add a query SQL statement. If you use the Hologres console, see Incremental refresh Dynamic Table for full SQL details.
Go to the Workspaces page in the DataWorks console. In the top navigation bar, select a desired region. Find the desired workspace and choose in the Actions column.
Click the icon on the left
 and, on the Data Catalog page, select Hologres.
Click
 , select the DataWorks Data Source tab, and click Add As Data Catalog in the Actions column of the bound target data source.Note
For details about binding data sources, see New data development: Attach Hologres compute resources.
Click your target schema under the Hologres directory on the left. Select the Dynamic Tables tab. Click Create dynamic table.
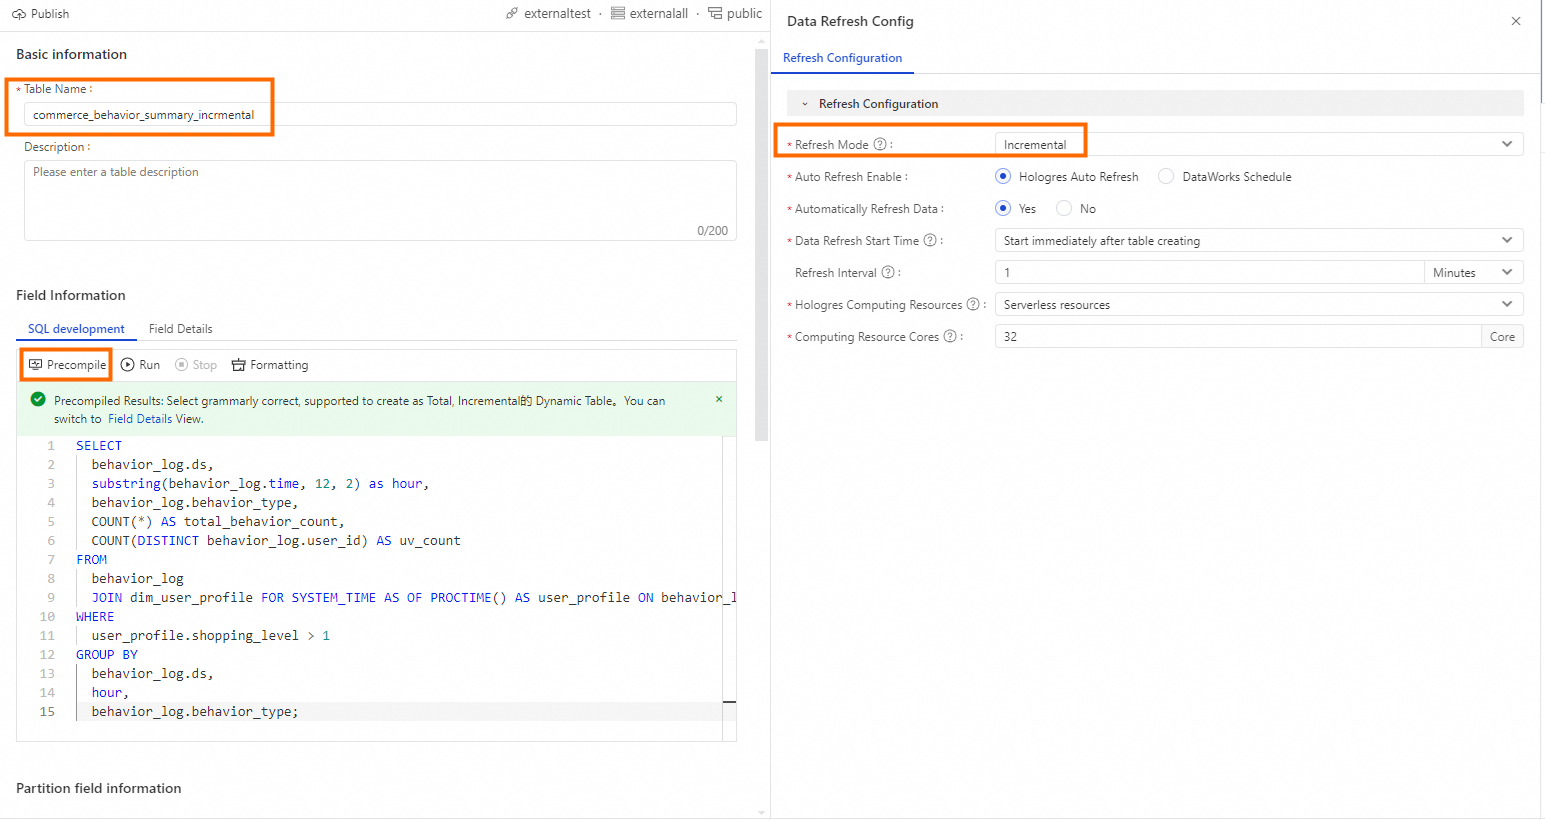
On the Create dynamic table page, enter table information.
Enter a table name. For example,
commerce_behavior_summary_incrmental. If you use a custom name, update the SQL query below accordingly.In the SQL editor, enter the following SQL.
SELECT
  behavior_log.ds,
  substring(behavior_log.time, 12, 2) as hour,
  behavior_log.behavior_type,
  COUNT(*) AS total_behavior_count,
  COUNT(DISTINCT behavior_log.user_id) AS uv_count
FROM
  behavior_log
  JOIN dim_user_profile FOR SYSTEM_TIME AS OF PROCTIME() AS user_profile ON behavior_log.user_id = user_profile.user_id
WHERE
  user_profile.shopping_level > 1
GROUP BY
  behavior_log.ds,
  hour,
  behavior_log.behavior_type;
Click Precompile to check syntax correctness.
On the right, select Refresh policy and configure parameters.
Parameter Name
Description
Refresh mode
Select Incremental.
Start time for data refresh
Select Start immediately after table creation.
Refresh interval
1 minute.
Hologres compute resource
Select Serverless resource.
Hologres compute resource specification
32 cores.

After you finish, submit and publish. After successful publishing, the incremental refresh task runs periodically based on the refresh interval to perform incremental computation on your data.
Query data
After the incremental refresh task runs, you can query incremental changes. Example SQL queries follow.
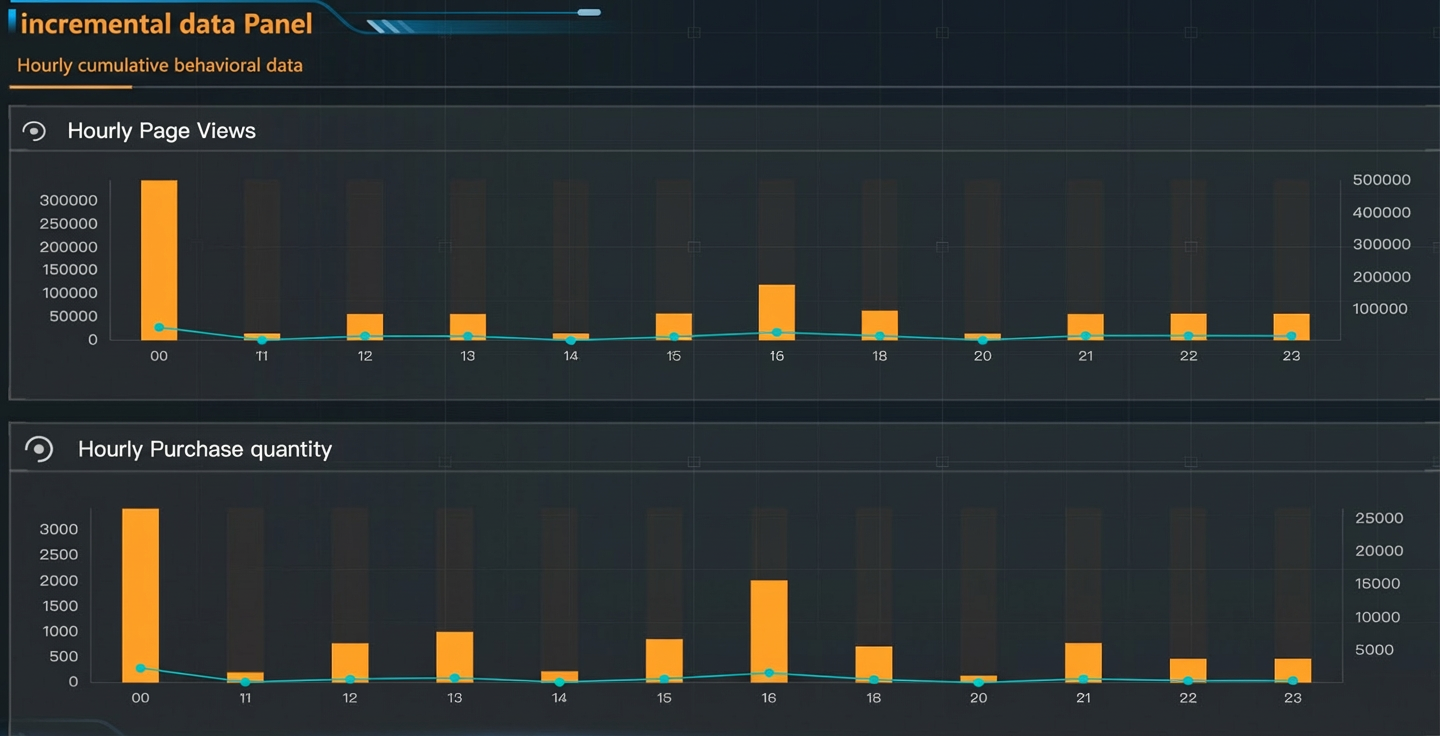
Hourly page views.
-- Hourly page views
SELECT hour, total_behavior_count, uv_count FROM commerce_behavior_summary_incrmental WHERE ds = '2017-05-13' AND behavior_type = 'pv' ORDER BY hour;
Hourly purchases.
-- Hourly purchases
SELECT hour, total_behavior_count, uv_count FROM commerce_behavior_summary_incrmental WHERE ds = '2017-05-13' AND behavior_type = 'buy' ORDER BY hour;
Incremental dashboard display
After the incremental refresh task starts, connect your Dynamic Table directly to an application to query data. This practice connects directly to DataV for real-time dashboard display. Follow these steps.
Create a Hologres data source (optional).
Create your Hologres instance and database as a DataV data source. For details, see DataV.
Create a visualization application.
Log on to the DataV console.
On the workspace page, click Create PC dashboard.
Select an existing template or create a custom one to visualize your data.
This example shows cumulative hourly behavior data. Use a column chart in DataV to visualize incremental data changes clearly.
Scenario 2: Historical ad data analysis and data backfill
Businesses often need to perform association analysis on historical data. Use the full refresh mode of Dynamic Tables to support this. Full refresh processes all data at once. With Dynamic Tables, you can process and compute historical data quickly and then analyze it. This practice uses full refresh to compute the top 10 ad click rankings for the past 7 days. It uses the DataWorks UI to create a Dynamic Table with full refresh.
Create a Dynamic Table
To create a Dynamic Table in DataWorks, enter a table name and add a query SQL statement. If you use the Hologres console, see Full refresh Dynamic Table for full SQL details.
Go to the Workspaces page in the DataWorks console. In the top navigation bar, select a desired region. Find the desired workspace and choose in the Actions column.
Click the
icon on the left and, on the Data Catalog page, select Hologres.Click
, select the DataWorks Data Sources tab, and click Add To Data Catalog in the Actions column of the target data source that you have attached.NoteFor details about binding data sources, see New data development: Attach Hologres compute resources.
Click your target schema under the Hologres directory on the left. Select the Dynamic Tables tab. Click Create dynamic table.
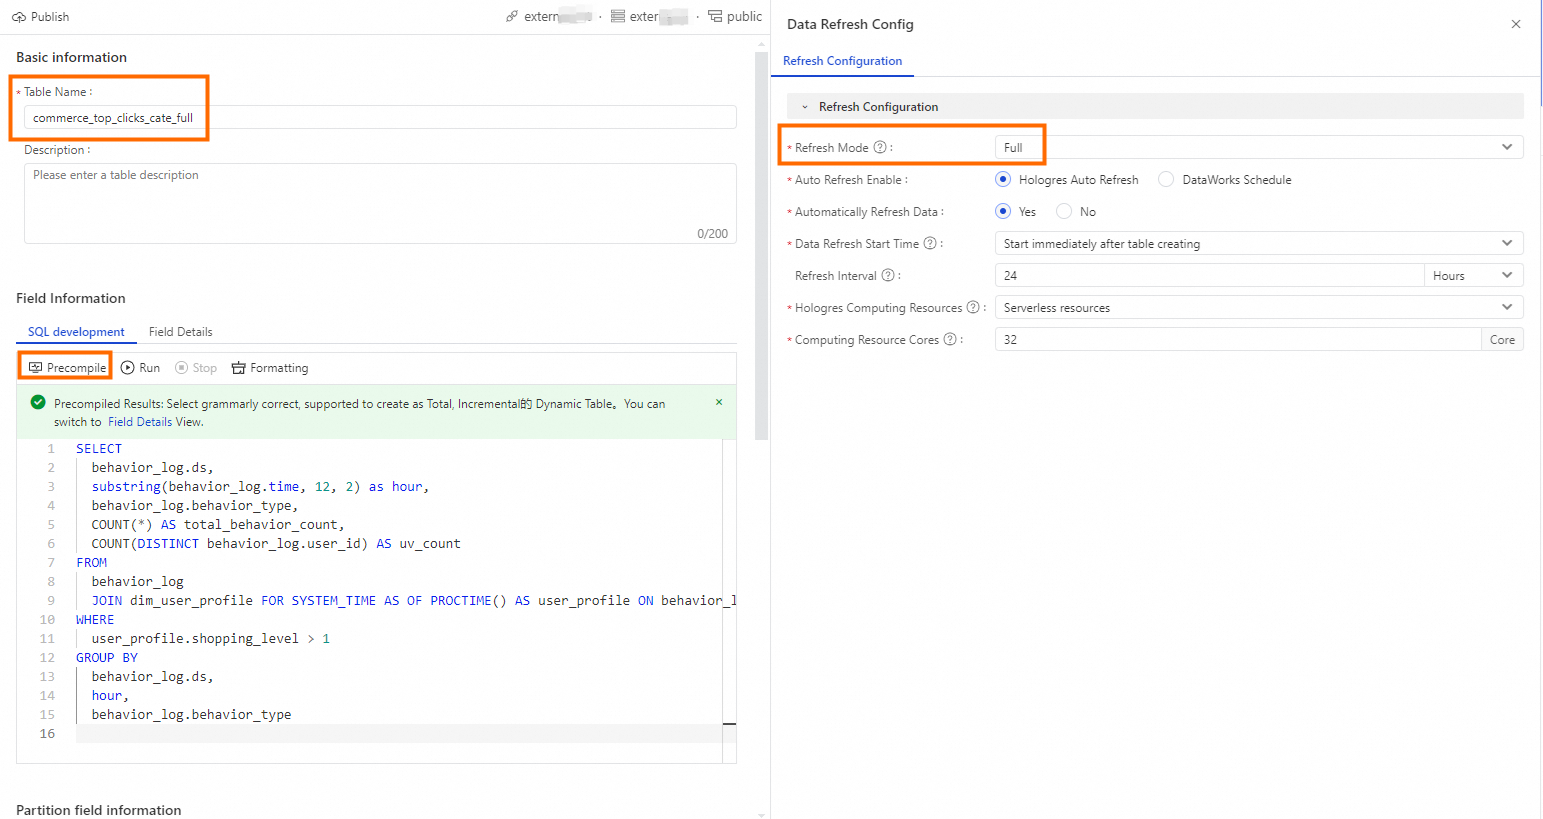
Enter a table name. For example,
commerce_top_clicks_cate_full. If you use a custom name, update the SQL query below accordingly.In the SQL editor, enter the following SQL.
SELECT
  raw_sample.ds,
  ad_feature.cate_id,
  COUNT(*) AS total_browses,
  COUNT(DISTINCT raw_sample.user_id) AS total_unique_visitors,
  SUM(
    CASE WHEN raw_sample.clk = '1' THEN 1 ELSE 0 END
  ) AS total_clicks
FROM
  raw_sample raw_sample
  JOIN dim_ad_feature FOR SYSTEM_TIME AS OF PROCTIME() AS ad_feature ON raw_sample.adgroup_id = ad_feature.adgroup_id
GROUP BY
  raw_sample.ds,
  ad_feature.cate_id;
Click Precompile to check syntax correctness.
On the right, select Refresh policy and configure parameters.
Parameter
Description
Refresh mode
Select Full.
Start time for data refresh
Select Start immediately after table creation.
Refresh interval
24 hours.
Hologres compute resource
Select Serverless resource.
Hologres compute resource specification
32 cores.
After you finish, submit and publish. After successful publishing, the full refresh task runs periodically based on the refresh interval to perform full computation on your data.
Query data
After the full refresh task completes, historical data is fully computed. You can now query the Dynamic Table for data analysis. Example SQL follows.
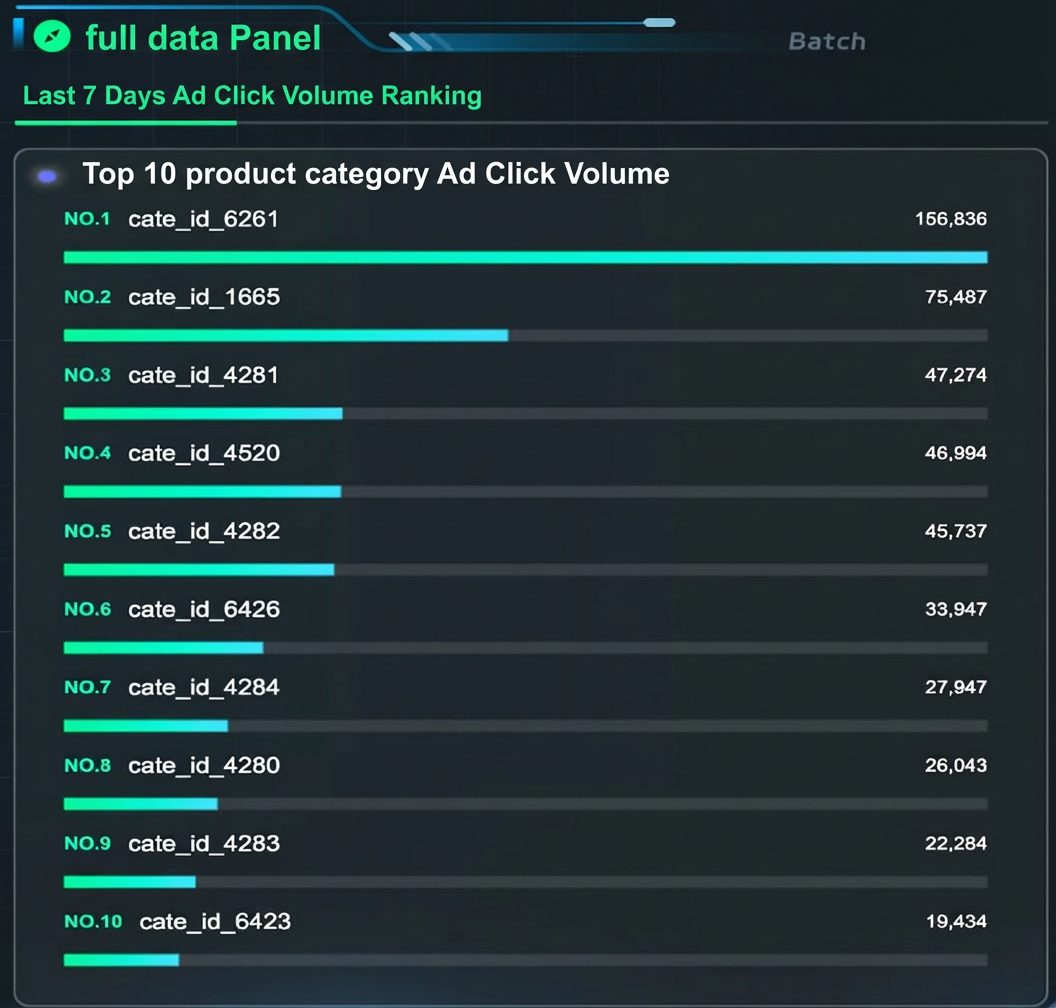
-- Top ad clicks for the past 7 days
SELECT 'cate_id_' || cate_id, sum(total_clicks) AS sum_total_clicks FROM commerce_top_clicks_cate_full WHERE ds <= '2017-05-13' AND ds >= TO_CHAR(ds::date - INTERVAL '6 days', 'YYYY-MM-DD') GROUP BY cate_id ORDER BY sum_total_clicks DESC limit 10;
Full dashboard display
You can connect your Dynamic Table directly to a DataV dashboard. In this practice, the DataV dashboard is already prepared. The data source is connected and the dashboard is configured. Data displays automatically.
Historical data backfill
In practice, historical data may change. To keep data consistent, you must refresh historical data. Use the full refresh mode of Dynamic Tables to backfill historical data. This reduces maintenance effort and improves backfill efficiency. This practice demonstrates backfill. In DataWorks, create a Hologres SQL node and run the following SQL.
Simulate upstream dimension table updates.
Simulate an upstream dimension table update. Run the following SQL in DataWorks to update the dimension table.
Query the data.
SELECT * FROM raw_sample
    JOIN dim_ad_feature FOR SYSTEM_TIME AS OF PROCTIME () AS ad_feature ON raw_sample.adgroup_id = ad_feature.adgroup_id
WHERE ad_feature.cate_id = '6261';
Simulate a dimension table update. Update the dimension table by primary key.
INSERT INTO dim_ad_feature  (adgroup_id,cate_id) VALUES ('451376','888888'),('650847','000000')
ON CONFLICT (adgroup_id)
DO UPDATE SET cate_id = EXCLUDED.cate_id
WHERE dim_ad_feature.cate_id= '6261';
Backfill the Dynamic Table.
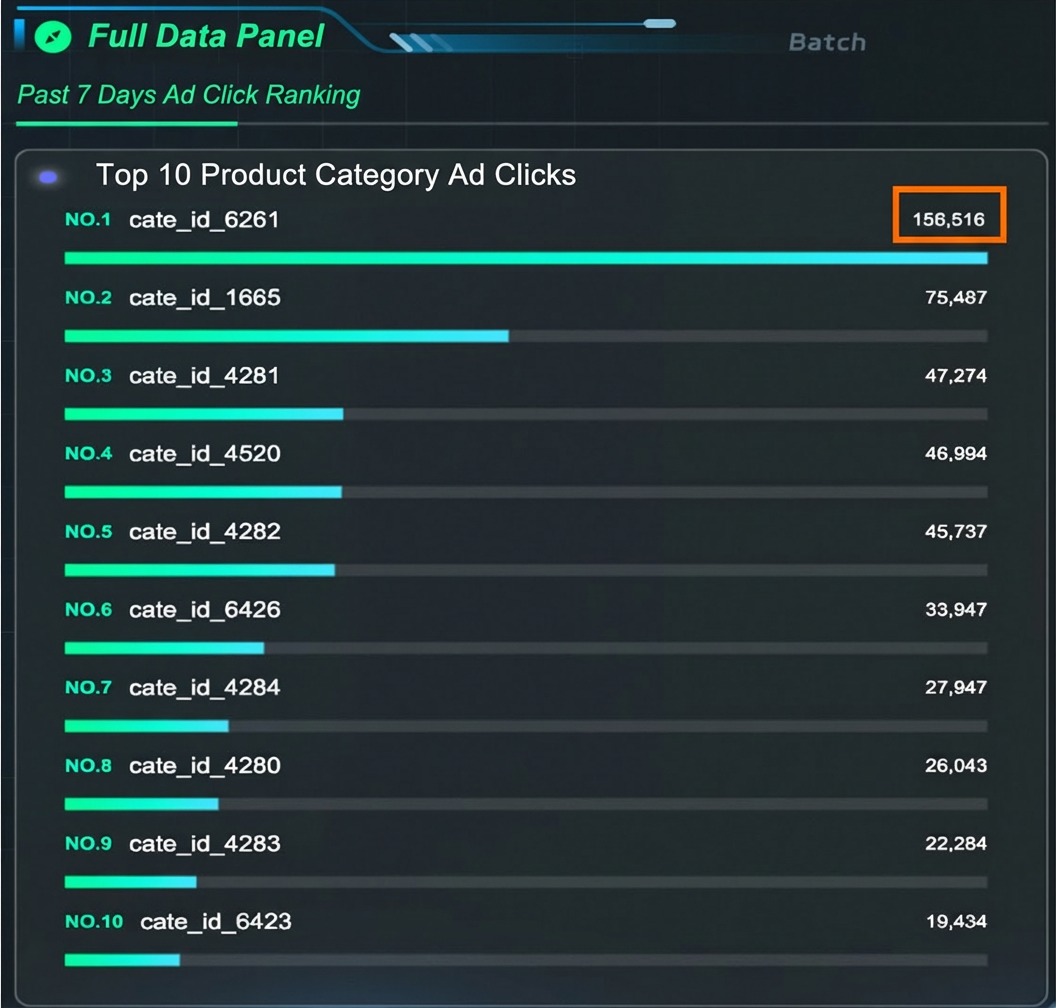
After the dimension table updates, refresh the Dynamic Table to match the new dimension table data. This ensures data consistency. Run REFRESH on the Dynamic Table to complete the backfill.
REFRESH TABLE commerce_top_clicks_cate_full;
After backfill completes, view the DataV dashboard. The full data panel shows updated data.
Appendix: Dynamic Tables
Incremental refresh Dynamic Table
-- Cumulative incremental transaction analysis with incremental refresh
DROP TABLE IF EXISTS commerce_behavior_summary_incrmental;
CREATE DYNAMIC TABLE commerce_behavior_summary_incrmental WITH (
    auto_refresh_enable='true',
    refresh_mode = incremental,
    incremental_auto_refresh_schd_start_time='immediate',
    incremental_auto_refresh_interval = '1 minutes',
    incremental_guc_hg_computing_resource = 'serverless',
    incremental_guc_hg_experimental_serverless_computing_required_cores='32'
)
 AS
SELECT
  behavior_log.ds,
  substring(behavior_log.time, 12, 2) as hour,
  behavior_log.behavior_type,
  COUNT(*) AS total_behavior_count,
  COUNT(DISTINCT behavior_log.user_id) AS uv_count
FROM
  behavior_log
  JOIN dim_user_profile FOR SYSTEM_TIME AS OF PROCTIME() AS user_profile ON behavior_log.user_id = user_profile.user_id
WHERE
  user_profile.shopping_level > 1
GROUP BY
  behavior_log.ds,
  hour,
  behavior_log.behavior_type;
Full refresh Dynamic Table
-- Historical ad data analysis with full refresh
DROP TABLE IF EXISTS commerce_top_clicks_cate_full;
CREATE DYNAMIC TABLE commerce_top_clicks_cate_full    WITH (
    auto_refresh_enable='true',
    refresh_mode = full,
    full_auto_refresh_schd_start_time='immediate',
    full_auto_refresh_interval = '24 hours',
    full_guc_hg_computing_resource = 'serverless'
)
 AS
SELECT
  raw_sample.ds,
  ad_feature.cate_id,
  COUNT(*) AS total_browses,
  COUNT(DISTINCT raw_sample.user_id) AS total_unique_visitors,
  SUM(
    CASE WHEN raw_sample.clk = '1' THEN 1 ELSE 0 END
  ) AS total_clicks
FROM
  raw_sample
  JOIN dim_ad_feature FOR SYSTEM_TIME AS OF PROCTIME() AS ad_feature ON raw_sample.adgroup_id = ad_feature.adgroup_id
GROUP BY
  raw_sample.ds,
  ad_feature.cate_id;