Dynamic feature extraction
This topic describes the dynamic feature extraction component.
Features
The dynamic feature extraction component uses specific calculation methods to process historical data sequences of input variables. The component returns the results as new feature values. It supports eight calculation methods: maximum, minimum, average, standard deviation, linear trend, change trend, first-order difference, and second-order difference.
Calculation logic
Maximum: Returns the maximum value of the sample data sequence.
Minimum: Returns the minimum value of the sample data sequence.
Average: Returns the average value of the sample data sequence.
Standard deviation: Returns the standard deviation of the sample data sequence.
Linear trend: Performs a linear fit on the sample data sequence and returns the coefficient of the linear model.
Change trend: Performs a Mann-Kendall test on the sample data sequence. If no trend is detected, the component returns 0. Otherwise, the component returns the slope parameter.
Mann-Kendall test: The Mann-Kendall trend test, also known as the MK test, is used to analyze time series data for monotonic trends, which are consistently increasing or decreasing trends.
First-order difference:
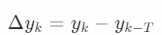 , where k-T is the farthest data point within the sampling period.
For sampling by count, T is the number of samples.
For sampling by time, T is the sampling duration divided by the sampling frequency, rounded down.
If the amount of cached yk data is less than T, the component returns 0 and the quality code is -1.
Second-order difference:
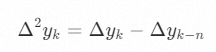
For sampling by count, n = T.
For sampling by time, n is the sampling duration divided by the canvas execution epoch, rounded to the nearest integer.
If the amount of cached Δyk data is less than n, the component returns 0 and the quality code is -1.
Parameters
IN port - Input parameters
Parameter name | Description | Required | Input Data Type | Data Source Type |
IN | Configure the variables to process and their corresponding feature calculation methods. | Yes | Integer or floating-point number | Any |
OUT port - Output parameters
Parameter name | Description | Output data type |
OUT | The feature output values for each input variable after feature extraction. | Floating-point number |
Other parameters
Parameter | Description | Required | Default Value | Valid Range |
Sampling method |
| Yes | By count |
|
Sampling method: By time
Parameter name | Description | Required | Default Value | Valid Range |
Sampling duration | The duration for reading historical IGate data, in seconds. Note If the input variable is not an IGate data point, data from a specific number of past inputs is used (Number of samples = Sampling duration / Canvas scheduled time interval). | No | 60 | [1,7200] |
Sampling frequency | The frequency for reading historical IGate data, in seconds. For example, if you set this parameter to 5, historical IGate data is sampled at 5 second intervals. Note If the input variable is not an IGate data point, this parameter is invalid. | No | 5 | [1,7200] |
Sampling method: By count
Parameter name | Description | Required | Default Value | Valid Range |
Number of samples | The number of historical samples to use. | No | 5 | [1,1800] |
Output quality codes
The output quality codes for variables are processed as follows:
If the length of the retrieved sample data or the length of the valid sample data is 0, the output quality code for the variable is 0.
If both the length of the retrieved sample data and the length of the valid sample data are greater than 0, the output quality code for the variable is 192.
When calculating the first-order or second-order difference, if the length of the valid sample data is less than the difference period (T or n), the output quality code is -1.
When calculating the change trend, if the length of the valid sample data is less than 2, the output quality code is -1.
Additional information
Sample data pre-processing:
After obtaining sample data based on the sampling method, the algorithm removes all invalid sample data. Only valid sample data is used for filtering calculations.
Output post-processing:
If the output quality code is good, the component returns the current calculated feature value.
If the output quality code is bad:
For maximum, minimum, average, standard deviation, and linear trend, the component returns the previous output value. If no previous output value exists during initialization, the component returns the current input value.
For first-order difference, second-order difference, or change trend, the component returns 0.
① Good quality code: A quality code that is equal to -1 or greater than or equal to 192.
② Bad quality code: A quality code in the range of [0, 192).
③ Invalid sample data: Data is considered invalid if it meets any of the following conditions.
The data is missing the `timestamp` or `value` field.
The `timestamp` value is not a millisecond-level timestamp.
The `value` is not a number.
The quality code is bad.