Monitoring information
IoT Edge monitors gateways and resources such as drivers, Function Compute, and scene orchestration.
Prerequisites
- Create an edge instance and ensure the gateway is online. For more information, see Set up the environment.
- Assign resources such as drivers, Function Compute, and scene orchestration to the edge instance and deploy the instance.
- Grant the edge instance the permission to manage CloudMonitor. For more information, see Access cloud resources
- On the Instance Details page, go to the Monitoring Information tab and turn on the Cloud Monitor Status button.
Host monitoring
After you create an edge instance and ensure the gateway is online, go to the Instance Details page. On the Monitoring Information tab, select Host Monitoring to view host monitoring information.
Host Monitoring provides various metrics for the gateway, such as CPU, memory, disk, and network, to meet basic Operations and Maintenance (O&M) requirements.
In the upper-left corner of the Host Monitoring tab, you can select a sampling period. You can then view the gateway metrics for that period in the table below.
| Metric | Parameter name | Description |
| CPU usage | cpu_total | The percentage of total CPU that is currently in use. |
| Memory usage | memoryusage_utilization | The percentage of total memory that is currently in use. |
| System average load
Note For information about how the system average load is calculated, see the note below this table.
|
load_1m | The average load of the gateway over the past 1 minute. |
| load_5m | The average load of the gateway over the past 5 minutes. | |
| load_15m | The average load of the gateway over the past 15 minutes. | |
| Disk usage | diskusage_utilization | The percentage of total disk space that is currently in use. |
| Network I/O rate (bps) | networkin_rate | The number of bits received by the network interface controller (NIC) per second. This is the upstream bandwidth of the NIC. |
| networkout_rate | The number of bits sent by the NIC per second. This is the downstream bandwidth of the NIC. | |
| Network I/O packets (pps) | networkin_errorpackages | The number of error packets received by the NIC per second. |
| networkin_packages | The number of data packets received by the NIC per second. | |
| networkout_errorpackages | The number of error packets sent by the NIC per second. | |
| networkout_packages | The number of data packets sent by the NIC per second. |
The system average load value is the same as the Linux system load average. This value represents the demand that a process or thread places on system resources, such as the CPU, memory, or input/output (I/O), over a period of time. For example, load_1m is the average load of the gateway over the past 1 minute.
The system average load value is recorded in the /proc/loadavg file in Linux. You can use the uptime or top tool to view the system average load value.
- `load_1m`, `load_5m`, or `load_15m` is close to 0: The system is idle.
- `load_1m` is greater than `load_5m` or `load_15m`: The system load is increasing.
- `load_1m` is less than `load_5m` or `load_15m`: The system load is decreasing.
- `load_1m`, `load_5m`, and `load_15m` are all greater than the number of system CPUs: The system may be abnormal.
To set alert configurations for host monitoring, follow these steps:
- On the Monitoring Information tab, click Alert Configuration.
- In the CloudMonitor consoleAlert Rules tab for your edge instance and create a new alert rule.
When you create the alert rule, do not change the Associated Instance. For more information about the other parameters, see Monitor a host.
In the Instance Processes section, you can view detailed information about each instance process, such as CPU usage and memory usage.
Scene orchestration
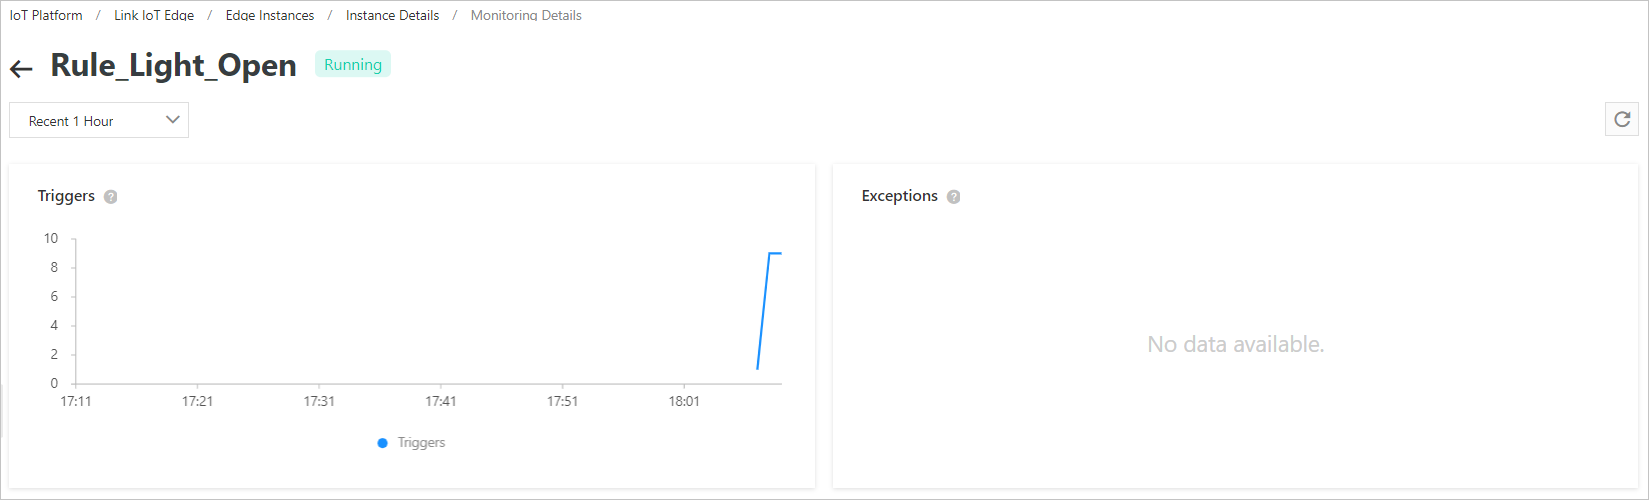
After you assign a scene orchestration rule to an edge instance and deploy the instance, go to the Monitoring Information section. On the Scene Orchestration tab, click View next to the scenario name to view its monitoring information.
Edge applications
After you assign an edge application to an edge instance and deploy the instance, go to the Monitoring Information section. On the Edge Application tab, click View next to the application name to view its monitoring information.
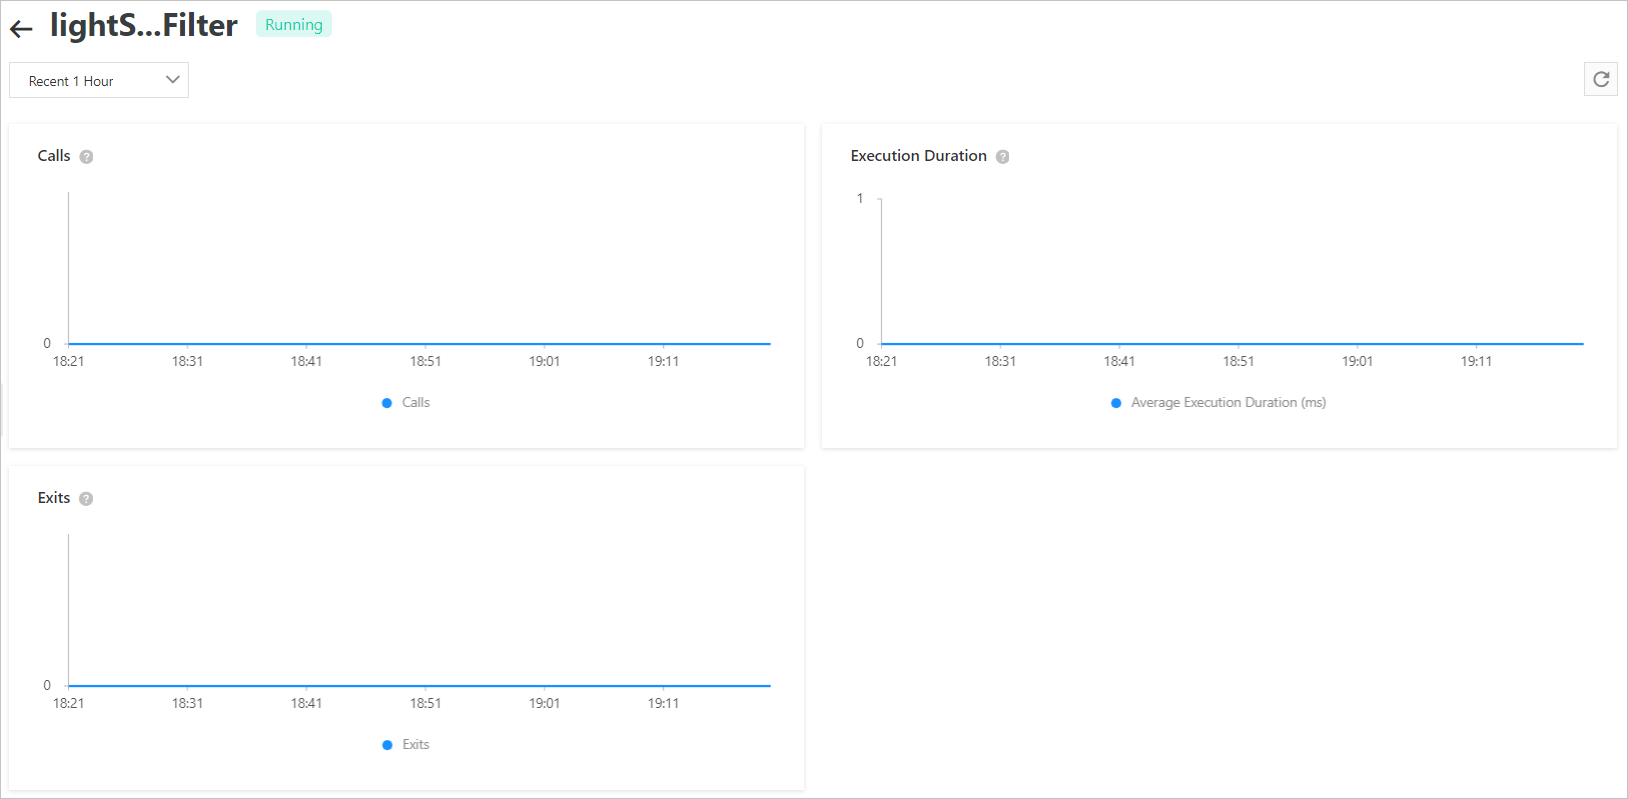
| Metric | Description |
| Number of calls | The number of times the function was called during the sampling period. |
| Running time | The average time to process a request each time the function is called, in milliseconds. |
| Number of exits | The number of times the process or container for the function exited during the sampling period. |
Driver monitoring
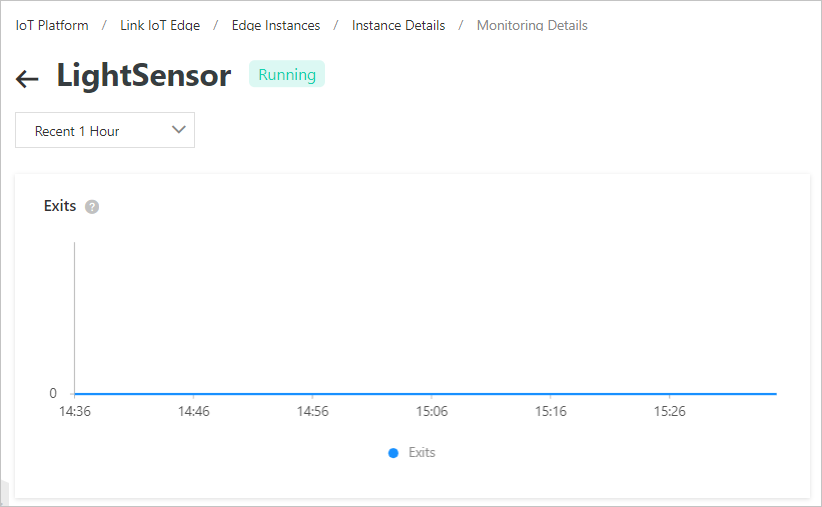
After you assign a driver and a sub-device to an edge instance and deploy the instance, go to the Monitoring Information section. On the Driver Monitoring tab, click View next to the driver name to view its monitoring information.
Stream data monitoring
After you assign a stream data task to an edge instance and deploy the instance, go to the Monitoring Information section. On the Stream Data Monitoring tab, click View next to the task name to view its monitoring information.
In the upper-left corner of the stream data monitoring details page, you can select a sampling period. You can then view the number of triggers for the stream data task during that period.