View business services
In IoT Studio, you can view the basic information, logic configuration, and monitoring and O&M data for your business services to monitor their real-time operational status.
Background information
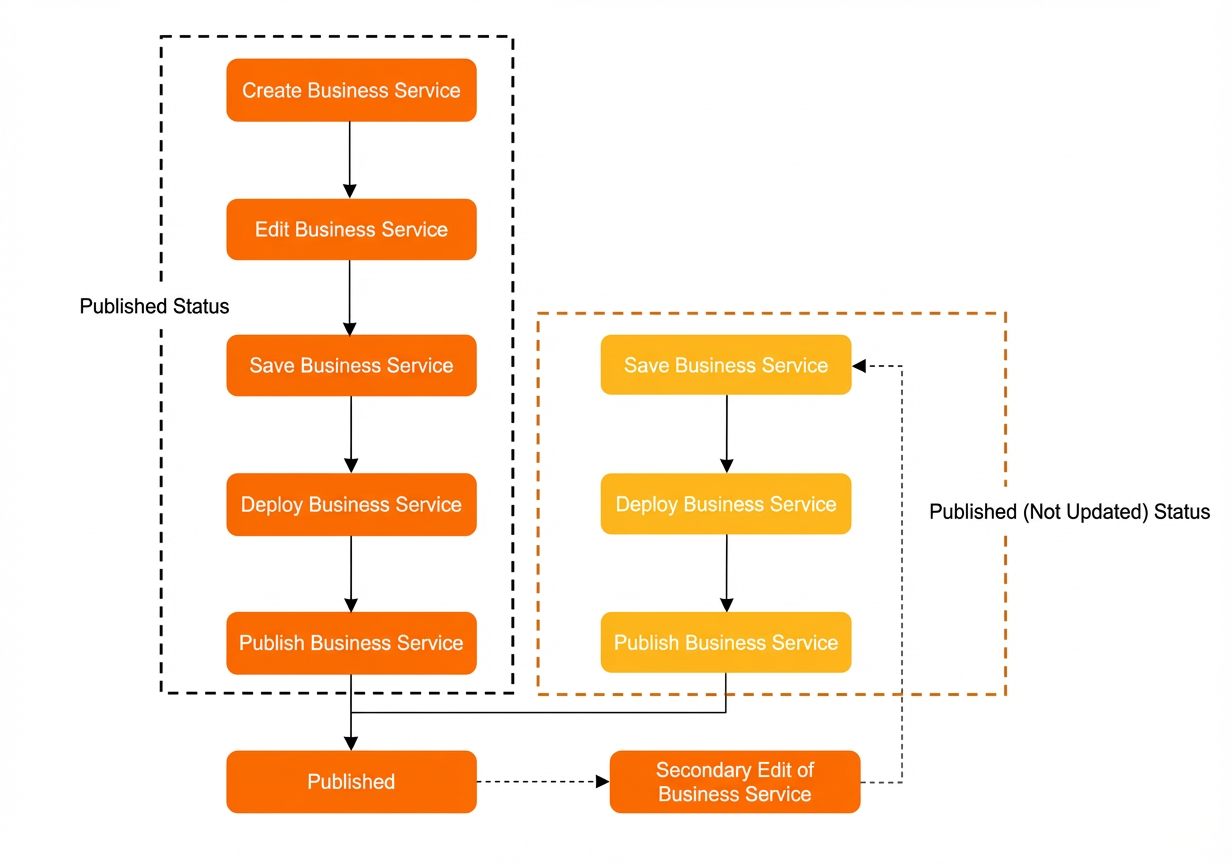
In IoT Studio, a business service can have one of two publishing statuses:
-
Published: Services that have been published, including those with pending updates.
-
Unpublished: Services that have been created but not yet published.
In the IoT Studio workbench:
-
By default, the business service list displays all services regardless of their publishing status.
-
Web applications, mobile applications, and your code can only call published business services.
View business services
-
View business services for all projects
-
In the Recent Development section, select the Business Logic tab.
By default, the page displays a list of business services under All Publish Statuses. The list includes the service name, description, associated project, last modified time, publishing status, publish time, running status, and available actions.
NoteThe "Not Updated" status indicates that a published business service has an edited draft that may differ from the version running in the production environment. You can publish the draft from the workbench to update the production version.
-
-
View business services for a single project
-
In the project list, click the card for your target project.
You can also click Global Resource Project to open its details page.
-
On the project Homepage, in the Project Development section, select the Business Logic tab.
By default, the page displays information for business services with All Publish Statuses.
The business logic list includes the Name, Description, Last Modified, Publish Status, Publish Time, Running Status, and Actions columns. From here, you can Edit, Copy, or Delete a business service. You can also click Create to add a new business service.
-
You can use the search bar to enter keywords and find a specific business service.
Manage business services
In the business service list under All Publish Statuses, click an option in the Actions column to manage a service.
|
Actions |
Description |
|
Edit |
Opens the business service editor, where you can configure its business logic. Note
Editing a published business service does not affect the production version. |
|
Start |
Starts the device listener. If a business service uses a device trigger, you must start this listener to allow the service to be invoked. |
|
Stop |
Stops the device listener for a published business service. |
|
Logs |
Opens the Service Logs page for the business service. Note
This action is not supported for business services that contain an HTTP Request node. |
|
Copy |
Creates a copy of an existing business service. |
|
Delete |
Deletes an existing business service. |
Service monitoring and O&M
-
In the business service list under All Publish Statuses, find your target service and click Logs in the Actions column.
-
On the Service Logs tab of the Service Monitoring and O&M page, view the invocation times and node execution logs for the business service.
You can choose to view all logs or only error logs. You can also filter logs by a specific time range or search for them by using keywords.
-
On the Service Monitoring and O&M page, select the Node Layout tab to view the arrangement of nodes.
Click a node. The configuration for that node appears on the right side of the canvas. To modify the node configuration, go to the business service development workbench, edit the service, and republish it.
-
On the Service Monitoring and O&M page, select the Data Overview tab to view statistics for the business service.
You can view statistics for all services or select a specific service.
-
View the total service calls, total service errors, and total service running time for the current month.
-
View the service call and error distribution chart. This chart shows trends in service calls and errors to help you assess the service's overall health.
-
View the service runtime distribution chart. This chart displays minute-by-minute trends in service runtime. Use this data to identify periods when the service runs slowly and to optimize its configuration.
-