Configure algorithm instances
An algorithm instance is created from an algorithm template. It uses your configured detection parameters and the algorithm model to detect and diagnose anomalies in your data. This helps you interpret device data, monitor the operational status of your devices, and promptly identify potential faults.
Prerequisites
You have created an algorithm instance. For more information, see Create an algorithm instance.
Background information
IoT Platform provides the following algorithm templates: I-V curve diagnosis, power time series curve diagnosis (multi-site ranking), power time series curve diagnosis (single-site detection), and time series anomaly detection. For more information about the features and application scenarios of these templates, see I-V curve diagnosis, Power time series curve diagnosis, and Time series anomaly detection.
View algorithm instances
-
In the IoT Platform console, go to the Overview page and click the ID or alias of the target Enterprise Edition instance.
In the navigation pane on the left, choose Data Service > Data Intelligence, and then click the Algorithm Instances tab.
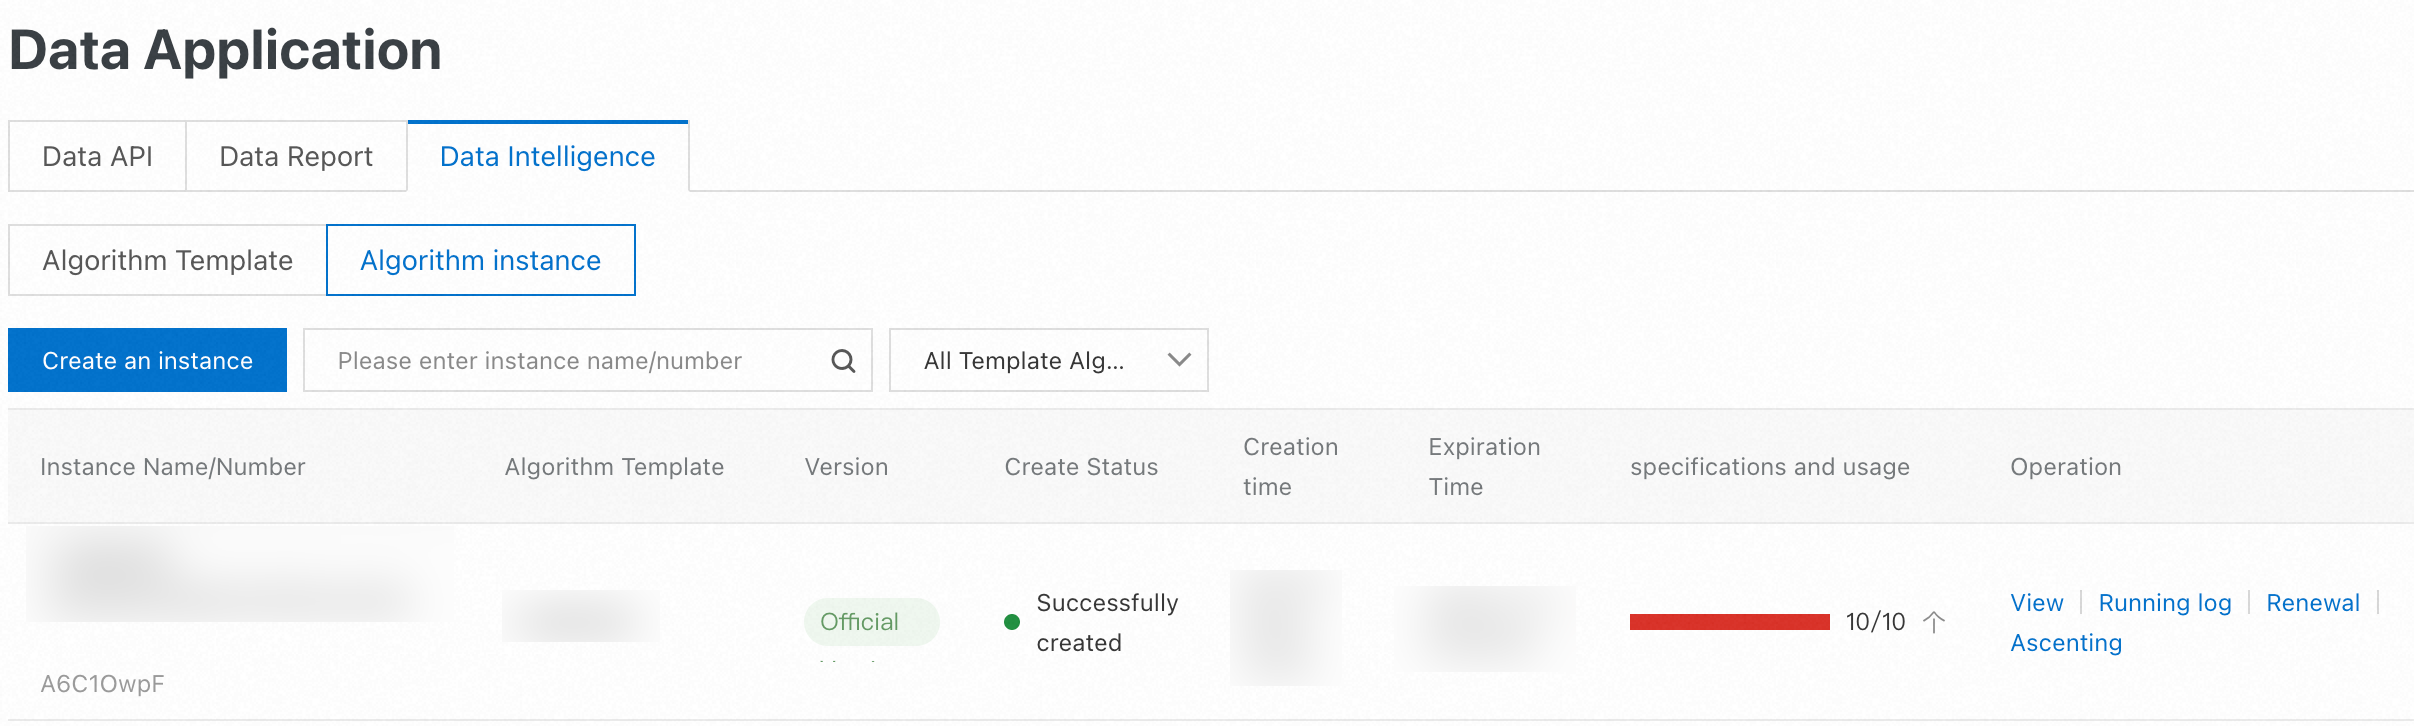
On the Algorithm Instances page, you can view information such as the Instance Name, Creation Status, and Specifications and Usage. The Specifications and Usage section shows your subscribed quota and current usage.
If your usage exceeds your subscription quota, you cannot create new detection tasks from the console or by calling an API. For single-site power time series detection and I-V curve diagnosis algorithm instances, you cannot add new sites or arrays, but you can still create detection tasks.
Click Upgrade in the Actions column to purchase additional detection quotas.
(Optional) Set a recognizable name for the algorithm instance.
Move the mouse pointer over the instance name. An edit icon
 appears.
Click the edit icon. In the pop-up dialog box, enter a custom instance name.
The instance name can contain Chinese characters, English letters, digits, and underscores (_). The name cannot start with a digit or an underscore, must be 30 characters or less in length, and each Chinese character is counted as two characters.
Click OK.
Configure algorithm instances
Configure your algorithm instance based on its algorithm template to use the algorithm model and obtain detection results.
I-V curve diagnosis
Perform pattern analysis on string I-V curves by configuring arrays to detect faults in photovoltaic (PV) plant strings. This allows for simple and efficient Operations and Maintenance (O&M) and reduces costs. For detailed instructions, see I-V curve diagnosis.
Create an array
The total number of arrays that you create cannot exceed the Specifications and Usage quota of your current I-V curve diagnosis algorithm instance.
On the Algorithm Instances tab, find the instance for which the Algorithm Template is PV Intelligent O&M - IV Curve Diagnosis, and then click View in the Actions column.
On the instance details page, click Create Array.
In the panel that appears on the right, configure the array information as prompted.
Set the Basic Information, and then click Next.
Parameter
Description
Array name
Can contain digits, letters, and underscores (_). Cannot start with a digit. Maximum length is 32 characters.
Array description
Optional. Enter a description for the array.
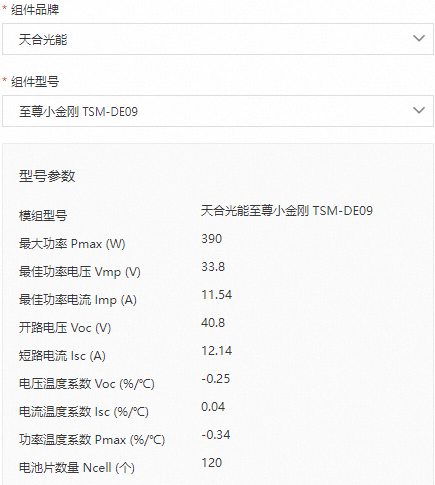
Select the Brand and Model, and then click Next.
You can select a Module Brand and Module Model. The following performance metrics are available for detection:
NoteIf the module brands and models provided by IoT Platform do not meet your business needs, you can submit a ticket to specify your required brands and models.
Jinko Solar
JA Solar
LONGi Green Energy
Astronergy
Trina Solar
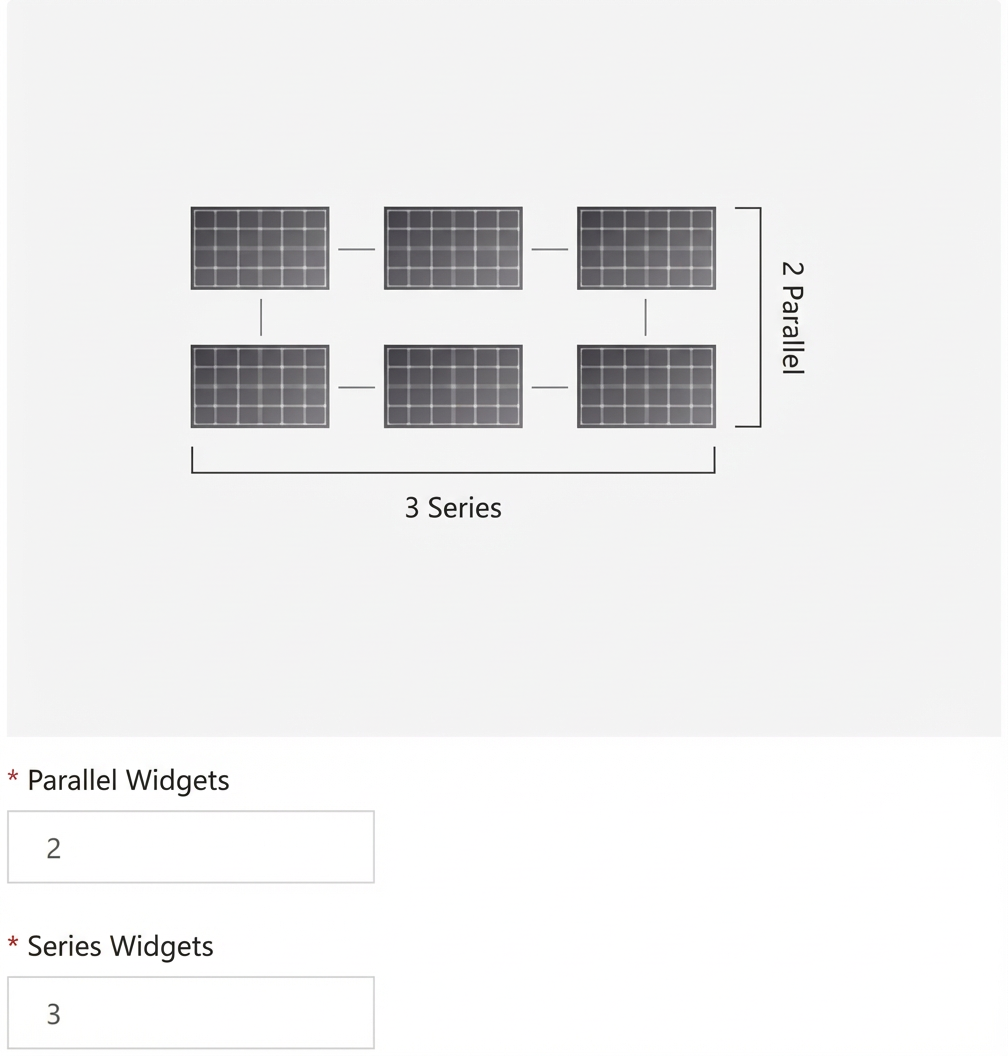
In the Module Count section, set the Number of Modules in Parallel (an integer from 1 to 6) and Number of Modules in Series (an integer from 1 to 10). You can preview the array diagram.
Click Finish.
(Optional) To modify array information, find the target array in the array list, and click Edit in the Actions column. Then, you can modify the Basic Information, Brand and Model, and Module Count.
Configure IV detection
In the array list, find the target array and click IV Detection in the Actions column.
In the panel that appears on the right, configure the detection data. This includes Ambient Light Intensity, Environmental Temperature, Collection Time, and Upload IV Data.
The valid ranges and units for Ambient Light Intensity, Environmental Temperature, and Collection Time are shown in the input field prompts.
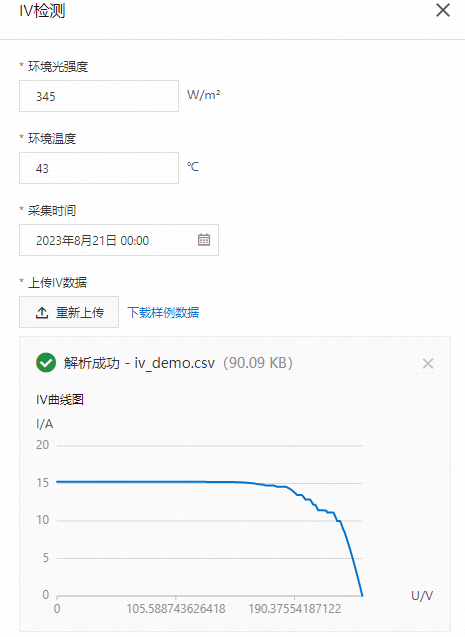
Click Start Detection.
After the detection is complete, a dialog box appears with the detection results. You can view the Diagnosis Status and the corresponding Probability.
Click Expand I-V Curve Graph to view the detected I-V curve.

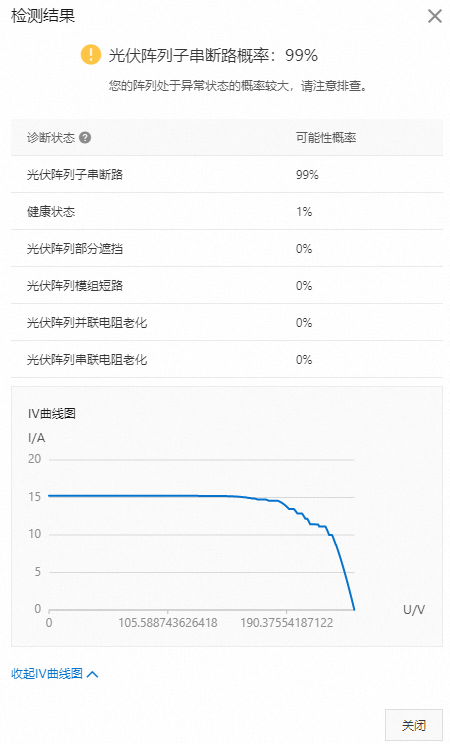
If the algorithm returns an error, the detection fails. Correct the input parameters based on the error message and repeat the preceding IV detection steps.
The error response parameters are as follows:
Parameter name |
Type |
Description |
code |
int |
Error code. Fixed value: 500. |
requestId |
String |
Unique identifier generated by Alibaba Cloud for this request. |
error_message |
String |
Error message. Includes:
|
Optional: View detection records
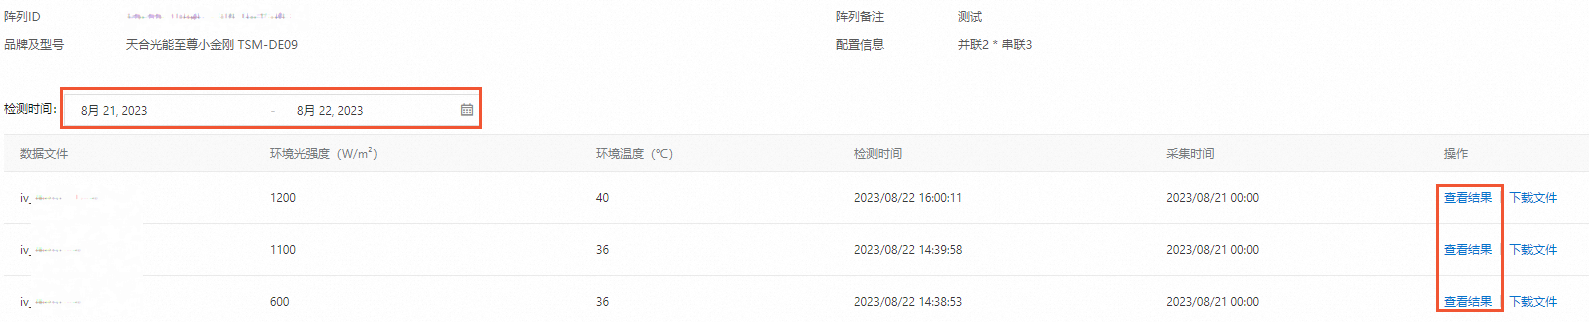
On the Instance Details page, click Detection Records in the Actions column of the target array.
Specify the Detection Time. Click View Results in the Actions column of the target record to view its detection results.
Power time series curve diagnosis
Data Service provides power time series curve diagnosis for single-site detection and multi-site ranking. Depending on the algorithm instance that you purchased, you can upload power time series data to detect the efficiency of photovoltaic power generation.
For more information about single-site detection and multi-site ranking for power time series curve diagnosis, see Usage instructions and scenarios for power time series curve diagnosis.
Power time series curve diagnosis (multi-site ranking)
On the Algorithm Instances tab, find the Power Time Series Curve Diagnosis (Multi-Site Ranking) algorithm instance, and then click View in the Actions column.
In the Detection List section, click Power Time Series Detection.
In the Power Time Series Detection panel that appears on the right, configure the data to be detected.
Parameter
Description
Detection sensitivity level
Options: High, Medium (default), Low.
For the same batch of power generation data, the number of sites flagged as low-efficiency decreases as sensitivity level decreases from high to low. Higher sensitivity levels flag more sites as low-efficiency.
Number of sites to detect
Enter the number of sites to detect. Minimum is 20. Maximum cannot exceed the Specifications and Usage quota of your current Power Time Series Curve Diagnosis (Multi-Site Ranking) algorithm instance.
Date to detect
Select the date of the time series power data to detect.
Upload power time series data
Click Download Sample Data to get a CSV file. The file contains the following fields:
dates: Timestamps of time series power generation data, inYYYY-MM-DD HH:mm:ssformat.Power_${ID}:${ID}consists of digits or English letters.Power_${ID}serves as the site ID to identify different power plants. Its value is the site's time series power generation data.
ImportantAll fields above are required. The following requirements must be met. Detection fails if any field is empty or incorrect.
Timestamps in the
datescolumn must fall within the selected Date to detect. We recommend a 5-minute interval between timestamps.The number of
Power_${ID}columns must match the configured Number of sites to detect.
You can upload up to 288 data points at a time.
After successful parsing of the uploaded power time series data, the functional time series curve graph appears.
Click Start Detection.
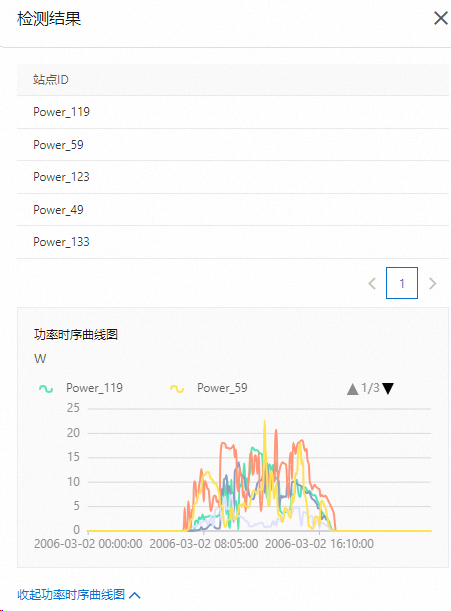
After the detection is complete, the detection results panel appears on the right. You can view the IDs of sites that have low power generation efficiency.
Click Expand Power Time Series Curve Graph to view the detected power time series curve.
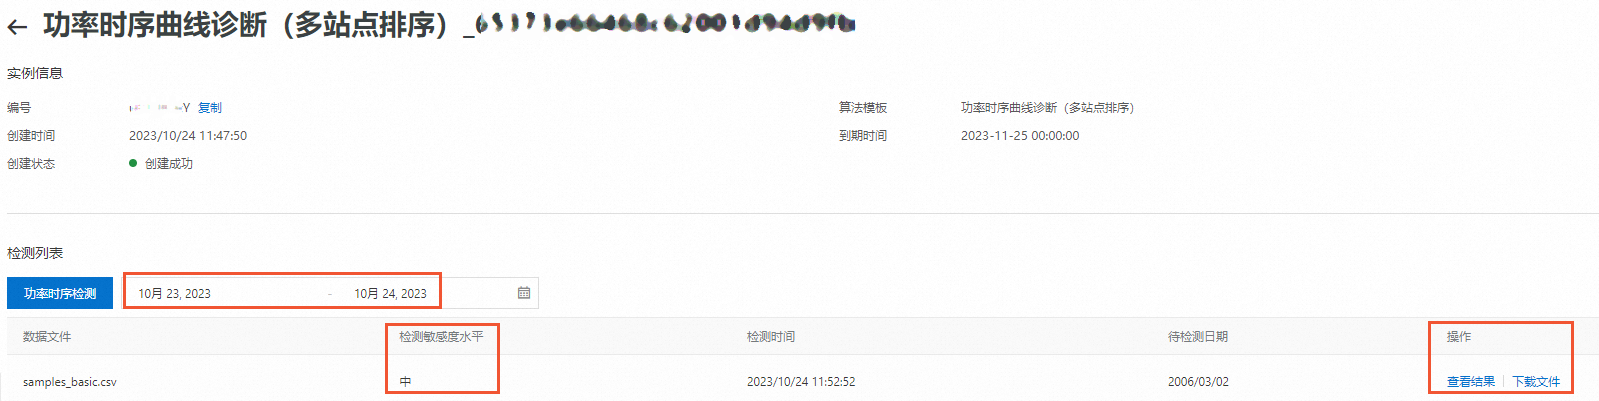
(Optional) On the Instance Details page, specify the Detection Time. Click View Results in the Actions column of the target record to view its detection results.
Power time series curve diagnosis (single-site detection)
Create a power plant
The total number of power plants that you create cannot exceed the Specifications and Usage quota of your current Power Time Series Curve Diagnosis (Single-Site Detection) algorithm instance.
On the Algorithm Instances tab, find the Power Time Series Curve Diagnosis (Single-Site Detection) algorithm instance, and then click View in the Actions column.
In the Power Plant List section, click Create Power Plant.
In the dialog box that appears, set the power plant name, power rating, and description.
Parameter
Description
Power plant name
Custom name. Must be unique within the same algorithm instance.
Power rating
Enter the power rating in kW. This serves as the standard power for single-site time series power detection.
Power plant description
Optional. Enter a description to help identify and manage the power plant later.
Click Confirm.
(Optional) To modify power plant information, find the target power plant in the power plant list, and click Edit in the Actions column. Then, you can modify the Power Plant Name, Power Rating, and Power Plant Description.
Configure power time series detection
In the Power Plant List section, find the target power plant and click Power Time Series Detection in the Actions column.
In the Power Time Series Detection panel that appears on the right, configure the data to be detected.
Parameter
Description
Date to detect
Select the start time of the collected time series data.
Upload power time series data
Click Download Sample Data to get a CSV file. The file contains the following fields:
dates: Timestamps of power generation data, inYYYY-MM-DD HH:mm:ssformat.power: Time series power generation data.irradiance: Time series irradiance, in W/㎡.rated_power: Power rating. Serves as the standard power for single-site time series power detection.
ImportantAll fields above are required. The following requirements must be met. Detection fails if any field is empty or incorrect.
Timestamps in the
datescolumn must fall within the selected Date to detect. We recommend a 5-minute interval between timestamps.The
rated_powervalue must match the entered Power Rating value.
After successful parsing of the uploaded power time series data, the functional time series curve graph appears.
Click Start Detection.
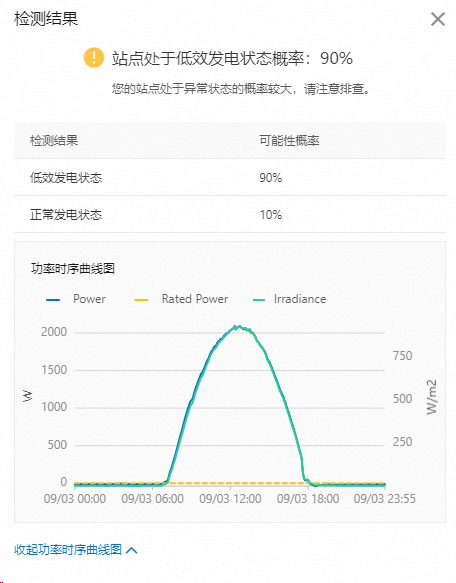
After the detection is complete, a Detection Results dialog box appears. You can view the Detection Results and the corresponding Probability.
Optional: View detection records
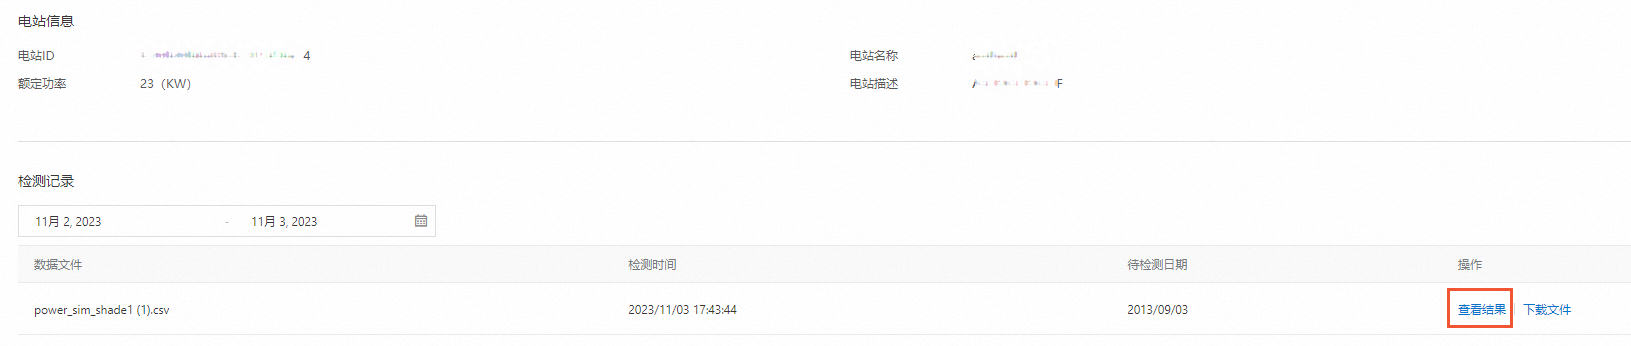
In the power plant list, find the target power plant and click Detection Records in the Actions column.
Above the Detection Records list, specify the Detection Time. Click View Results in the Actions column of the target record to view its detection results.
Time series anomaly detection
Data Service provides two types of anomaly detection: anomaly points and anomaly intervals. You can upload device time series data based on the detection type that you select to detect anomalies in the time series. For detailed instructions, see Time series anomaly detection.
On the Algorithm Instances tab, find the Time Series Anomaly Detection algorithm instance, and then click View in the Actions column.
In the Detection List section, click Time Series Anomaly Detection.
In the Time Series Anomaly Detection panel that appears on the right, configure the data to be detected.
Parameter
Description
Anomaly detection type
Options:
Anomaly point: Detects anomaly points in device time series data and highlights anomalous data points.
Anomaly interval: Detects anomaly intervals in device time series data. Adjacent intervals with significant data fluctuations are displayed in different colored blocks.
Detection sensitivity level
This parameter appears only when Anomaly detection type is set to Anomaly point. Options: High, Medium (default), Low.
For the same batch of time series data, the number of detected anomaly points decreases as sensitivity level decreases from high to low. Higher sensitivity levels detect more anomaly points.
Window size
This parameter appears only when Anomaly detection type is set to Anomaly interval.
Sets the number of consecutive time series points selected in one sliding window during detection. The algorithm compares the shape differences between the first and second halves of the window to determine if a change point exists within the window. Larger windows include more data points, making interval statistical features more pronounced.
NoteA large window may overlook local small-interval anomalies. Set the window size based on your specific metric data and business scenario.
Window size must be an even number between 20 and 2000. Default is 200 if not set.
Penalty value
This parameter appears only when Anomaly detection type is set to Anomaly interval.
Sets the sensitivity for detecting anomalous fluctuation intervals:
A smaller penalty value increases detection sensitivity and detects more change points.
A larger penalty value decreases detection sensitivity and detects fewer change points.
Penalty value range is 0 to 10000. Default is 10 if not set.
Upload time series anomaly detection data
Click Download Sample Data to get a CSV file. The file contains the following fields:
value: Data to be detected.dates: Timestamps of the data to be detected, inYYYY-MM-DD HH:mm:ssformat. We recommend a 5-minute interval between timestamps.
ImportantAll fields above are required and must meet the specified requirements. Detection fails if any field is empty or incorrect.
Uploaded file size cannot exceed 50 KB.
After successful parsing of the uploaded time series anomaly detection data, the time series anomaly curve graph appears.
Click Start Detection.
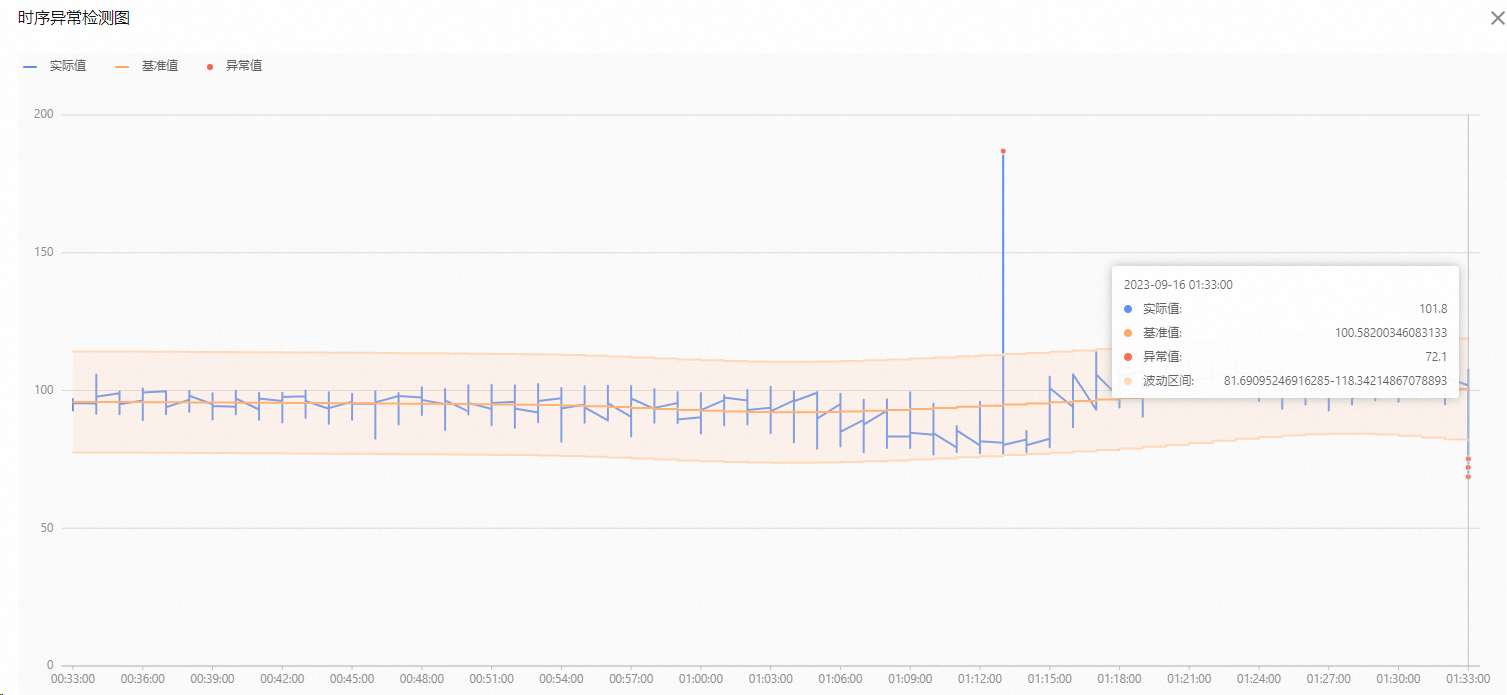
After the detection is complete, a detection results dialog box appears. You can view the highlighted anomaly data.
Click the zoom-in icon
to expand the time series anomaly detection graph and view anomaly data with the corresponding timestamps.(Optional) On the Instance Details page, specify the Detection Time . Click View Results in the Actions column of the target record to view its detection results.
 to expand the time series anomaly detection graph and view anomaly data with the corresponding timestamps.