Appendix: Supported diagnostic scenarios
This document covers the diagnostic scenarios supported by Cloud Service Diagnosis. For more details, refer to other help documents in this section.To suggest new diagnostic features or provide feedback, join our DingTalk group (ID: 86570007290).
Diagnostic scenarios
See the supported diagnostic scenarios below. We are continually adding more.
Compute
Diagnostic product: ECS
Diagnostic target: Running ECS instance
Description: If you suspect an issue with your ECS instance but are unsure of the cause, use the ECS comprehensive diagnosis diagnostic tool to troubleshoot issues related to compute resources, operating system configurations, instance configurations, network services, security controls, and billing. Follow the provided suggestions to resolve the issue and restore your service.
Diagnostic entry: ECS comprehensive diagnosis
Diagnostic product: ECS
Diagnostic target: Running ECS instance
Description: If you cannot remotely connect to an ECS instance, use the ECS Remote Connection Failure tool to quickly diagnose the cause. The diagnosis covers instance configuration management, network services, operating system settings, compute services, and billing. Follow the provided suggestions to resolve the issue and restore your service.
Diagnostic entry: ECS Remote Connection Failure
Diagnostic product: ECS
Diagnostic target: ECS instance
Description: If you suspect your ECS instance has been attacked or compromised, use the ECS Instance Security Risks tool to quickly check the ECS instance for security risks. If risks are found, you can follow the suggestions to resolve them and secure your instance.
Diagnostic entry: ECS Instance Security Risks
Diagnostic product: ECS
Diagnostic target: ECS instance
Description: If you notice high CPU, disk, or memory utilization, or slow system response on your ECS instance, use the ECS instance high load tool to quickly diagnose the cause of the high load. The tool diagnoses the load on the instance's CPU, memory, disk IOPS or BPS, and bandwidth. Follow the provided suggestions to resolve the issue and restore your service.
Diagnostic entry: ECS instance high load
Diagnostic product: ECS
Diagnostic target: ECS instance
Description: If you find that your ECS instance is locked or suspect it has been blocked, use the ECS Instance Security Control tool to quickly identify the cause and impact of any security control events on the instance. Follow the provided suggestions to resolve the issue and restore your service.
Diagnostic entry: ECS Instance Security Control
Diagnostic product: ECS
Diagnostic target: ECS instance
Description: If your ECS instance experiences a system crash, blue screen, freeze, automatic restart, or downtime, use the ECS Instance Downtime tool to quickly diagnose the causes of these issues. Follow the provided suggestions to resolve the issue and restore your service.
Diagnostic entry: ECS Instance Downtime
ECS Network Performance Degradation
Diagnostic product: ECS
Diagnostic target: ECS instance
Description: If you experience slow network speed, frequent packet loss, or abnormal network sessions on your ECS instance, use the ECS Network Performance Degradation tool to quickly diagnose the cause of these issues. Follow the provided suggestions to resolve the issue and restore your service.
Diagnostic entry: ECS Network Performance Degradation
Insufficient ECS Resource Quota
Diagnostic product: ECS
Diagnostic target: region
Description: If you cannot create a security group or an image, or save data to a cloud disk in a specific region, use the Insufficient ECS Resource Quota tool to quickly check if your resource quota in that region is sufficient. If the quota is insufficient, follow the suggestions to increase it and restore your service.
Diagnostic entry: Insufficient ECS Resource Quota
ECS Cost and Security Behavior Audit
Diagnostic product: ECS
Diagnostic target: ECS instance
Description: If you notice that a security group has been modified, an instance has been stopped unexpectedly, costs have increased unexpectedly, or the number of instances has changed for no apparent reason, use the ECS Cost and Security Behavior Audit tool to quickly check for unexpected changes related to instances, security groups, and costs. If anomalies are found, follow the provided suggestions to resolve the issue and restore your service.
Diagnostic entry: ECS Cost and Security Behavior Audit
Diagnostic product: ECS
Diagnostic target: Running Linux ECS instance
Description: If a cloud disk resize has not taken effect on your ECS instance, use the ECS Cloud Disk Resize Failure tool to quickly check the cloud disk status. If an issue is found, follow the provided suggestions to resolve the issue and restore your service.
Diagnostic entry: ECS Cloud Disk Resize Failure
Diagnostic product: ECS
Diagnostic target: Stopped Linux ECS instance
Description: If your ECS instance fails to start, you cannot access the operating system, or the instance cannot be stopped or shut down, use the ECS instance startup failure tool to quickly diagnose the startup or shutdown failure. Follow the provided suggestions to resolve the issue and restore your service. This diagnostic tool may attach a temporary repair disk, which can modify your instance's system disk. Before you run the diagnosis, create a snapshot of the system disk to prevent data loss. After the diagnosis, if no further repairs are needed, detach the repair disk by using the "Detach Repair Disk" feature in the report.
Diagnostic entry: ECS instance startup failure
Diagnostic product: ECS
Diagnostic target: Running ECS instance
Description: If you cannot connect to your ECS instance over SSH, use the ECS SSH Connection Failure tool to quickly diagnose the cause. Follow the provided suggestions to resolve the issue and restore your service.
Diagnostic entry: ECS SSH Connection Failure
ECS Workbench public remote connection failure
Diagnostic product: ECS
Diagnostic target: Running ECS instance
Description: If you cannot connect to your ECS instance through Workbench over the public network, use the ECS Workbench public remote connection failure tool to quickly diagnose the cause. Follow the provided suggestions to resolve the issue and restore your service.
Diagnostic entry: ECS Workbench public remote connection failure
ECS Workbench internal remote connection failure
Diagnostic product: ECS
Diagnostic target: Running ECS instance
Description: If you cannot connect to your ECS instance through Workbench over the internal network, use the ECS Workbench internal remote connection failure tool to quickly diagnose the cause. Follow the provided suggestions to resolve the issue and restore your service.
Diagnostic entry: ECS Workbench internal remote connection failure
Diagnostic product: ECS
Diagnostic target: Running ECS instance
Description: If you cannot ping your ECS instance, use the ECS Ping Failure tool to quickly diagnose the cause. Follow the provided suggestions to resolve the issue and restore your service.
Diagnostic entry: ECS Ping Failure
Simple Application Server Remote Connection Failure
Diagnostic product: Simple Application Server
Diagnostic target: Running Simple Application Server instance
Description: If you cannot remotely connect to a Simple Application Server instance, use the Simple Application Server Remote Connection Failure tool to quickly diagnose the possible causes. The diagnosis covers instance configuration management, network services, operating system settings, compute services, and storage services. Follow the provided suggestions to resolve the issue and restore your service.
Diagnostic entry: Simple Application Server Remote Connection Failure
Linux OS comprehensive diagnosis
Diagnostic product: ECS
Diagnostic target: Running ECS instance
Description: This tool performs comprehensive OS health checks and kernel-level diagnostics. It analyzes the correlation between application behavior and cloud system events to help you identify problematic processes and find solutions.
Diagnostic entry: Linux OS comprehensive diagnosis
Container
Diagnostic Product: Container Service for Kubernetes
Diagnostic Object: ACK pod
Description: If you suspect a pod in Container Service for Kubernetes (ACK) is failing to start or restarting frequently, use the ACK Pod Anomaly diagnostic tool to troubleshoot pod anomalies. Use its recommendations to resolve issues, restore services, and improve operational efficiency.
Diagnostic Entry: ACK Pod Anomaly
Diagnostic Product: Container Service for Kubernetes
Diagnostic Object: ACK node
Description: If you suspect issues with a node in Container Service for Kubernetes (ACK), use the ACK Node Anomaly diagnostic tool to troubleshoot node anomalies. Use its recommendations to resolve issues, restore services, and improve operational efficiency.
Diagnostic Entry: ACK Node Anomaly
Diagnostic Product: Container Service for Kubernetes
Diagnostic Object: ACK ingress
Description: If you suspect issues with an ingress in Container Service for Kubernetes (ACK), use the ACK Ingress Anomaly diagnostic tool to troubleshoot issues with ingress resources, configuration, and connectivity. Use its recommendations to resolve issues, restore services, and improve operational efficiency.
Diagnostic Entry: ACK Ingress Anomaly
Diagnostic Product: Container Service for Kubernetes
Diagnostic Object: ACK service
Description: If you suspect issues with a service in Container Service for Kubernetes (ACK), use the ACK Service Anomaly diagnostic tool to troubleshoot issues with service configuration, quotas, and abnormal events. Use its recommendations to resolve issues, restore services, and improve operational efficiency.
Diagnostic Entry: ACK Service Anomaly
Diagnostic Product: Container Service for Kubernetes
Diagnostic Object: ACK cluster
Description: If you suspect issues with Container Service for Kubernetes (ACK), use the ACK Comprehensive Diagnosis diagnostic tool to troubleshoot issues with cluster security, performance, stability, cost, and service limits. Use its recommendations to resolve issues, restore services, and improve operational efficiency.
Diagnostic Entry: ACK Comprehensive Diagnosis
Storage
Product: block storage
Target: cloud disk instance
Description: If you suspect a cloud disk has issues, such as slow I/O or poor performance, use the Cloud Disk Diagnosis tool to quickly troubleshoot the problem. Use the provided suggestions to resolve the issue, promptly restore your services, and improve operational efficiency.
Entry point: Cloud Disk Diagnosis
Network and CDN
Diagnostic Product: Load Balancer
Diagnostic Target: CLB instance
Description: If you suspect a Classic Load Balancer (CLB) instance has issues such as packet loss, connectivity problems, an abnormal health status, overdue payments, or security policy problems, use the Classic Load Balancer to investigate its health, configuration, security, capacity, and costs. If any problems are identified, use the provided remediation suggestions to resolve them, restore services, and improve O&M efficiency.
Diagnostic Entry: Classic Load Balancer
Diagnostic Product: Load Balancer
Diagnostic Target: ALB instance
Description: If you suspect an Application Load Balancer (ALB) instance has issues such as packet loss, connectivity problems, an abnormal health status, overdue payments, or security policy problems, use the Application Load Balancer to investigate its health, configuration, security, capacity, and costs. If any problems are identified, use the provided remediation suggestions to resolve them, restore services, and improve O&M efficiency.
Diagnostic Entry: Application Load Balancer
Diagnostic Product: Load Balancer
Diagnostic Target: NLB instance
Description: If you suspect a Network Load Balancer (NLB) instance has issues such as packet loss, connectivity problems, an abnormal health status, overdue payments, or security policy problems, use the Network Load Balancer to investigate its health, configuration, security, capacity, and costs. If any problems are identified, use the provided remediation suggestions to resolve them, restore services, and improve O&M efficiency.
Diagnostic Entry: Network Load Balancer
Diagnostic Product: NAT Gateway
Diagnostic Target: NAT Gateway instance
Description: If you suspect a NAT Gateway instance has issues such as packet loss, slow speeds, connectivity problems, insufficient quota, overdue payments, or security policy problems, use the NAT Gateway to investigate its health, configuration, security, capacity, and costs. If any problems are identified, use the provided remediation suggestions to resolve them, restore services, and improve O&M efficiency.
Diagnostic Entry: NAT Gateway
Diagnostic Product: Elastic IP Address (EIP)
Diagnostic Target: EIP instance
Description: If you suspect an Elastic IP Address (EIP) instance has issues such as packet loss, connectivity problems, insufficient bandwidth, overdue payments, or security policy problems, use the Elastic IP Address to investigate its health, configuration, security, capacity, and costs. If any problems are identified, use the provided remediation suggestions to resolve them, restore services, and improve O&M efficiency.
Diagnostic Entry: Elastic IP Address
Diagnostic Product: Global Accelerator (GA)
Diagnostic Target: GA instance
Description: If you suspect a Global Accelerator (GA) instance has issues such as packet loss, connectivity problems, insufficient bandwidth, overdue payments, or security policy problems, use the Global Accelerator to investigate its health, configuration, security, capacity, and costs. If any problems are identified, use the provided remediation suggestions to resolve them, restore services, and improve O&M efficiency.
Diagnostic Entry: Global Accelerator
Diagnostic Product: VPN Gateway
Diagnostic Target: VPN Gateway instance
Description: If you suspect a VPN Gateway instance has issues such as packet loss, slow speeds, connectivity problems, insufficient bandwidth, overdue payments, or security policy problems, use the VPN Gateway to investigate its health, configuration, security, capacity, and costs. If any problems are identified, use the provided remediation suggestions to resolve them, restore services, and improve O&M efficiency.
Diagnostic Entry: VPN Gateway
Diagnostic Product: Express Connect
Diagnostic Target: Virtual Border Router (VBR) instance
Description: If you suspect a Virtual Border Router (VBR) instance has issues such as packet loss, connectivity failures, an abnormal health status, overdue payments, or security policy problems, use the Virtual Border Router to investigate its health, configuration, security, capacity, and costs. If any problems are identified, use the provided remediation suggestions to resolve them, restore services, and improve O&M efficiency.
Diagnostic Entry: Virtual Border Router
Diagnostic Product: Transit Router (TR)
Diagnostic Target: TR instance
Description: If you suspect a Transit Router (TR) instance has issues such as packet loss, connectivity failures, slow speeds, overdue payments, or security policy problems, use the Transit Router to investigate its health, configuration, security, capacity, and costs. If any problems are identified, use the provided remediation suggestions to resolve them, restore services, and improve O&M efficiency.
Diagnostic Entry: Transit Router
Diagnostic Product: PrivateLink
Diagnostic Target: PrivateLink endpoint instance
Description: If you suspect a PrivateLink endpoint instance has issues such as packet loss, connectivity failures, slow speeds, or overdue payments, use the PrivateLink Endpoint to investigate its health, configuration, security, capacity, and costs. If any problems are identified, use the provided remediation suggestions to resolve them, restore services, and improve O&M efficiency.
Diagnostic Entry: PrivateLink Endpoint
Diagnostic Product: PrivateLink
Diagnostic Target: PrivateLink endpoint service instance
Description: If you suspect a PrivateLink endpoint service instance has issues such as configuration problems or overdue payments, use the PrivateLink Endpoint Service to investigate its health, configuration, and costs. If any problems are identified, use the provided remediation suggestions to resolve them, restore services, and improve O&M efficiency.
Diagnostic Entry: PrivateLink Endpoint Service
MaxCompute
Product: MaxCompute, a cloud-native big data computing service
Target: MaxCompute SQL/SQLRT jobs
Description: If you suspect performance issues in a MaxCompute job, use the MaxCompute job diagnosis tool to quickly troubleshoot common problems such as data skew, resource contention, and data inflation. It also detects anomalies such as insufficient permissions and runtime errors. Follow the provided troubleshooting suggestions to resolve these issues, restore services, and improve O&M efficiency.
Access: MaxCompute job diagnosis
Database
Diagnostic product: ApsaraDB for RDS
Diagnostic target: RDS instance
Description: If you cannot connect to an RDS instance, use the RDS whitelist check tool to quickly check multiple private or public IPs against the RDS instance whitelist. You can also add IPs to the whitelist with a single click. For more solutions to RDS connection issues, see Troubleshoot instance connection issues.
Diagnostic entry: RDS whitelist check
Diagnostic product: ApsaraDB for RDS
Diagnostic target: RDS for MySQL instance
Description: If you notice or suspect issues such as high space utilization, CPU utilization, memory utilization, or IOPS utilization on an RDS for MySQL instance, use the RDS resource anomaly tool to quickly diagnose the instance. If the tool finds an anomaly, follow its recommendations to resolve the issue, restore services, and improve operational efficiency.
Diagnostic entry: RDS resource anomaly
Diagnostic product: ApsaraDB for PolarDB
Diagnostic target: PolarDB for MySQL instance
Description: If you notice or suspect issues such as high space utilization, CPU utilization, memory utilization, or IOPS utilization on a PolarDB for MySQL instance, use the PolarDB resource anomaly tool to quickly diagnose the instance. If the tool finds an anomaly, follow its recommendations to resolve the issue, restore services, and improve operational efficiency.
Diagnostic entry: PolarDB resource anomaly
Other
Products: Multiple products
Diagnostic object: Website domain name
Description: If a website hosted on Alibaba Cloud is unavailable or has access issues, use the Website Unavailable diagnostic tool to quickly troubleshoot causes such as connectivity failures, access anomalies, or services being blocked. By entering the website's domain name, the tool automatically analyzes its dependent cloud resources (limited to resources under your account), such as Server Load Balancer (SLB), Elastic IP Address (EIP), and ECS, to identify the root cause. If the tool detects an issue, follow the provided recommendations to resolve the problem and quickly restore your service.
Diagnosis entry: Website Unavailable
Products: Multiple products
Diagnostic objects: ECS, public IP address, vSwitch, load balancing, and more
Description: If you suspect connectivity issues between network nodes such as ECS instances, public IP addresses, vSwitches, or load balancing resources, use the Network Path Connectivity tool to quickly diagnose the network path between a source and a destination. Select a source and destination, and the tool automatically analyzes the end-to-end network path and displays information for each node along the way. If the tool finds an issue, follow the recommendations to resolve it and restore your service. For example, if a route configuration is missing a next hop, you may need to add it; if the instance cannot connect to the internet, you may need to associate an Elastic IP Address; or if traffic is being dropped by a security group rule, you may need to adjust the rule. If no issues are found, you can also initiate a reverse path diagnosis with a single click to verify round-trip connectivity.
Diagnosis entry: Network Path Connectivity
Products: Multiple products
Diagnostic object: RAM error message
Description: If an API call returns a Resource Access Management (RAM) permission error, use the RAM permission error tool to find the cause by entering the request ID. The tool provides authorization recommendations based on system policies or custom policies to help you grant the necessary permissions and quickly restore your service.
Diagnosis entry: RAM permission error
Products: Multiple products
Diagnostic object: Error message or request ID
Description: If you receive an error when calling an Alibaba Cloud API or using an SDK, use the API/SDK error tool to find the cause by entering the error message or request ID. You can then use the provided error details and recommended actions to resolve the issue and restore your service.
Diagnosis entry: API/SDK error
One-click diagnosis
The One-click Diagnosis feature is now available for early access. It performs a comprehensive diagnosis of your cloud resources and helps you resolve issues in a single operation, eliminating manual troubleshooting. Join our DingTalk group (ID: 86570007290) to receive an invitation link.
One-click diagnosis
With a scenario-specific diagnosis, you first assess the problem and then use specific tools to resolve issues individually. In contrast, one-click diagnosis scans all your cloud resources in a single run. It checks each resource for issues, prioritizes them by severity, and provides recommendations so you can address them all from one place. One-click diagnosis is like a full-body health check that can identify both obvious and hidden problems, while a scenario-specific diagnosis is like a specialist consultation offering a more in-depth analysis. After a one-click diagnosis, you can run a scenario-specific diagnosis on any issue found. This "health check + specialist" workflow makes troubleshooting and problem resolution more efficient.
Diagnosis coverage
Category | Product name | Diagnostic object | Limitations |
Compute (2) | ECS | instance | Only running instances are supported. |
Simple Application Server | instance | Only running instances are supported. | |
Container (1) | Container Service for Kubernetes (ACK) | cluster | Only running clusters are supported. |
Network and CDN (8) | Server Load Balancer | CLB/ALB/NLB instances | |
NAT Gateway | instance | ||
Elastic IP Address | instance | ||
Global Accelerator | instance | ||
VPN Gateway | instance | ||
Express Connect | Virtual Border Router instance | ||
Cloud Enterprise Network | instance | ||
PrivateLink | PrivateLink endpoint instances and endpoint service instances | ||
Database (2) | ApsaraDB for RDS | instance | Only running MySQL instances are supported. |
ApsaraDB for PolarDB | cluster | Only running MySQL-compatible clusters are supported. |
One-click diagnosis
This feature is currently available to beta users only. To get an invitation link, join our DingTalk discussion group (ID: 86570007290).
One-click diagnosis
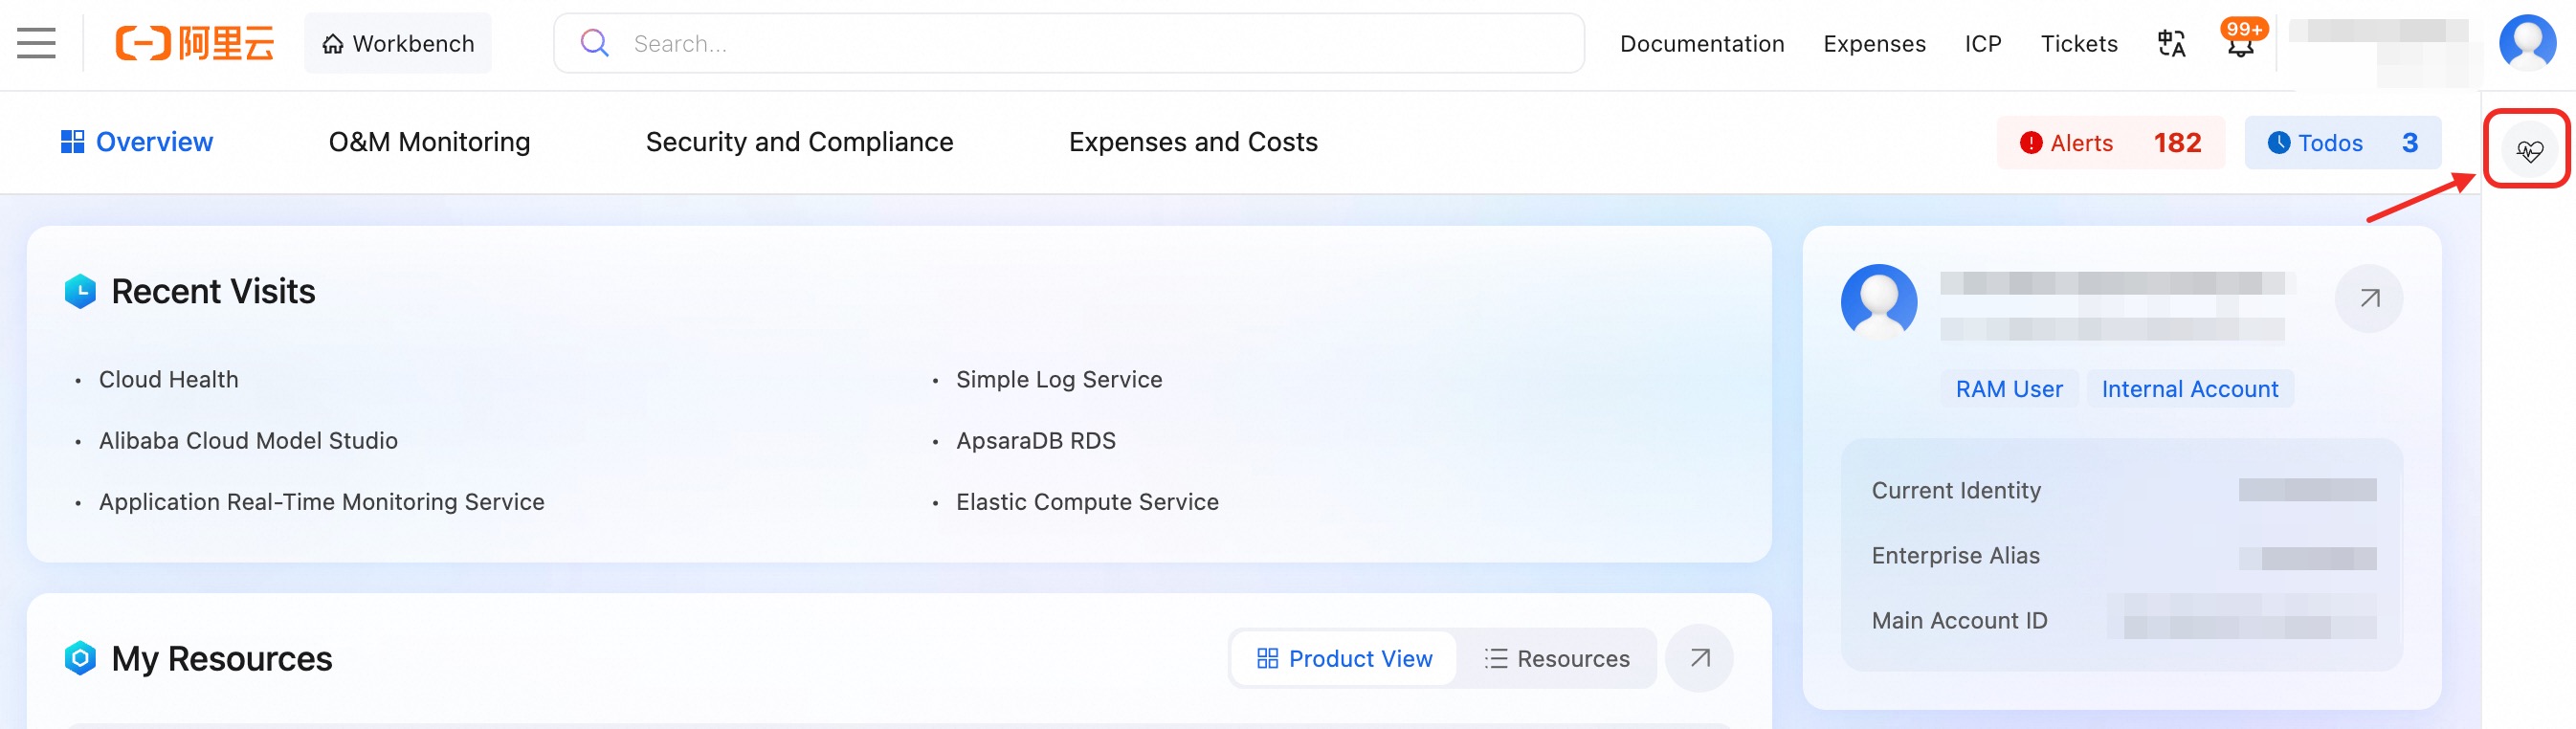
Entry 1: Log on to the console. You can start a diagnosis from the sidebar on the console home (if the sidebar is collapsed, click  in the lower-right corner to expand it).
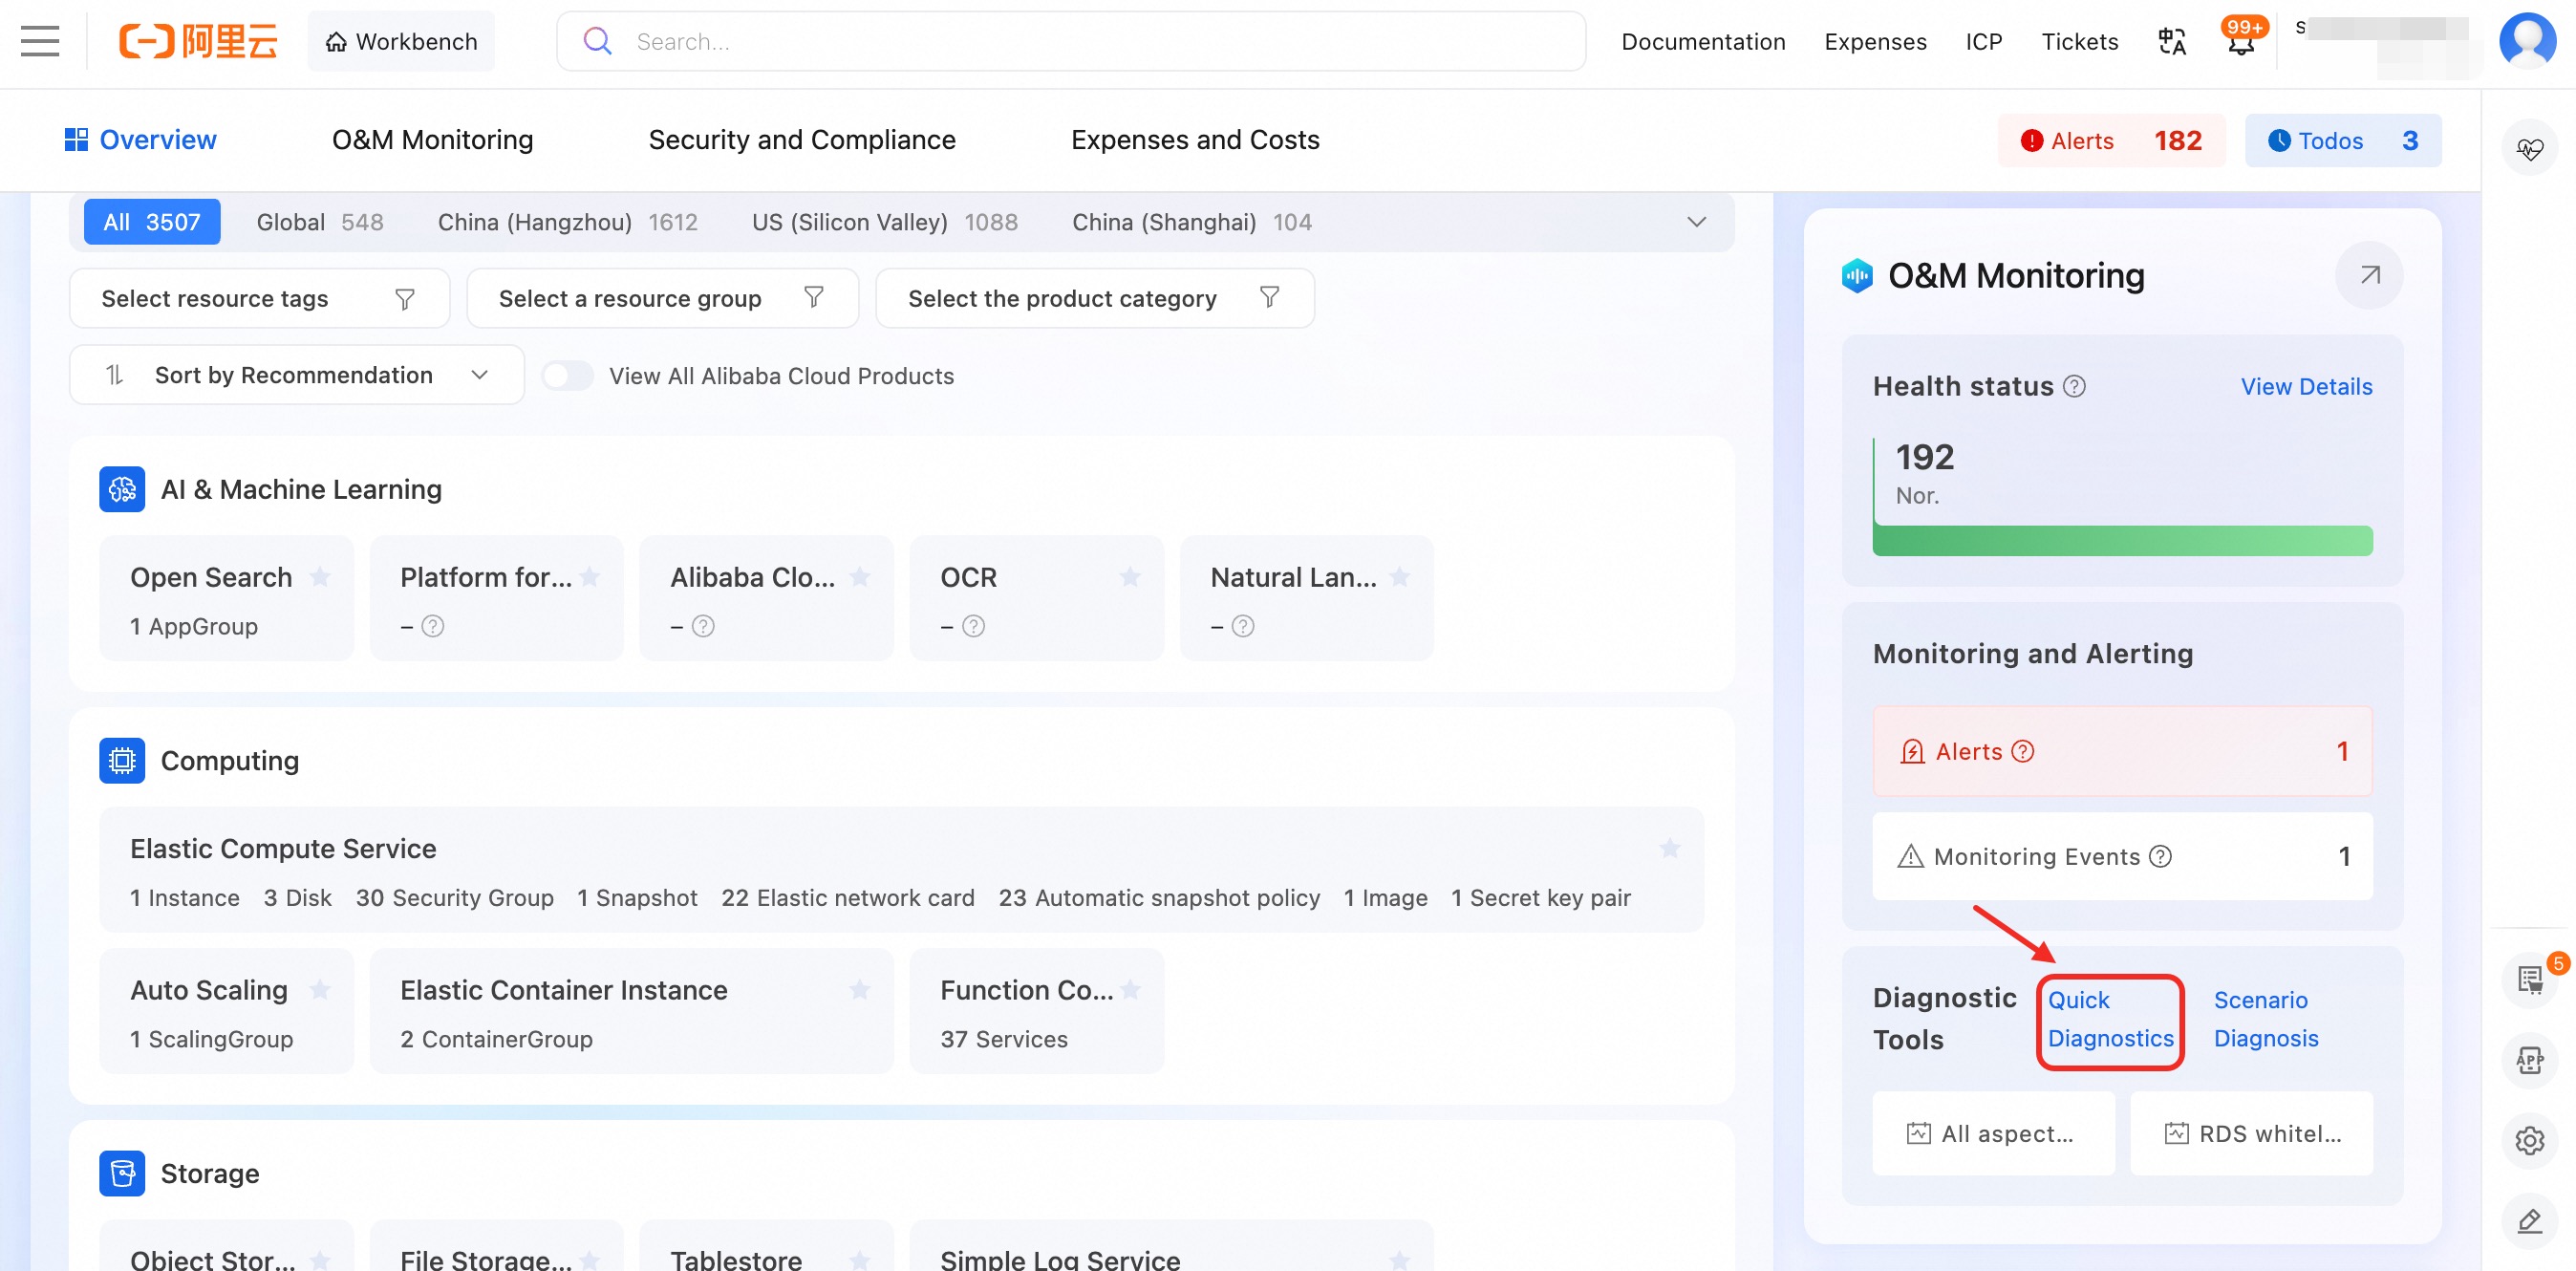
Entry 2: Log on to the console. You can start a diagnosis from the operations and monitoring card on the console home.
Entry 3: Log on to the console. You can start a diagnosis by navigating to console home - operations and monitoring and clicking Create Diagnosis.

The system displays the products and resources in your account that you can diagnose with a single click. By default, the resources on the first page for each product are selected. You can select which instances to diagnose. A single diagnostic task can include up to 50 resources per product. To diagnose more resources, start a new diagnostic task after the current one is complete.
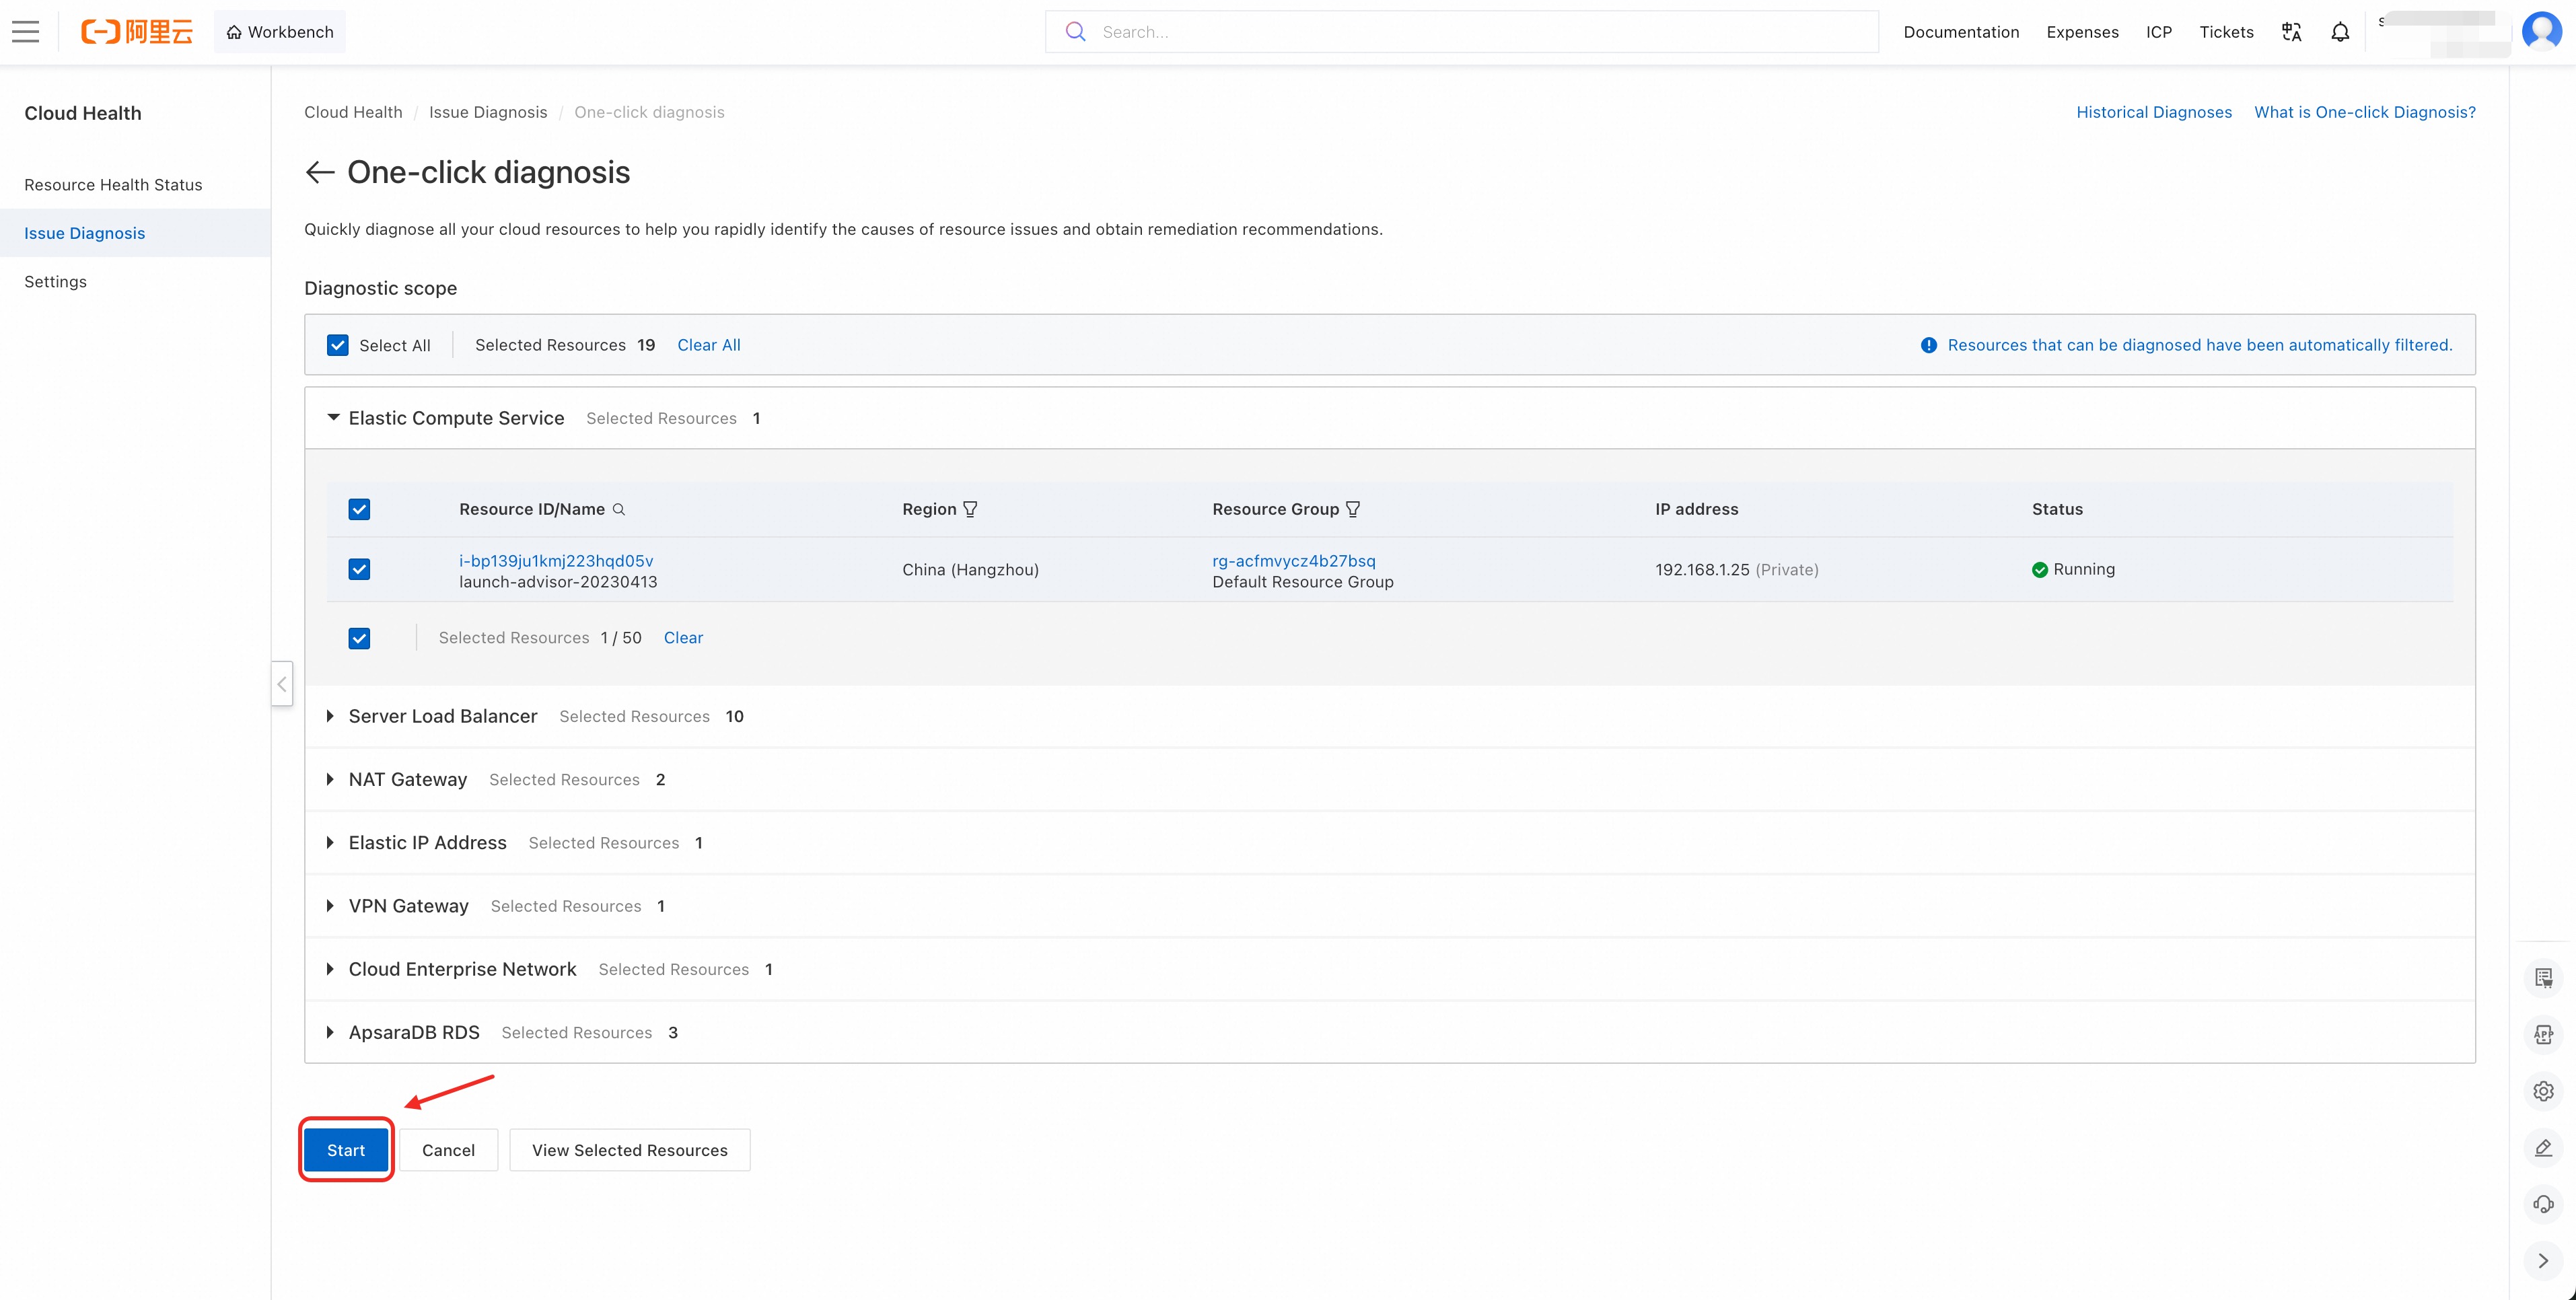
Click Start Diagnosis to run a one-click diagnosis. You can monitor the progress of the overall diagnosis and for each individual resource. The entire process typically takes a few minutes.
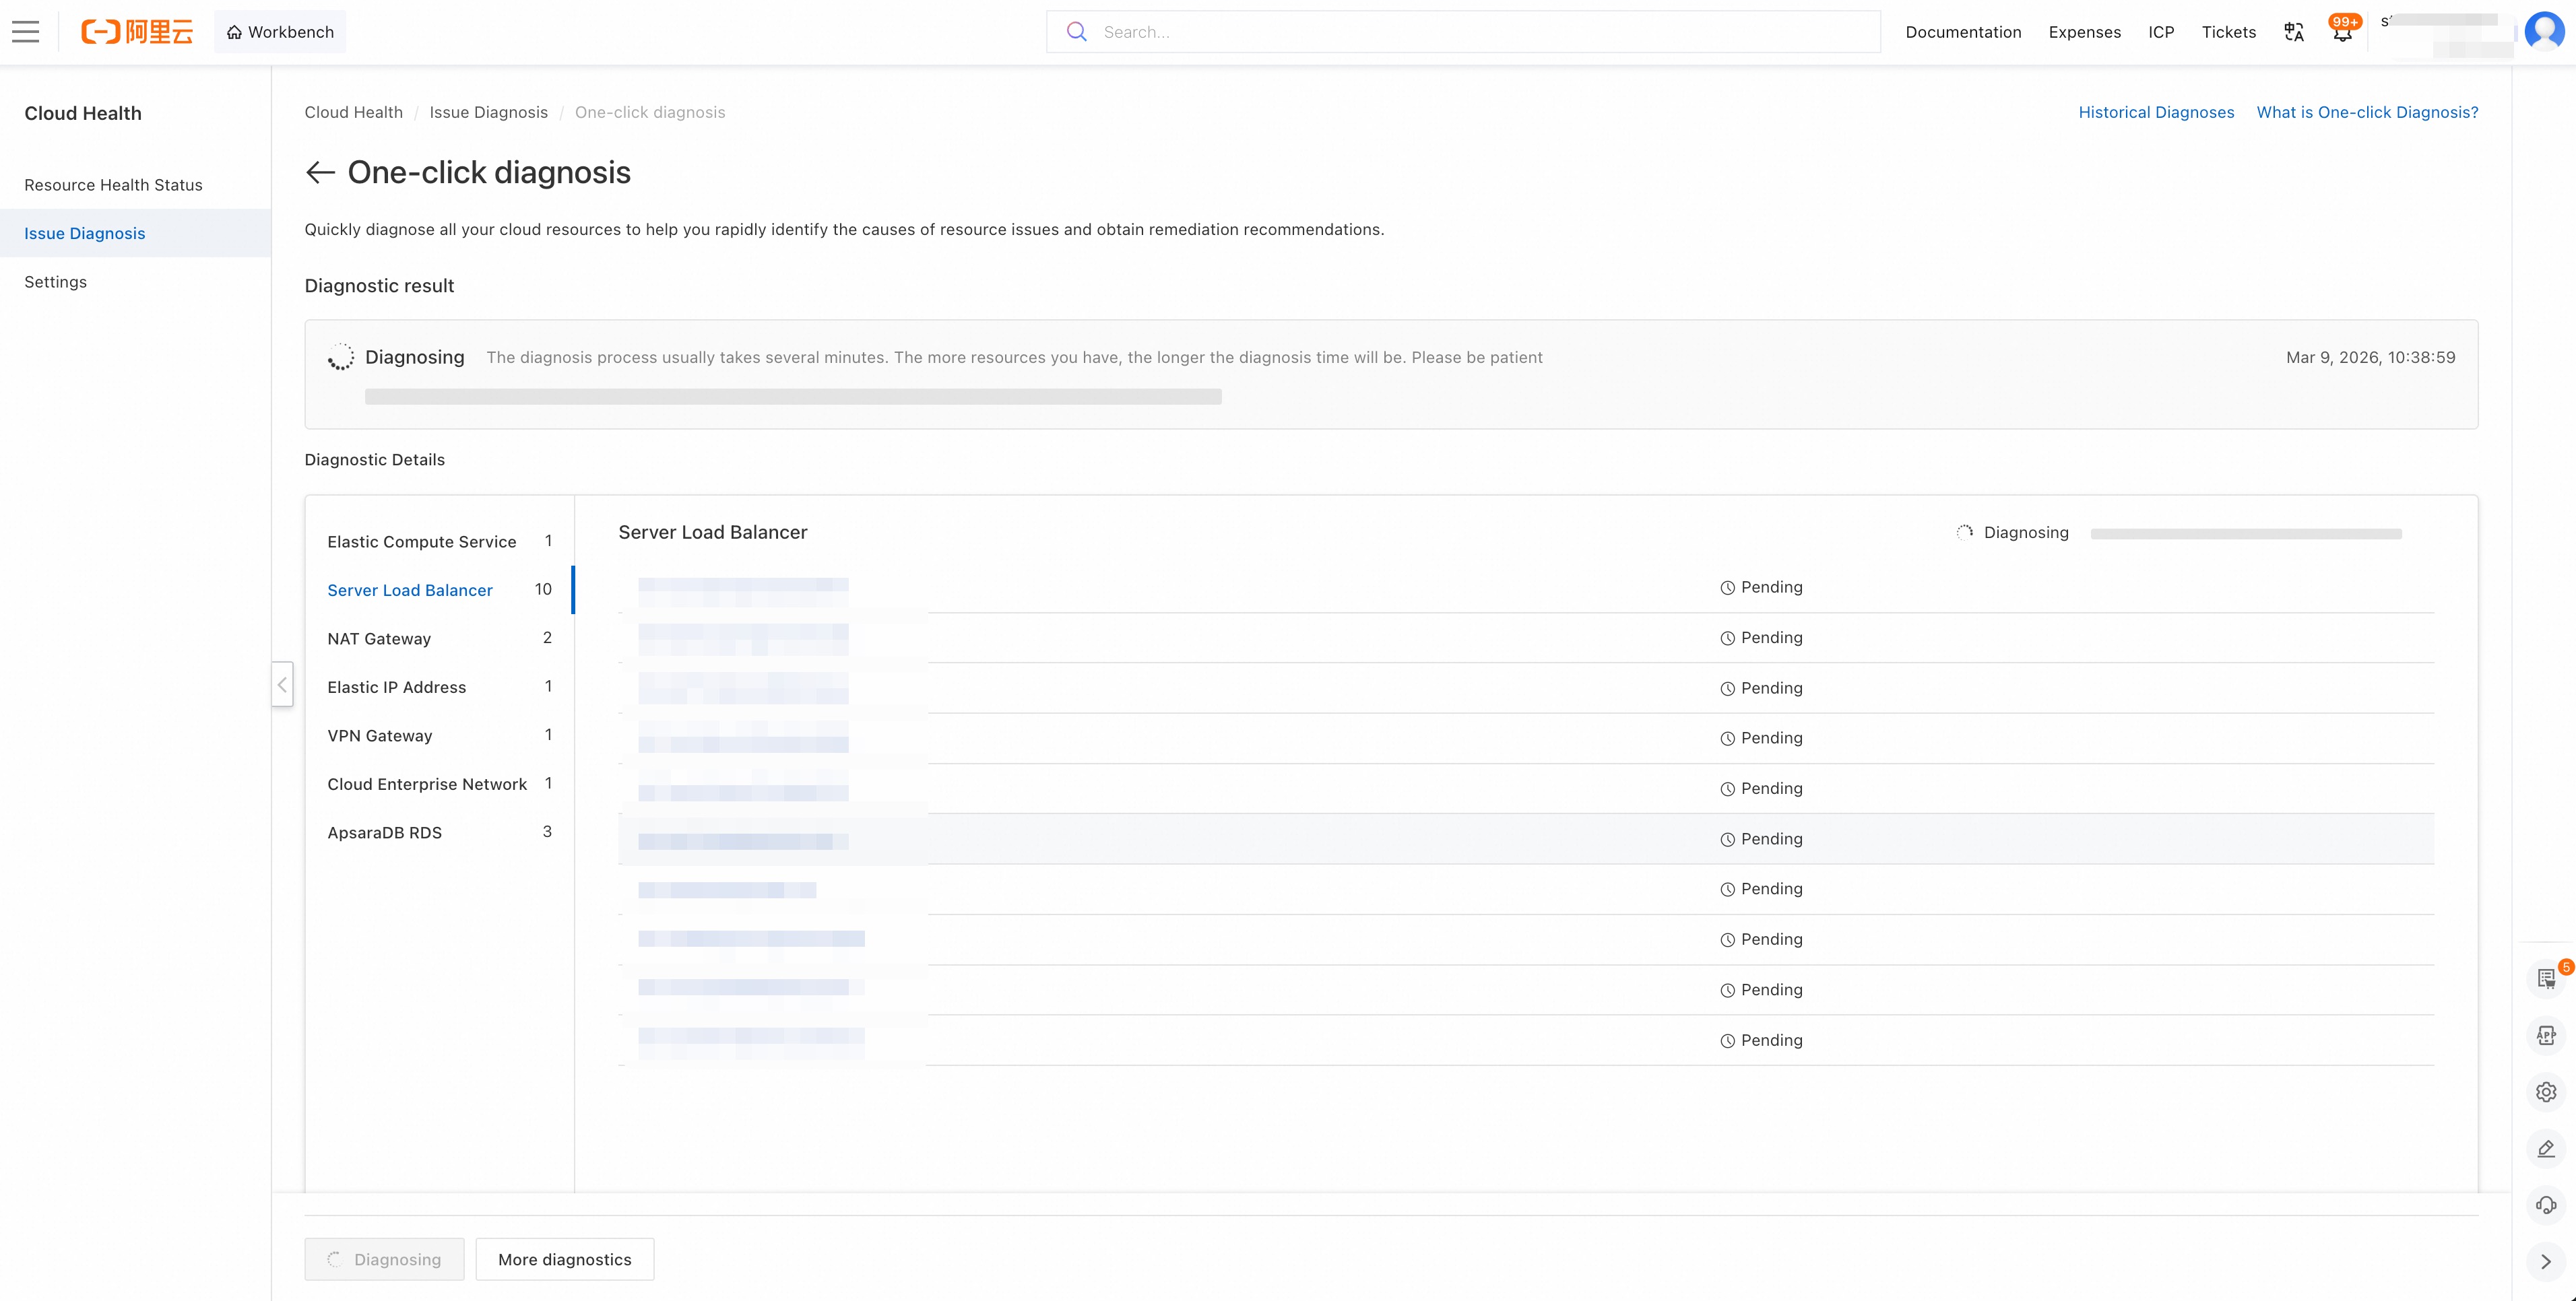
View the diagnostic results once the diagnostics are complete.
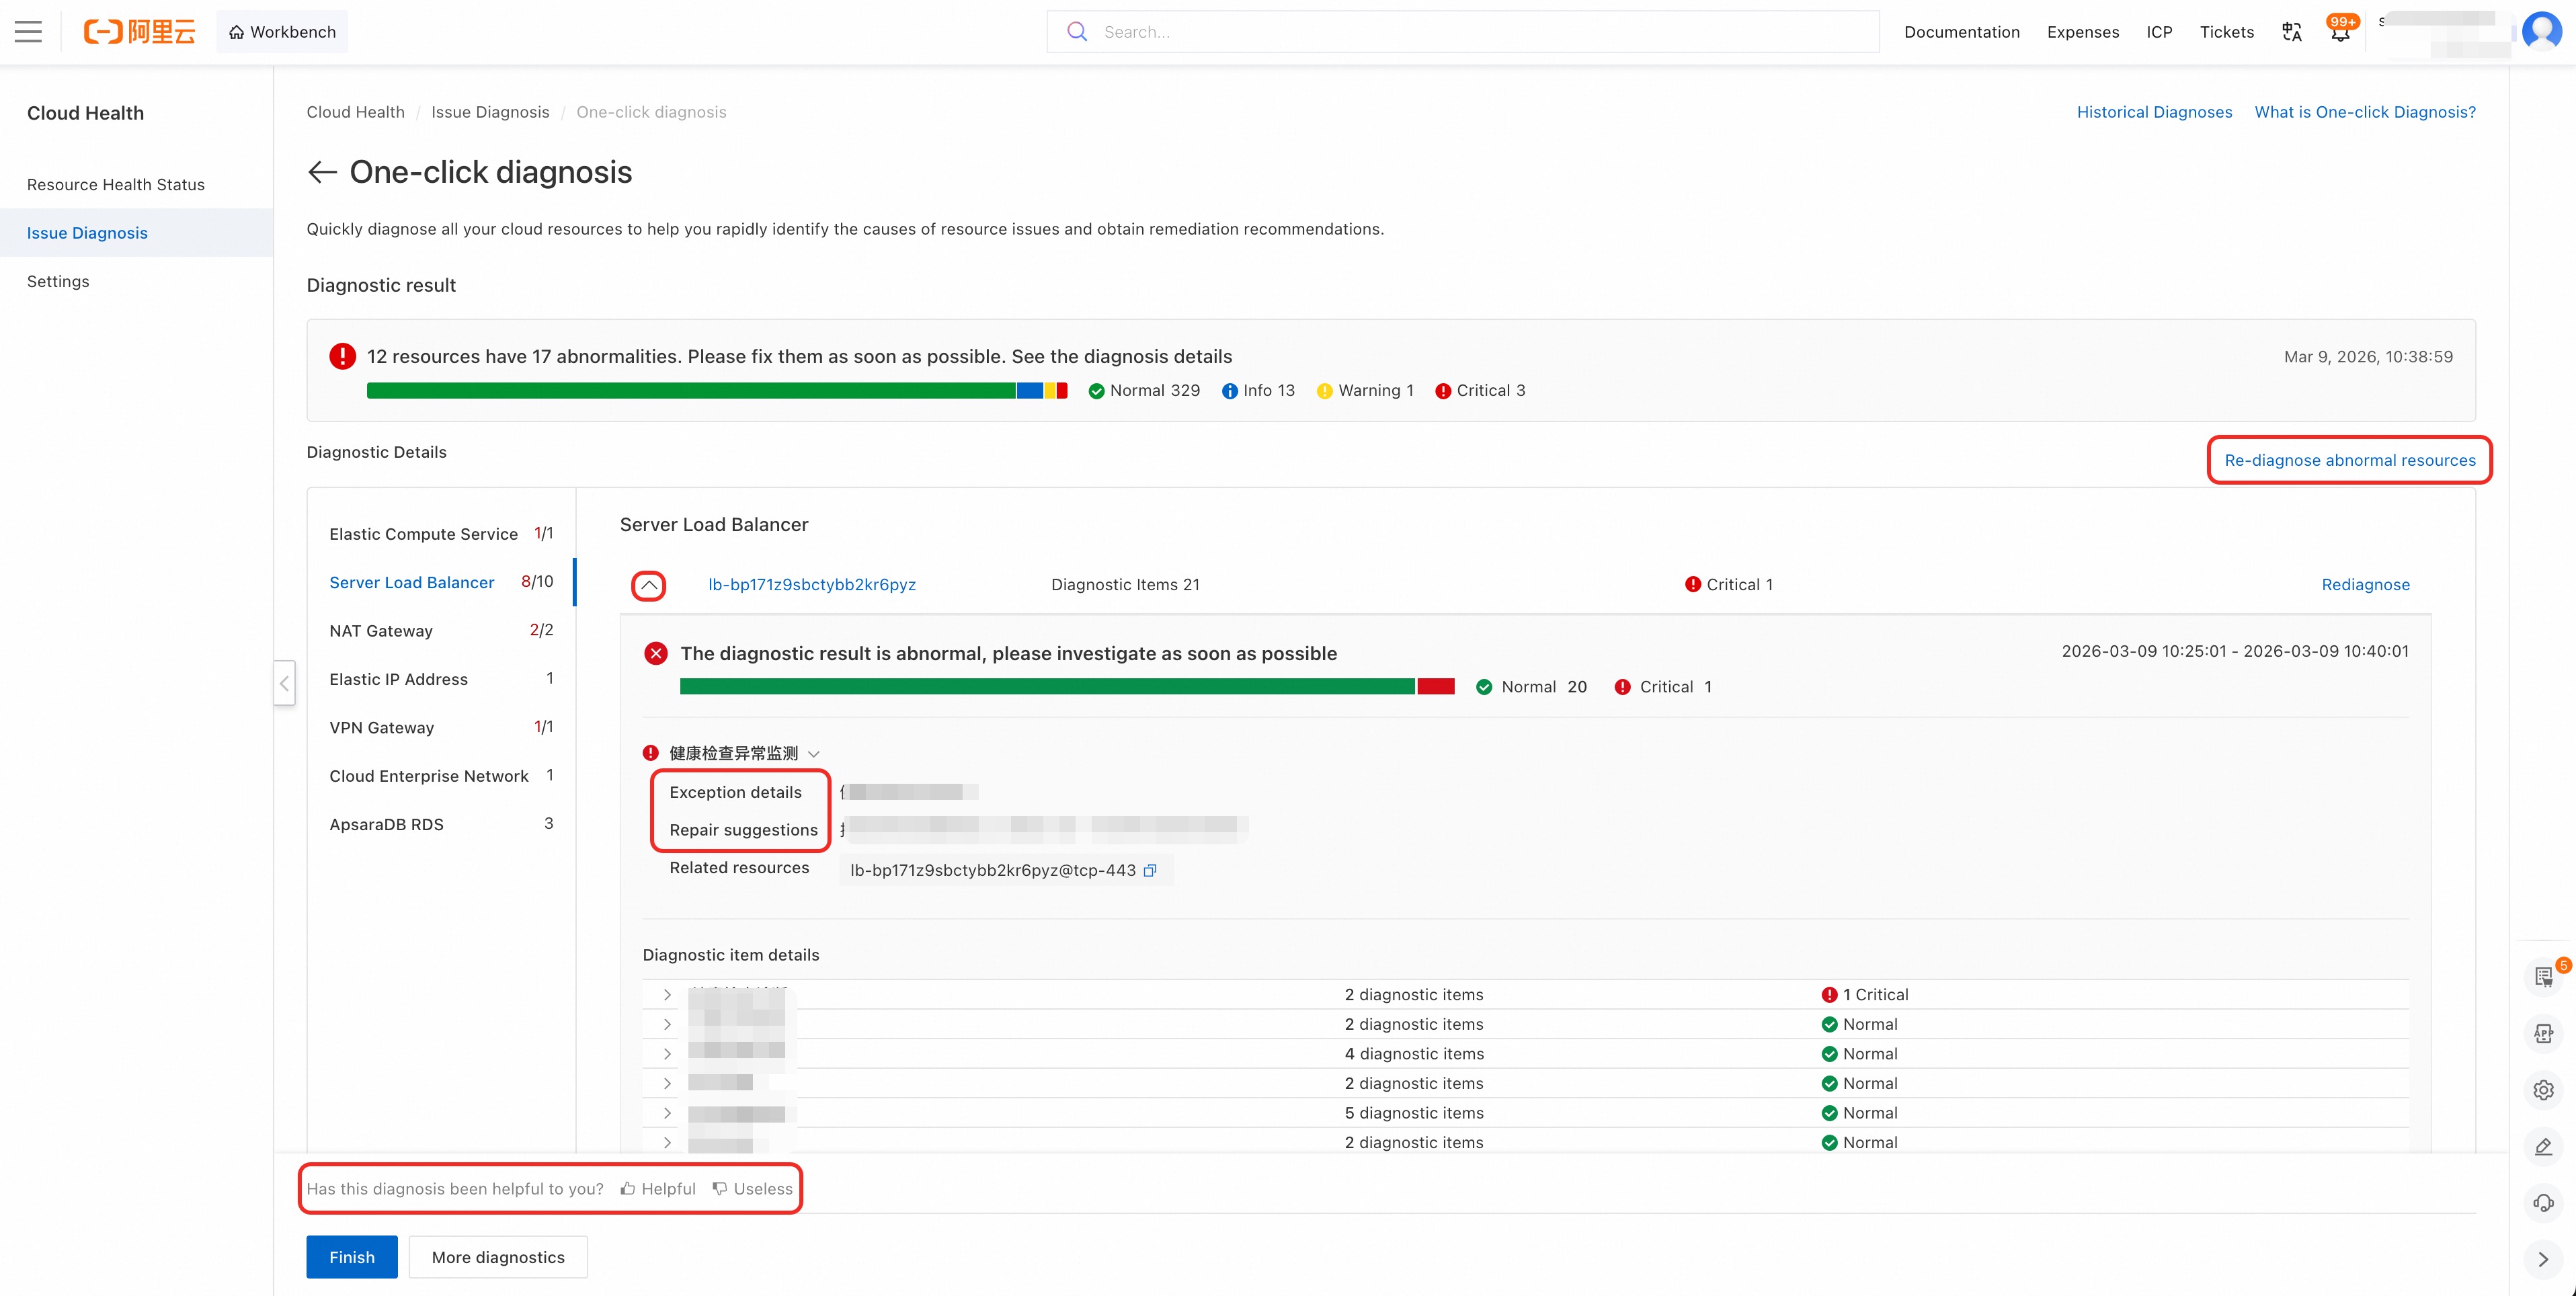
If the diagnosis finds an issue, the affected resources are listed at the top. Click the arrow to view the issue details and suggested fixes. Follow the suggested fixes to resolve the issue. If the issue persists, submit a ticket.
Click "Helpful" or "Not Helpful" to provide feedback on the diagnostic results. We review all feedback to continuously improve this feature.
Diagnostic result labels:
Normal: Indicates no significant issues. You can rule out this item during troubleshooting.
Information: Indicates a deviation from best practice. This does not currently affect your service, and addressing it is optional.
Warning: Indicates a significant issue that may affect your service. You should resolve it as soon as possible.
Critical: Indicates a major issue that will likely impact your service. This requires immediate action.
Failed: Indicates the diagnosis failed due to an unexpected error. You can re-diagnose.