Job instance details
This topic describes how to view job instance details.
View job instance details
MaxCompute Studio provides two ways to view job instance details.
-
Open job details in read-only mode by using a Logview URL or a local offline Logview file.
Logview is a common way to view job details, including the status of jobs in other projects. To do so, enter a valid Logview URL or import a local offline Logview file:
In the IntelliJ IDEA menu bar, choose . In the Open job detail by logview dialog box, paste a valid Logview URL or import a local offline Logview file.
-
Double-click a job in the job list to view the details of the instance.
Job details view
The job details page consists of a toolbar at the top, a basic properties pane on the left, and a details pane on the right. The details pane contains the following views:
-
Execution view: Displays the overall job information as a DAG. You can view dependencies between subtasks and the detailed execution plan for each subtask.
-
Analyze: Displays job run details by using the Timeline view, scatter plots, data skew charts, and long-tail charts.
-
History: Shows the duration of each stage of the job run.
-
Script: Displays the SQL statement submitted for the job and the parameter settings used at submission.
-
Details: Displays detailed job information in a table view, including the subtask list, the worker list for each subtask, worker throughput, execution time, and status.
-
Summary: Displays detailed job run information in JSON format.
-
Result: Displays the job output.
-
Plan: Displays job execution plan information.
Toolbar
-
 ,
,  : Collapse or expand the left and right panes, or maximize a view.
 -
 : Stop the job. You must have the required permissions (project owner or administrator).
 -
 : Manually refresh the detail views on the right. Basic information for running jobs, such as status and quota information, is automatically refreshed.
 -
 : Copy the Logview URL.
 -
: Generate a Logview URL and open it.
-
: Save the job details to a local file.
-
: Toggle auto-refresh. If enabled, MaxCompute Studio periodically refreshes all job details.
 : Copy the Logview URL.
 : Generate a Logview URL and open it.
 : Save the job details to a local file.
 : Toggle auto-refresh. If enabled, MaxCompute Studio periodically refreshes all job details.
Basic information page
The basic information page displays the job ID, creator, status, start and end times, compute resource usage, and input and output tables. For running jobs, this information is automatically refreshed.
Double-click a table name to open the basic information page for that table.
Execution view
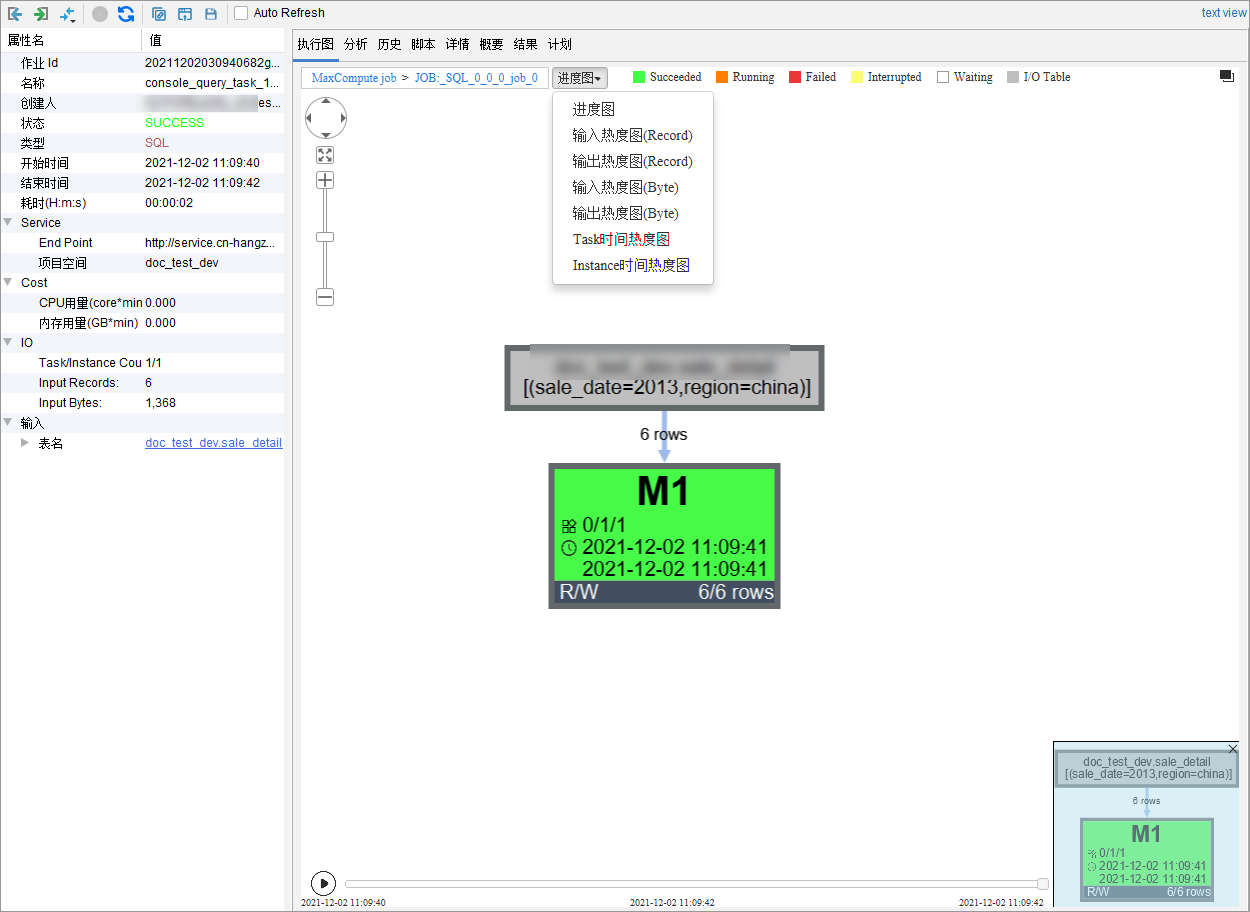
The Execution view is a primary tool for daily use. It visualizes the dependencies among Fuxi Jobs, Fuxi Tasks, and Operations, and provides auxiliary tools such as Job playback, progress charts, and heat maps to help you troubleshoot issues.
The following table describes the numbered elements in the preceding figure.
|
Number |
Description |
|
① |
Click to switch between layers. |
|
② |
Zoom controls. |
|
③ |
Dependency table. |
|
④ |
Fuxi Task node. |
|
⑤ |
Overview. |
|
⑥ |
Display settings. |
|
⑦ |
The Fuxi Task layer is displayed by default. |
The Execution view shows dependencies at the Fuxi Job, Fuxi Task, and Operation layers. By default, the Fuxi Task layer is displayed. You can click the up arrow to switch layers.
-
Fuxi Job layer
Click MaxCompute job to open the Fuxi Job layer. Each node displays the Fuxi Task name, start time, and end time.
-
Fuxi Task layer
Double-click any Fuxi Job node to enter the Fuxi Task layer.
If there are multiple Fuxi Jobs, the Fuxi Task layer for the last Fuxi Job opens by default. This layer displays Fuxi Task dependencies, input and output tables, and partitions. After the job is complete, click Progress Chart in the toolbar to select a heat map, such as Input Heat Chart (Record), Output Heat Chart (Record), Input Heat Chart (Byte), Output Heat Chart (Byte), TaskTime Heat Chart, or InstanceTime Heat Chart. The progress chart shows the completion progress of nodes, and the heat map uses colors to indicate the hotspots of different nodes.
A Fuxi Task node contains the following information:
-
Instance Count: Displayed in
a/b/cformat, where 'a', 'b', and 'c' represent the number of running, completed, and total subtask instances, respectively. -
I/O Records: The number of input and output records at a specific point in time.
-
Percentage and orange progress bar: Indicates the run progress of the task. This percentage is calculated based on an analysis of the running subtask instances.
-
Lines between subtasks: Show the number of output records. The arrows indicate the direction of data flow.
-
-
Operation layer
Double-click any Fuxi Task to open the Operation layer.
The Operation layer reveals the internal workings of a Fuxi Task. Click any node to view its complete information.
For non-SQL jobs, only the Fuxi Job and Fuxi Task layers are available. The Operation layer is not supported.
Details view
This view is mainly for SQL DML jobs. It displays the list of Fuxi Tasks and compute workers on the cluster. A job typically maps to one or more Fuxi Jobs. Each Fuxi Job is split into multiple Fuxi Tasks (stages), and each Fuxi Task contains multiple Fuxi instances (workers). You can right-click a Fuxi instance to view the standard output, standard error, and debug information for the job run.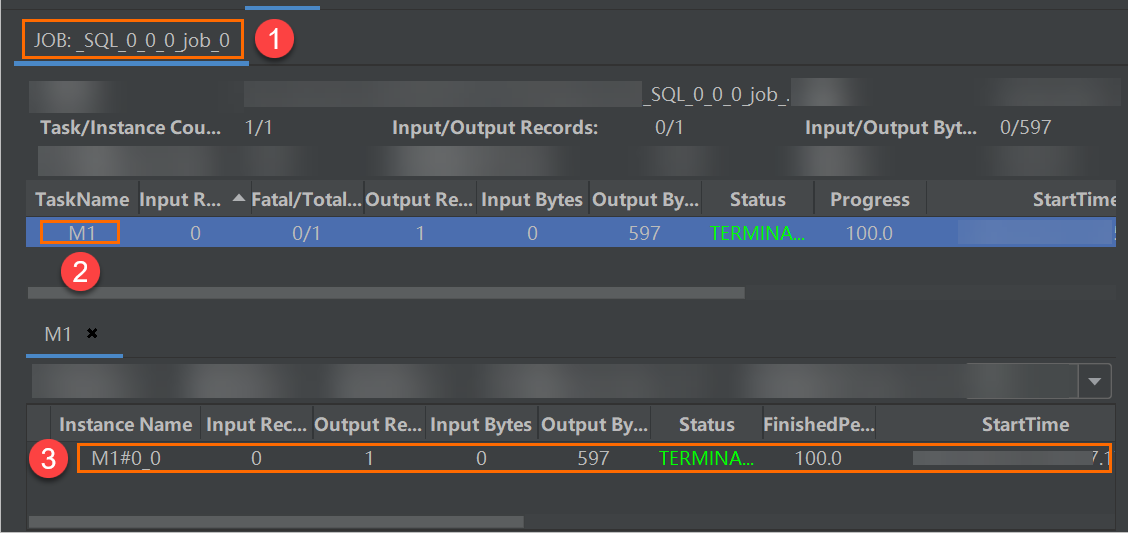
The numbered items in the view are described as follows:
-
Fuxi Job tab.
-
Fuxi Task list.
-
Details and compute worker list for each Fuxi Task.
Job playback
The Job playback feature in MaxCompute Studio lets you review a job's execution history in 12 seconds. It helps you understand the run status of a MaxCompute instance at different times, quickly determine the execution order and duration of subtasks, and identify the critical path of the job. This allows you to optimize slow-running subtasks.
Click the > button to start the playback, and click it again to pause. You can also drag the progress bar manually.
Job playback estimates I/O data volume and completion progress based on elapsed time. This is only an estimate and does not represent the actual I/O data volume. This feature is not available for running jobs.
Timeline view
The Timeline view displays detailed data about the job's distributed execution in a Gantt chart. You can adjust the display granularity to show each compute worker. The Gantt chart helps you quickly spot time bottlenecks and long-tail workers. By using various filters, you can identify the job's critical path, the workers that processed the most data, and the workers with the longest execution time.
Analysis view
The Analysis view displays the long-tail workers and workers with data skew for the job. It uses scatter plots and bar charts to help diagnose performance bottlenecks. From the plots and charts, you can click a node to view the details of the corresponding Fuxi instance.
Result view
The Result view displays different pages based on the job type and the parameter settings at the time of submission.
-
For a SELECT statement with
odps.sql.select.output.format = HumanReadableset, the result is displayed in text format. -
For a SELECT statement where the output format parameter is not set, the result is displayed in a table.
-
For scripts that write output to a table, the view shows the output table name and a link to the table details page.
-
For abnormal jobs, the Result view shows error details.