How to connect to overview data
SchedulerX provides overview metrics for applications that use the Professional Edition. You can retrieve this data through an API and integrate it into your self-managed Grafana instance. This topic describes how to connect to the overview data in Grafana.
Prerequisites
The application has been upgraded to the Professional Edition. For more information, see How to upgrade to the Professional Edition.
Self-managed Grafana integration
Create a data source in your self-managed Grafana.
Install the JSON API data source plugin and create a data source configuration.
Log on to the MSE SchedulerX console.
On the Overview page, click Read Overview Data. Copy the Endpoint URL and paste it into the URL field for the data source.
-
Import a dashboard.
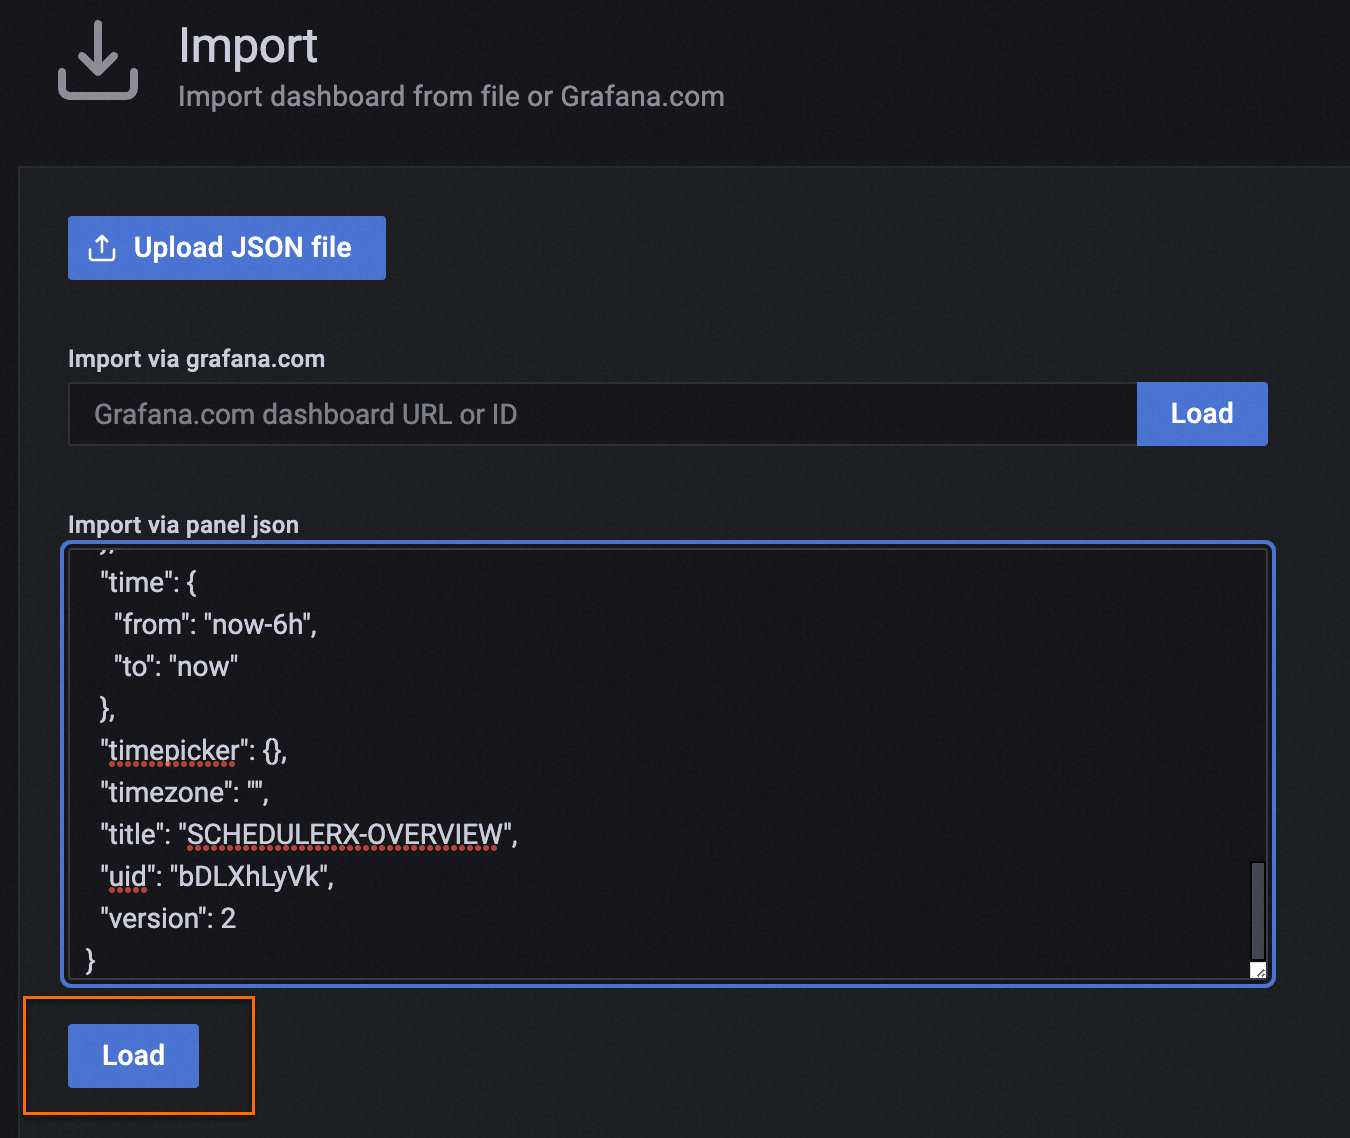
In Grafana, click Import. Copy the following JSON content, paste it into the import field, and then click Load.
{
  "__inputs": [
    {
      "name": "DS_SCHEDULERX-OVERVIEW",
      "label": "SchedulerX-Overview",
      "description": "",
      "type": "datasource",
      "pluginId": "marcusolsson-json-datasource",
      "pluginName": "JSON API"
    }
  ],
  "__requires": [
    {
      "type": "grafana",
      "id": "grafana",
      "name": "Grafana",
      "version": "8.2.3"
    },
    {
      "type": "datasource",
      "id": "marcusolsson-json-datasource",
      "name": "JSON API",
      "version": "1.3.4"
    },
    {
      "type": "panel",
      "id": "stat",
      "name": "Stat",
      "version": ""
    },
    {
      "type": "panel",
      "id": "timeseries",
      "name": "Time series",
      "version": ""
    }
  ],
  "annotations": {
    "list": [
      {
        "builtIn": 1,
        "datasource": "-- Grafana --",
        "enable": true,
        "hide": true,
        "iconColor": "rgba(0, 211, 255, 1)",
        "name": "Annotations & Alerts",
        "target": {
          "limit": 100,
          "matchAny": false,
          "tags": [],
          "type": "dashboard"
        },
        "type": "dashboard"
      }
    ]
  },
  "editable": true,
  "fiscalYearStartMonth": 0,
  "gnetId": null,
  "graphTooltip": 0,
  "id": null,
  "iteration": 1685010894165,
  "links": [],
  "liveNow": false,
  "panels": [
    {
      "datasource": "${DS_SCHEDULERX-OVERVIEW}",
      "fieldConfig": {
        "defaults": {
          "color": {
            "mode": "thresholds"
          },
          "mappings": [],
          "thresholds": {
            "mode": "absolute",
            "steps": [
              {
                "color": "green",
                "value": null
              }
            ]
          }
        },
        "overrides": []
      },
      "gridPos": {
        "h": 8,
        "w": 24,
        "x": 0,
        "y": 0
      },
      "id": 4,
      "options": {
        "colorMode": "value",
        "graphMode": "area",
        "justifyMode": "center",
        "orientation": "auto",
        "reduceOptions": {
          "calcs": [
            "lastNotNull"
          ],
          "fields": "/.*/",
          "values": false
        },
        "text": {},
        "textMode": "auto"
      },
      "pluginVersion": "8.2.3",
      "targets": [
        {
          "cacheDurationSeconds": 60,
          "fields": [
            {
              "jsonPath": "$.data.schedulerx_job_counter_all",
              "name": "Total tasks"
            },
            {
              "jsonPath": "$.data.schedulerx_job_counter_enable",
              "language": "jsonpath",
              "name": "Enabled tasks"
            },
            {
              "jsonPath": "$.data.schedulerx_job_counter_disable",
              "language": "jsonpath",
              "name": "Disabled tasks"
            },
            {
              "jsonPath": "$.data.schedulerx_worker_counter",
              "language": "jsonpath",
              "name": "Online workers"
            },
            {
              "jsonPath": "$.data.schedulerx_job_trigger_counter_running",
              "language": "jsonpath",
              "name": "Running instances"
            }
          ],
          "method": "GET",
          "params": [
            [
              "startTime",
              "${__from:date:seconds}"
            ],
            [
              "endTime",
              "${__to:date:seconds}"
            ],
            [
              "operate",
              "query"
            ],
            [
              "metricType",
              "0"
            ],
            [
              "namespace",
              "${namespace}"
            ],
            [
              "groupId",
              "${groupId}"
            ]
          ],
          "queryParams": "",
          "refId": "A",
          "urlPath": ""
        }
      ],
      "title": "Execution record summary",
      "type": "stat"
    },
    {
      "datasource": "${DS_SCHEDULERX-OVERVIEW}",
      "fieldConfig": {
        "defaults": {
          "color": {
            "mode": "thresholds"
          },
          "mappings": [],
          "thresholds": {
            "mode": "absolute",
            "steps": [
              {
                "color": "green",
                "value": null
              }
            ]
          }
        },
        "overrides": []
      },
      "gridPos": {
        "h": 8,
        "w": 24,
        "x": 0,
        "y": 8
      },
      "id": 7,
      "options": {
        "colorMode": "value",
        "graphMode": "area",
        "justifyMode": "center",
        "orientation": "auto",
        "reduceOptions": {
          "calcs": [
            "lastNotNull"
          ],
          "fields": "/.*/",
          "values": false
        },
        "text": {},
        "textMode": "auto"
      },
      "pluginVersion": "8.2.3",
      "targets": [
        {
          "cacheDurationSeconds": 60,
          "fields": [
            {
              "jsonPath": "$.data.schedulerx_job_trigger_counter_all",
              "name": "Total triggers"
            },
            {
              "jsonPath": "$.data.schedulerx_job_trigger_counter_success",
              "language": "jsonpath",
              "name": "Succeeded"
            },
            {
              "jsonPath": "$.data.schedulerx_job_trigger_counter_failed",
              "language": "jsonpath",
              "name": "Failed"
            }
          ],
          "method": "GET",
          "params": [
            [
              "startTime",
              "${__from:date:seconds}"
            ],
            [
              "endTime",
              "${__to:date:seconds}"
            ],
            [
              "operate",
              "query"
            ],
            [
              "metricType",
              "1"
            ],
            [
              "namespace",
              "${namespace}"
            ],
            [
              "groupId",
              "${groupId}"
            ]
          ],
          "queryParams": "",
          "refId": "A",
          "urlPath": ""
        }
      ],
      "title": "Execution record summary",
      "type": "stat"
    },
    {
      "datasource": "${DS_SCHEDULERX-OVERVIEW}",
      "fieldConfig": {
        "defaults": {
          "color": {
            "mode": "palette-classic"
          },
          "custom": {
            "axisLabel": "",
            "axisPlacement": "auto",
            "barAlignment": 0,
            "drawStyle": "line",
            "fillOpacity": 0,
            "gradientMode": "none",
            "hideFrom": {
              "legend": false,
              "tooltip": false,
              "viz": false
            },
            "lineInterpolation": "linear",
            "lineWidth": 1,
            "pointSize": 5,
            "scaleDistribution": {
              "type": "linear"
            },
            "showPoints": "auto",
            "spanNulls": false,
            "stacking": {
              "group": "A",
              "mode": "none"
            },
            "thresholdsStyle": {
              "mode": "off"
            }
          },
          "mappings": [],
          "thresholds": {
            "mode": "absolute",
            "steps": [
              {
                "color": "green",
                "value": null
              },
              {
                "color": "red",
                "value": 80
              }
            ]
          }
        },
        "overrides": []
      },
      "gridPos": {
        "h": 10,
        "w": 24,
        "x": 0,
        "y": 16
      },
      "id": 6,
      "options": {
        "legend": {
          "calcs": [],
          "displayMode": "list",
          "placement": "bottom"
        },
        "tooltip": {
          "mode": "multi"
        }
      },
      "targets": [
        {
          "cacheDurationSeconds": 60,
          "fields": [
            {
              "jsonPath": "$.data[0].data[*].0",
              "language": "jsonpath",
              "name": "",
              "type": "time"
            },
            {
              "jsonPath": "$.data[0].data[*].1",
              "language": "jsonpath",
              "name": "Triggered"
            },
            {
              "jsonPath": "$.data[1].data[*].1",
              "language": "jsonpath",
              "name": "Failed"
            },
            {
              "jsonPath": "$.data[2].data[*].1",
              "language": "jsonpath",
              "name": "Succeeded"
            }
          ],
          "hide": false,
          "method": "GET",
          "params": [
            [
              "startTime",
              "${__from:date:seconds}"
            ],
            [
              "endTime",
              "${__to:date:seconds}"
            ],
            [
              "operate",
              "query_range"
            ],
            [
              "metricType",
              "1"
            ],
            [
              "namespace",
              "${namespace}"
            ],
            [
              "groupId",
              "${groupId}"
            ]
          ],
          "queryParams": "",
          "refId": "Scheduled triggers",
          "urlPath": ""
        }
      ],
      "title": "Trigger history",
      "type": "timeseries"
    }
  ],
  "refresh": "",
  "schemaVersion": 31,
  "style": "dark",
  "tags": [],
  "templating": {
    "list": [
      {
        "allValue": "_All_",
        "current": {},
        "datasource": "${DS_SCHEDULERX-OVERVIEW}",
        "definition": "$.data[*]",
        "description": "Namespace",
        "error": null,
        "hide": 0,
        "includeAll": true,
        "label": "Namespace",
        "multi": false,
        "name": "namespace",
        "options": [],
        "query": {
          "cacheDurationSeconds": 0,
          "fields": [
            {
              "jsonPath": "$.data[*]"
            }
          ],
          "method": "GET",
          "params": [
            [
              "operate",
              "query_namespace"
            ],
            [
              "startTime",
              "1684132981"
            ],
            [
              "endTime",
              "1684132991"
            ]
          ],
          "queryParams": "",
          "urlPath": ""
        },
        "refresh": 1,
        "regex": "/\"name\":\"(?<text>[^\"]+)|\"uId\":\"(?<value>[^\"]+)/g",
        "skipUrlSync": false,
        "sort": 0,
        "type": "query"
      },
      {
        "allValue": "_All_",
        "current": {},
        "datasource": "${DS_SCHEDULERX-OVERVIEW}",
        "definition": "$.data[*].groupId",
        "description": "Application group",
        "error": null,
        "hide": 0,
        "includeAll": true,
        "label": "Application group",
        "multi": false,
        "name": "groupId",
        "options": [],
        "query": {
          "cacheDurationSeconds": 0,
          "fields": [
            {
              "jsonPath": "$.data[*].groupId"
            }
          ],
          "method": "GET",
          "params": [
            [
              "operate",
              "query_appgroup"
            ],
            [
              "startTime",
              "1684132981"
            ],
            [
              "endTime",
              "1684132991"
            ],
            [
              "namespace",
              "$namespace"
            ]
          ],
          "queryParams": "",
          "urlPath": ""
        },
        "refresh": 2,
        "regex": "",
        "skipUrlSync": false,
        "sort": 0,
        "type": "query"
      }
    ]
  },
  "time": {
    "from": "now-6h",
    "to": "now"
  },
  "timepicker": {},
  "timezone": "",
  "title": "SCHEDULERX-OVERVIEW",
  "uid": "bDLXhLyVk",
  "version": 2
}
Select the data source that you configured in Step 1, and then click Import.
View the imported dashboard.
Select a namespace and an application group to view the overview data.