The API Details page in the Microservices Engine (MSE) console displays details of all interfaces of an application. The displayed information includes queries per second (QPS), abnormal requests, response time (RT), and concurrency. If you use Microservices Governance Enterprise Edition, you can also manage traffic protection rules of interfaces on this page. This topic describes the main features on the API Details page.
Feature access
-
Log on to the MSE console, and select a region in the top navigation bar.
-
In the left-side navigation pane, choose Microservices Governance > Application Governance.
-
On the Application list page, click the resource card of the desired application.
In the navigation pane on the left, click API Details.
Description
The API Details page displays the details of all interfaces of an application, including QPS, RT, and concurrency. Click the WEB service and RPC service tabs to go to the details page of different types of interfaces. The following sections describe the information that you can view on the tabs.
Web service
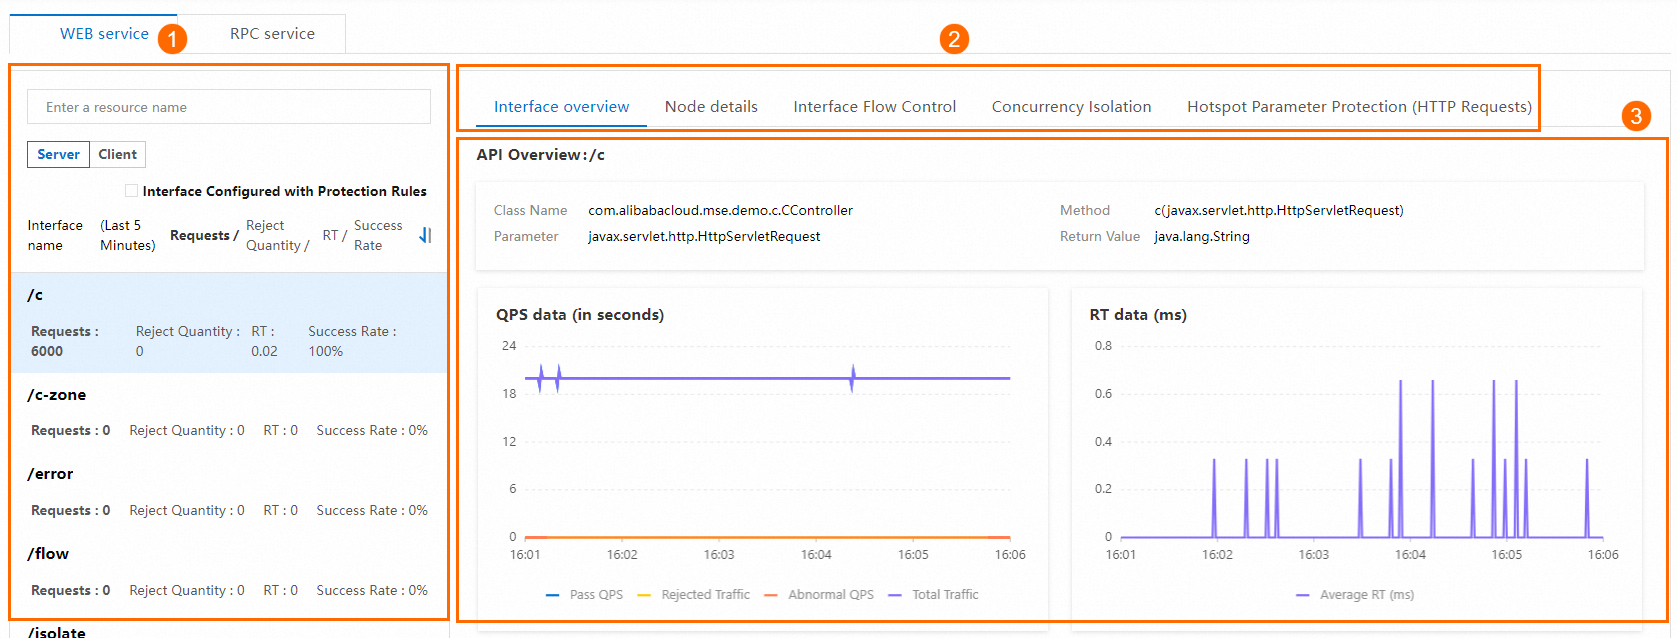
In the rectangle marked with 1, you can preview the lists of web interfaces on the Server and Client subtabs and the data of each interface collected in the previous 5 minutes, such as Requests, Reject Quantity, RT, and Success Rate. You can search for interfaces by resource name, filter only interfaces that are configured with protection rules, and sort interfaces based on Requests, Reject Quantity, RT, or Success Rate. If the
 icon is displayed on the right side of an interface, the interface is configured with protection rules. Note
If you select Interface Configured with Protection Rules, the interfaces that are configured with protection rules are displayed, regardless of whether the protection rules are enabled.
Select the feature tabs for the current API (Icon ②).
Interface overview: lets you view the data of the current interface based on QPS, RT, and concurrency.
Node details: lets you view the data of the current interface by node. The displayed information includes QPS, RT, and concurrency.
Interface Flow Control: lets you configure throttling rules for the current interface. For more information, see Configure throttling rules.
Concurrency Isolation: lets you configure isolation rules for the current interface. For more information, see Configure isolation rules.
Hotspot Parameter Protection (HTTP Requests): lets you configure hotspot parameter protection (HTTP requests) rules for the current interface. This subtab is available only for interfaces on the server side. For more information, see Configure hotspot parameter protection rules (HTTP requests).
Circuit Breaking: lets you configure circuit breaking rules for the current interface. This subtab is available only for the interfaces on the client side. For more information, see Configure circuit breaking rules.
Icon ③: Displays information corresponding to the selection in ②.
In the rectangle marked with 4, you can select the replay time. Then, you can view the metric data during the specified period of time in the rectangles marked with 1 and 3.
NoteMetric data within 24 hours can be replayed. Only metric data of the current online nodes can be replayed.
For Java applications that work as gateways, information displayed on the API Details page is not distinguished by service type, server, or client. The displayed information is similar to the information on the Server subtab of the WEB service tab. Route names are displayed in the rectangle marked with 1.
RPC Service

In the rectangle marked with 1, you can preview the list of RPC interfaces on the Server and Client subtabs and the data of each interface collected at the current time, such as Requests, Reject Quantity, RT, and Success Rate. You can search for interfaces by resource name.
NoteIn the RPC interface list, two-level information is displayed for each interface. The class name is displayed at the first level, and the method name is displayed at the second level.
In the rectangle marked with 2, you can select subtabs to view information about the current interface.
Interface overview: lets you view the data of the current interface based on QPS, RT, and concurrency.
Node details: lets you view the data of the current interface by node. The displayed information includes QPS, RT, and concurrency.
Interface Flow Control: lets you configure throttling rules for the current interface. For more information, see Configure throttling rules.
Concurrency Isolation: lets you configure isolation rules for the current interface. For more information, see Configure isolation rules.
Hotspot Parameter Protection (RPC): lets you configure hotspot parameter protection (RPC requests) rules for the current interface. This subtab is available only for interfaces on the client side. For more information, see Configure hotspot parameter protection rules (RPC requests).
Circuit Breaking: lets you configure circuit breaking rules for the current interface. This subtab is available only for the interfaces on the client side. For more information, see Configure circuit breaking rules.
Icon ③ displays information that corresponds to the selection in ②.
In the rectangle marked with 4, you can select the replay time. Then, you can view the metric data during the specified period of time in the rectangles marked with 1 and 3.
NoteMetric data within 24 hours can be replayed. Only metric data of the current online nodes can be replayed.
See also
For definitions of the metrics on this page, see the "Metrics of Microservices Governance" section in FAQ overview.