Use cloud network inter-access performance data to review average network latency between zones or regions within Alibaba Cloud. This helps you select the most suitable region or zone when deploying services. After creating an inter-region connection under an Enterprise Edition transit router (TR), you can also view latency on the physical links of that connection to choose the best link type for your business.
Performance monitoring usage disclaimer
The network latency and other performance data provided by cloud network inter-access performance monitoring are for reference only. Alibaba Cloud makes no promises or guarantees about the accuracy or real-time nature of this data. Actual network performance depends on real-world operating conditions.
The network latency shown in cloud network inter-access performance comes from a dedicated ECS probe cluster built by Alibaba Cloud. This probe cluster periodically sends and receives performance probe packets, then aggregates and displays the statistical results on the performance monitoring page. Because the test machines in the probe cluster are fully isolated from tenant resources, they do not affect or consume any of your resources. The performance monitoring data is unrelated to the actual resources you deploy on Alibaba Cloud.
Regions supported by cloud network inter-access performance monitoring
Area | Regions supporting cloud network inter-access performance monitoring |
China | China (Qingdao), China (Beijing), China (Zhangjiakou), China (Hohhot), China (Ulanqab), China (Hangzhou), China (Shanghai), China (Shenzhen), China (Heyuan), China (Guangzhou), China (Chengdu), China (Hong Kong) |
Asia Pacific Others | Japan (Tokyo), South Korea (Seoul), Singapore, Malaysia (Kuala Lumpur), Indonesia (Jakarta), Philippines (Manila), Thailand (Bangkok) |
Europe and Americas | US (Silicon Valley), US (Virginia), Germany (Frankfurt), UK (London), Mexico |
Middle East | UAE (Dubai) |
Cloud network inter-access performance metrics
Intra-region network performance: View the network latency between ECS instances within the same region.
The average latency between ECS instances across different zones within the same region.
Because Alibaba Cloud’s probe cluster does not cover certain zones, data may be unavailable for those zones. Rely on what you actually see in the console.
Inter-region network performance: View latency between network instances in different regions.
The average access latency between ECS instances in different regions.
Reference latency of Enterprise Edition TR inter-region connections on Platinum ingest endpoint or Gold ingest endpoint. The specific statistical metrics are as follows:
P10: The value at the 10th percentile after sorting the dataset in ascending order.
P50: The value at the 50th percentile after sorting the dataset in ascending order (the median).
P90: The value at the 90th percentile after sorting the dataset in ascending order.
View intra-region network performance
Log on to the NIS console.
In the navigation pane on the left, choose .
On the Intra-Region Network Performance tab, click Compute Instance Connections.
Select the region whose latency you want to view.
Turn on the Display Latency switch to view specific latency data.
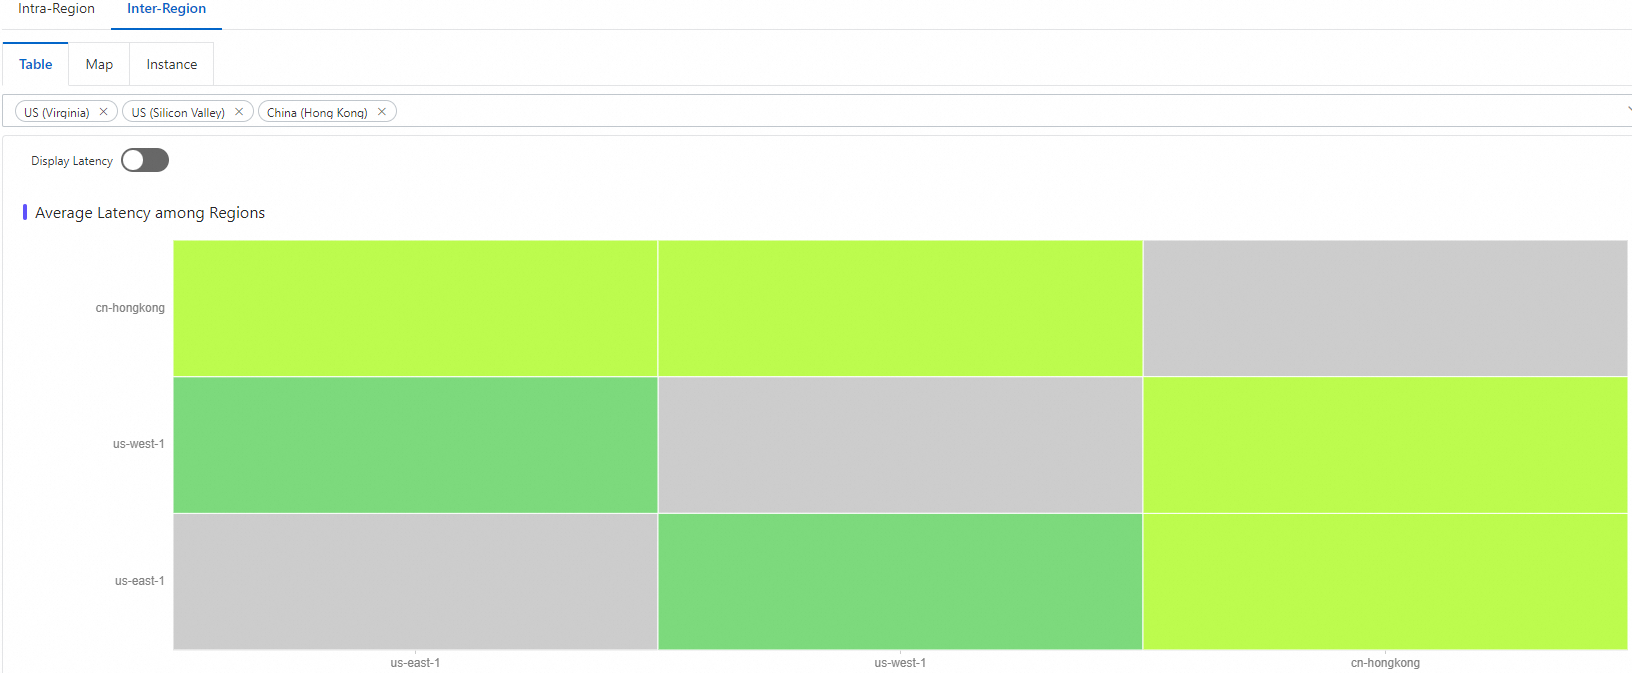
The color-coded heatmap for Average Latency Between Zones has the following meaning:
Both the horizontal and vertical axes represent the zones in the selected region.
Each colored block represents the average latency data for connections between ECS instances from the zone on the horizontal axis to the zone on the vertical axis. When the zone on the horizontal axis is the same as the zone on the vertical axis for the colored block you're viewing, it represents the average latency data for connections between ECS instances within that zone.
Because Alibaba Cloud’s probe cluster does not cover certain zones, data may be missing for some zones. Rely on what you actually see in the console.
Click any block in the Average Latency Between Zones heatmap to view historical latency over the past hour in a line chart.
View inter-region network performance
Log on to the NIS console.
In the navigation pane on the left, choose .
On the Cloud Network Inter-Access Performance page, click the Inter-Region Network Performance tab to view the following latency data.
View ECS average latency of cross-region access
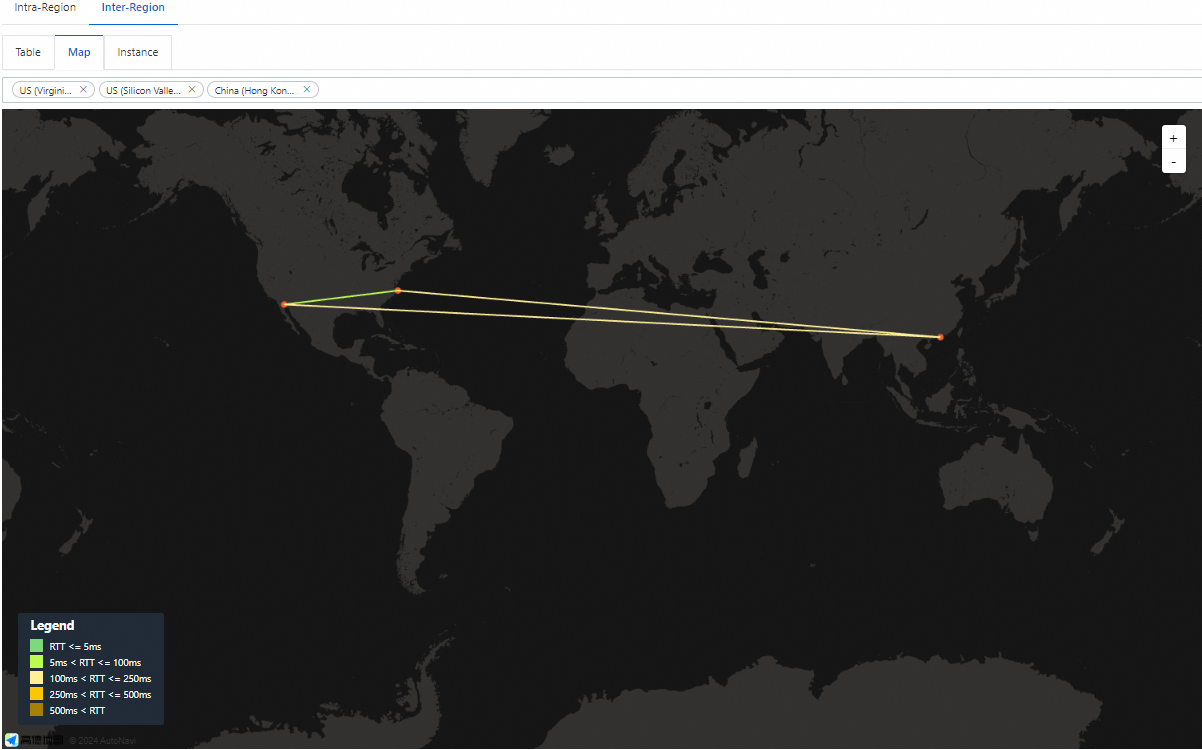
Click Table View or Map View, select regions, and view bidirectional latency between instances in the destination regions.
 Note
NoteThe Map View shows real-time average latency by default for links between US (Virginia), US (Silicon Valley), and China (Hong Kong).
Click any link on the Map View page to view details. A line chart will show historical latency over the past hour.
View reference latency for Cloud Enterprise Network (CEN) inter-region connection physical links
Click Instance View, configure the following parameters, and then click View Cross-Region Latency.
Parameter
Description
CEN instance ID
Select the TR instance ID of the CEN instance to which the target TR belongs.
Region
Select the destination region for the inter-region connection.
Inter-region connection instance ID
Select the inter-region connection instance ID.
Time
Select the time for which you want to view reference latency data. You can also set a custom time range.
Data from up to 7 days ago is available. The earliest start time you can select is 7 days before the current time.
NoteBy default, average latency data for Gold and Platinum links under the P50 metric is displayed. You can switch to view data under the P10 or P90 metrics as needed.