After you enable flow logs for a virtual private cloud (VPC), the Network Intelligence Service (NIS) Traffic Analyzer automatically analyzes VPC traffic and generates traffic analysis charts. This helps you monitor VPC network usage and performance in real time. You can view VPC bandwidth, packet rate, top N traffic details, and traffic between your VPC and the public network over a specified time period. These charts also help you observe, optimize, and maintain your network more effectively—for example, by quickly identifying high-traffic ECS instances, abnormal public network traffic, or access records from suspicious IP addresses.
Filter traffic
If you have specific traffic analysis requirements, focus your analysis by specifying the resource region, resource scope, traffic direction, bucket precision, time range, and aggregation dimension.
Specifically:
-
The maximum time range you can select depends on the storage duration configured for the Traffic Analyzer.
-
Bucket precision supports two types of precision: high precision (such as 1 minute) or long period (such as 1 day). The specific precision is determined by the Traffic Analysis Sampling Interval of either High-precision Traffic Statistics or Long-period Traffic Statistics when you create or edit a Traffic Analyzer.
-
Your ability to view 1-tuple, 2-tuple, or 5-tuple traffic analysis data depends on whether you selected these tuple types when configuring the traffic analysis storage duration.
-
When specifying the resource scope, you can filter traffic at different resource levels, dimensions, and scenarios based on the selected aggregation dimension.
Traffic analysis aggregation dimension
Supported filter conditions (you can select multiple conditions simultaneously)
Description
1-tuple
VPC, vSwitch, Elastic Network Interface (ENI), Elastic Compute Service (ECS), cloud IP
Selecting VPC filters traffic for all VPCs by default. Entering a specific VPC ID filters traffic only for that VPC.
The same logic applies to other filter conditions. When using the traffic path or network protocol filters, you can isolate traffic for specific scenarios or protocols.
After applying filters, the interface displays active conditions as tags at the bottom—for example, traffic path set to VPC private network traffic—system route, network protocol set to ICMP, and VPC set to a specific VPC-connected instance. Click Clear filters to remove all conditions at once.
NoteSupported network protocols are as displayed in the console.
2-tuple
VPC, vSwitch, ENI, ECS, source IP, destination IP, traffic path, client country, client city, client ASN, client carrier
NoteClient country, city, ASN, and carrier are available only when viewing public network traffic.
5-tuple
VPC, vSwitch, ENI, ECS, source IP, destination IP, traffic path, source port, destination port, network protocol, client country, client city, client ASN, client carrier
Click to view supported traffic paths.
View all traffic analysis charts
The following two pages display analysis data for all access traffic—including public network traffic—for specified VPC resources or scenarios.
-
Traffic Distribution page displays only analytical data for traffic that is allowed through.
-
Access Control Block Analysis page shows only analytical data for traffic intercepted by access control rules. For example, traffic denied by network ACLs or security group rules.
View traffic distribution
Log on to the NIS console.
-
In the navigation pane on the left, select Traffic Analyzer.
-
On the Traffic Analyzer page, click the target NIS Traffic Analyzer ID.
-
In the navigation pane on the left of the NIS Traffic Analyzer product page, select , specify filter criteria, and view the corresponding Traffic Trend Chart and Traffic Analysis table.
Chart
Description
Traffic trend chart
-
Bandwidth: during the current time period, the traffic transmission rate of the resource. Unit: bit/s.
-
Packet Rate: the data packet transmission rate of the resource during the current period. Unit: pps.
-
TCP RTT: Round-trip delay for TCP connection establishment during the current period. Unit: ms.
Traffic analysis
After you select the 1-tuple, 2-tuples, or 5-tuples tab at the top of the page, the system automatically displays the corresponding traffic TOP N analysis table:
-
1-tuple: Shows collector-side VPC ID, vSwitch ID, ENI ID, ECS ID, traffic path, traffic direction, destination IP (inbound only), source IP (outbound only), packet count, TCP RTT (ms), traffic (bytes), and traffic percentage for the current period.
-
2-tuple: Shows source IP, destination IP, collector-side VPC ID, vSwitch ID, ENI ID, ECS ID, traffic path, traffic direction, packet count, TCP RTT (ms), traffic (bytes), and traffic percentage for the current period.
-
5-tuple: Shows source IP, source port, protocol, destination IP, destination port, collector-side VPC ID, vSwitch ID, ENI ID, ECS ID, traffic path, traffic direction, packet count, TCP RTT (ms), traffic (bytes), and traffic percentage for the current period.
You can filter TOP N traffic data by aggregation dimension, traffic byte range, and TOP N range. Export is supported.
Results appear as a VPC TOP N traffic list containing ordinal number, source IP, destination IP, VPC ID, trend chart, trend comparison, and traffic drill-down columns. In the trend comparison column, remove a TOP N traffic trend. In the traffic drill-down column, view 5-tuple details.
-
Trend Chart
When viewing TOP N traffic, if you want to understand the trend of a specific traffic entry, you can click View Trend in the column. The system automatically displays the trend chart for that traffic during the current time period, including the Bandwidth trend chart, Packet Rate trend chart, and TCP RTT trend chart.
-
Trend Comparison
VPC Top Traffic Trend displays traffic trend comparisons for all list items by default. You can click Add to Top Traffic Trend or Remove from Trend in the column of the target list item to add or remove the corresponding trend chart from the VPC Top Traffic Trend below. Supported comparison metrics include Bandwidth, Packet Rate, and RTT.
-
Traffic Drill-down
If your Traffic Analyzer supports multiple aggregation dimensions, drill down from a TOP N traffic entry to view detailed information. From 1-tuple traffic, drill down to view corresponding 2-tuple TOP N data. From 2-tuple traffic, drill down to view corresponding 5-tuple TOP N data.
-
View access control interception analysis
Log on to the NIS console.
-
In the navigation pane on the left, select Traffic Analyzer.
-
On the Traffic Analyzer page, click the target NIS Traffic Analyzer ID.
-
In the navigation pane on the left of the NIS Traffic Analyzer detail page, select , specify filter criteria to view the corresponding interception traffic trend graph and detailed interception traffic table.
Chart
Description
Trend Chart of Blocked Traffic
-
Bandwidth: During the current period, the rate of blocked traffic. Unit: bit/s.
-
Packet Rate: The rate of intercepted data packets during the current period. Unit: pps.
Blocked Traffic Details
After you select the 1-tuple, 2-tuples, or 5-tuples tab at the top of the page, the system automatically displays the corresponding blocked traffic TOP N analysis table:
-
1-tuple: Shows collector-side VPC ID, vSwitch ID, ENI ID, ECS ID, traffic path, traffic direction, destination IP (inbound only), source IP (outbound only), packet count, traffic (bytes), and traffic percentage for the current period.
-
2-tuple: Shows source IP, destination IP, collector-side VPC ID, vSwitch ID, ENI ID, ECS ID, traffic path, traffic direction, packet count, traffic (bytes), and traffic percentage for the current period.
-
5-tuple: Shows source IP, source port, protocol, destination IP, destination port, collector-side VPC ID, vSwitch ID, ENI ID, ECS ID, traffic path, traffic direction, packet count, traffic (bytes), and traffic percentage for the current period.
You can filter TOP N intercepted traffic data by aggregation dimension, traffic byte range, and TOP N range.
Results appear as a VPC TOP N traffic list containing columns for ordinal number, source IP, destination IP, VPC ID, and support for View trend, Trend comparison, and 5-tuple drill-down operations.
-
Trend Chart
When viewing TOP N traffic, if you want to understand the trend of a specific traffic entry, you can click View Trend in the column. The system automatically displays the trend chart for that traffic during the current time period, including the Bandwidth trend chart, Packet Rate trend chart, and TCP RTT trend chart.
-
Trend Comparison
VPC Top Traffic Trend displays traffic trend comparisons for all list items by default. You can click Add to Top Traffic Trend or Remove from Trend in the column of the target list item to add or remove the corresponding trend chart from the VPC Top Traffic Trend below. Supported comparison metrics include Bandwidth, Packet Rate, and RTT.
-
Traffic Drill-down
If your Traffic Analyzer supports multiple aggregation dimensions, drill down from a TOP N traffic entry to view detailed information. From 1-tuple traffic, drill down to view corresponding 2-tuple TOP N data. From 2-tuple traffic, drill down to view corresponding 5-tuple TOP N data.
-
View public network traffic analysis charts
The following two pages display analysis data for public network access traffic for specified VPC resources or scenarios.
-
Internet Traffic Distribution page only displays analytical data for allowed Internet traffic.
-
Internet Access Control Block Analysis page only displays analytical data for public network traffic intercepted by access control rules, such as public network traffic denied by network ACLs or security group rules.
View public network traffic distribution
Log on to the NIS console.
-
In the navigation pane on the left, select Traffic Analyzer.
-
On the Traffic Analyzer page, click the target NIS Traffic Analyzer ID.
-
In the navigation pane on the left of the Traffic Analyzer detail page, select , specify filter conditions, and view the corresponding Internet traffic trend graph, Internet traffic analysis table, and traffic map (displayed only on the tuple page).
Chart
Description
Traffic trend chart
-
Bandwidth: The Internet traffic transmission rate of the resource during the current period. Unit: bit/s.
-
Packet Rate: the public network packet transmission rate of the resource during the current period. Unit: pps.
-
TCP RTT: Round-trip delay for TCP connection establishment during the current period. Unit: ms.
-
Top of Inbound Alibaba Cloud IP Address Traffic: Within the current time period, the top N public IP addresses accessing Alibaba Cloud.
ImportantOnly the binary tuple page displays Internet Coverage, Top of Inbound Alibaba Cloud IP Address Traffic statistics.
Traffic analysis
After you select the 1-tuple, 2-tuples, or 5-tuples tab at the top of the page, the system automatically displays the corresponding Internet traffic TOP N analysis table:
-
1-tuple: Shows Alibaba Cloud VPC ID, vSwitch ID, ENI ID, ECS ID, traffic path, traffic direction, destination IP (inbound only), source IP (outbound only), packet count, TCP RTT (ms), traffic (bytes), and traffic percentage for the current period.
-
2-tuple: Shows city, country, carrier, ASN, source IP, destination IP, Alibaba Cloud VPC ID, vSwitch ID, ENI ID, ECS ID, traffic path, traffic direction, packet count, TCP RTT (ms), traffic (bytes), and traffic percentage for the current period.
-
5-tuple: Shows city, country, carrier, ASN, source IP, source port, protocol, destination IP, destination port, Alibaba Cloud VPC ID, vSwitch ID, ENI ID, ECS ID, traffic path, traffic direction, packet count, TCP RTT (ms), traffic (bytes), and traffic percentage for the current period.
You can filter public network TOP N traffic data by aggregation dimension, traffic byte range, and TOP N range. Export is supported.
Results appear as a VPC TOP N traffic list with two groups of columns: client location (city, country, carrier, ASN, source IP) and traffic observation (trend chart, trend comparison, traffic drill-down). Each row supports View trend, Remove TOP N traffic trend, and 5-tuple operations.
-
Trend Chart
When viewing TOP N traffic, if you want to understand the trend of a specific traffic entry, you can click View Trend in the column. The system automatically displays the trend chart for that traffic during the current time period, including the Bandwidth trend chart, Packet Rate trend chart, and TCP RTT trend chart.
-
Trend Comparison
VPC Top Traffic Trend displays traffic trend comparisons for all list items by default. You can click Add to Top Traffic Trend or Remove from Trend in the column of the target list item to add or remove the corresponding trend chart from the VPC Top Traffic Trend below. Supported comparison metrics include Bandwidth, Packet Rate, and RTT.
-
Traffic Drill-down
If your Traffic Analyzer supports multiple aggregation dimensions, drill down from a TOP N traffic entry to view detailed information. From 1-tuple traffic, drill down to view corresponding 2-tuple TOP N data. From 2-tuple traffic, drill down to view corresponding 5-tuple TOP N data.
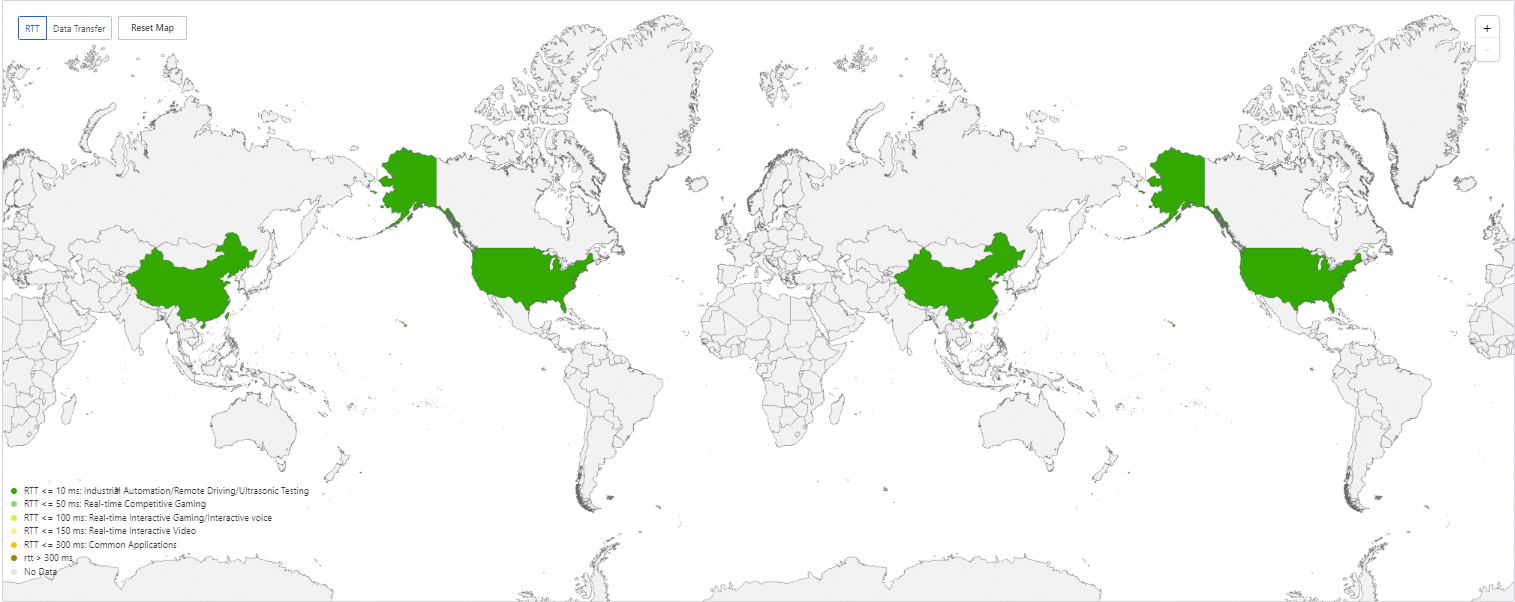
Traffic Map
2-tuples page displays a traffic map and supports viewing the following two Internet traffic data:
-
RTT: Round-trip time (RTT) for public network traffic in the current region during the current period. Unit: ms.
-
Data Transfer: During the current time period, the number of bytes of Internet traffic exchanged between various countries and VPC resources. Unit: byte.
-
View public network access control interception analysis
Log on to the NIS console.
-
In the navigation pane on the left, select Traffic Analyzer.
-
On the Traffic Analyzer page, click the target NIS Traffic Analyzer ID.
-
In the navigation pane on the left of the NIS Traffic Analyzer product page, select , specify filter conditions, and view the corresponding interception traffic trend graph and interception traffic details table.
Chart
Description
Intercepted traffic trend chart
-
Bandwidth: the rate of intercepted Internet traffic during the current period. Unit: bit/s.
-
Packet Rate: the rate of intercepted public network data packets during the current period. Unit: pps.
Intercepted traffic details
After you select the 1-tuple, 2-tuples, or 5-tuples tab at the top of the page, the system automatically displays the corresponding blocked traffic TOP N analysis table:
-
1-tuple: Shows Alibaba Cloud VPC ID, vSwitch ID, ENI ID, ECS ID, traffic path, traffic direction, destination IP (inbound only), source IP (outbound only), packet count, traffic (bytes), and traffic percentage for the current period.
-
2-tuple: Shows city, country, carrier, ASN, source IP, destination IP, Alibaba Cloud VPC ID, vSwitch ID, ENI ID, ECS ID, traffic path, traffic direction, packet count, traffic (bytes), and traffic percentage for the current period.
-
5-tuple: Shows city, country, carrier, ASN, source IP, source port, protocol, destination IP, destination port, Alibaba Cloud VPC ID, vSwitch ID, ENI ID, ECS ID, traffic path, traffic direction, packet count, traffic (bytes), and traffic percentage for the current period.
You can filter TOP N intercepted traffic data by aggregation dimension, traffic byte range, and TOP N range.
Results appear as a VPC TOP N traffic list containing client location (city, country, carrier, ASN, source IP) and traffic observation (View trend, Remove TOP N traffic trend, 5-tuple) columns.
-
Trend Chart
When viewing TOP N traffic, if you want to understand the trend of a specific traffic entry, you can click View Trend in the column. The system automatically displays the trend chart for that traffic during the current time period, including the Bandwidth trend chart, Packet Rate trend chart, and TCP RTT trend chart.
-
Trend Comparison
VPC Top Traffic Trend displays traffic trend comparisons for all list items by default. You can click Add to Top Traffic Trend or Remove from Trend in the column of the target list item to add or remove the corresponding trend chart from the VPC Top Traffic Trend below. Supported comparison metrics include Bandwidth, Packet Rate, and RTT.
-
Traffic Drill-down
If your Traffic Analyzer supports multiple aggregation dimensions, drill down from a TOP N traffic entry to view detailed information. From 1-tuple traffic, drill down to view corresponding 2-tuple TOP N data. From 2-tuple traffic, drill down to view corresponding 5-tuple TOP N data.
-
Limits
A single query can scan up to 10 million raw log entries. If exceeded, the system returns a QuotaExceeded.CheckRowReadLimit error. Optimize your queries to reduce scan volume:
-
Shorten the query time range: Focus on the business activity period. Longer time spans require scanning more logs.
-
Refine the traffic scope: Filter by specific traffic parameters based on your business needs. Alternatively, start with 2-tuple analysis to identify target traffic ranges, then drill down to 5-tuple analysis.