The drop-down suggestion report tracks the performance of your autocomplete feature across five metric categories: core metrics, traffic metrics, click metrics, guided search metrics, and query analysis metrics.
Core metrics: a high-level summary of suggestion quality and engagement
Traffic metrics: request volume, error rates, and retrieval coverage
Click metrics: how users interact with individual suggestions
Guided search metrics: what happens after a user clicks a suggestion and runs a search
Query analysis metrics: the top queries returning no or too few suggestions
View a trend chart
Each metric has a line chart showing the trend over the last seven days. By default, the report shows data for the previous day. Use the date picker to select a different date or time range.
After you upload behavioral data, the corresponding metrics are available the next day.
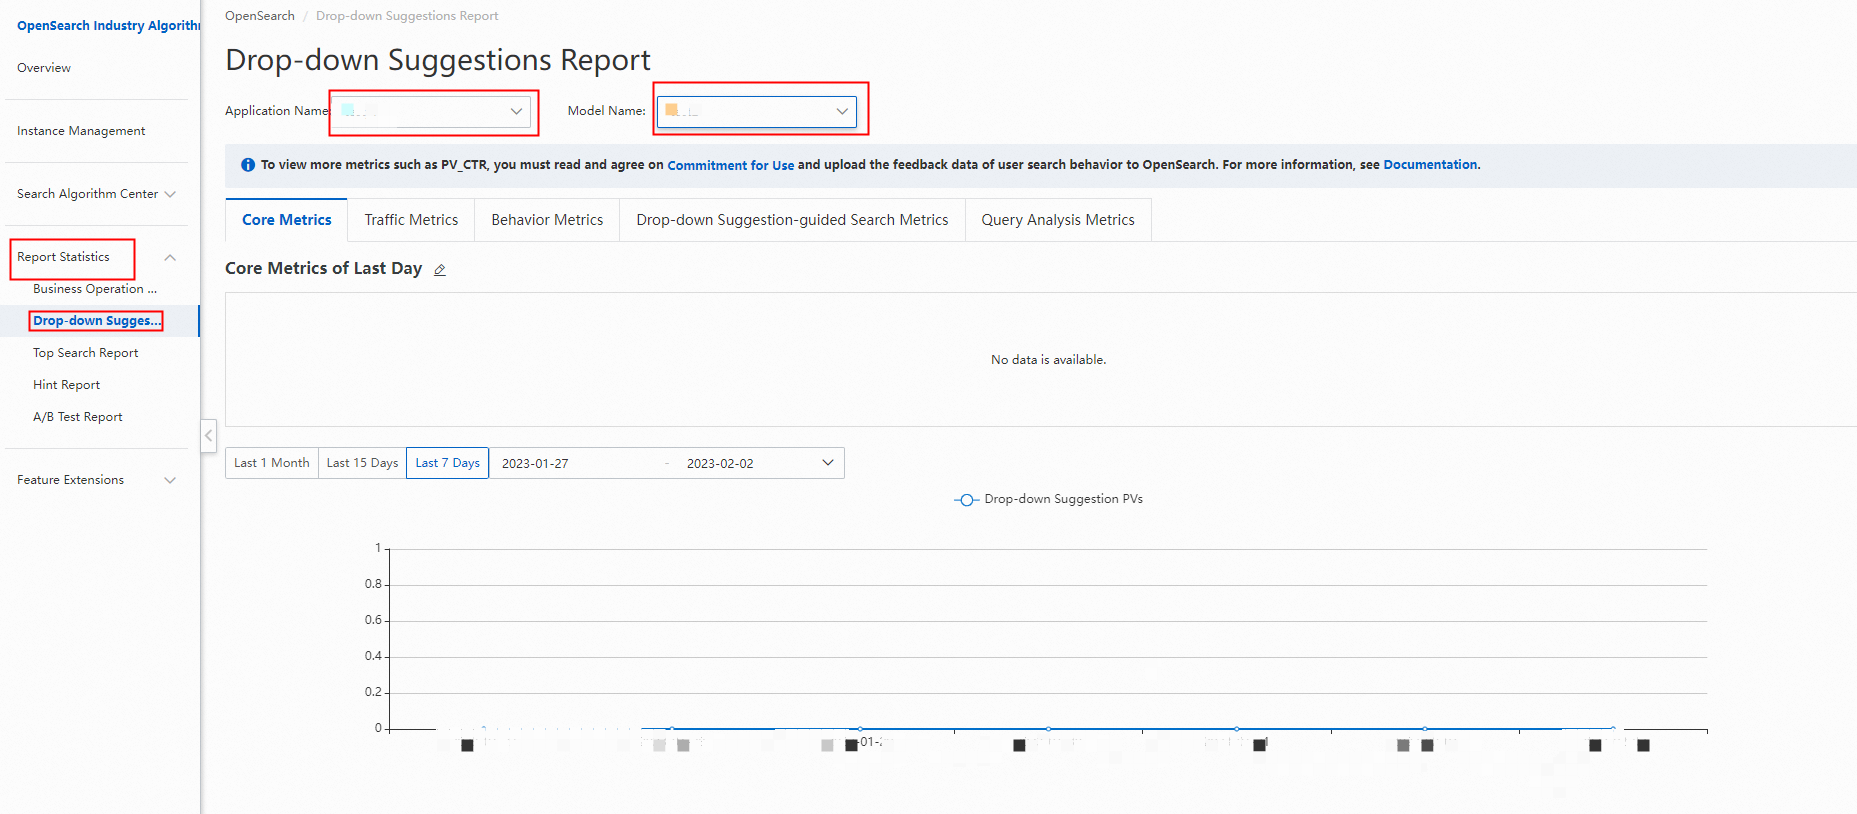
To view a trend chart:
In the left-side navigation pane, choose Report Statistics > Drop-down prompt report.
Select an application from the Application Name drop-down list and a model from the Model name drop-down list.
Click a metric category tab.
Select a metric from the Indicator change trend drop-down list.
Set the date picker to the time range you want.
Prerequisites for click and guided search metrics
Several metrics require specific fields in your requests. Without these fields, the corresponding metrics are not calculated.
| Required field | Where to set it | Metrics it enables |
|---|---|---|
user_id | Drop-down suggestion requests | UV-based metrics: Drop-down suggestion UV, Drop-down suggestion UV-CTR, Guided search UV, Guided search UV ratio |
raw_query and from_request_id | Search requests | All click metrics and guided search metrics |
| Data collection feature + click behavioral data | Uploaded behavioral data | Guided search PV-CTR, Guided search click-through rate |
Data collection feature + purchase behavioral data (bhv_type=buy) | Uploaded behavioral data | Guided search GMV |
Data collection feature + favorites behavioral data (bhv_type=collect) | Uploaded behavioral data | Guided search favorite conversion rate |
Data collection feature + cart behavioral data (bhv_type=cart) | Uploaded behavioral data | Guided search cart conversion rate |
Data collection feature + like behavioral data (bhv_type=like) | Uploaded behavioral data | Guided search like conversion rate |
Data collection feature + comment behavioral data (bhv_type=comment) | Uploaded behavioral data | Guided search review conversion rate |
Core metrics
Core metrics give you a snapshot of overall drop-down suggestion health: request volume, user reach, and engagement rates.
Drop-down suggestion PV and UV also appear in Traffic metrics with the same definitions. Core metrics highlights them alongside click-through rate (CTR) and guided search ratios for a quick assessment of end-to-end suggestion performance.
| Metric | Definition | Calculation |
|---|---|---|
| Drop-down suggestion PV | Number of successful drop-down suggestion requests. Failed requests are not counted. | Counts each request that receives a success response. |
| Drop-down suggestion UV | Number of unique users who sent drop-down suggestion requests and received results. Failed requests are not counted. Requires user_id. | Counts each user once, regardless of how many requests the user sent. |
| No-result rate | Ratio of drop-down suggestion requests that returned empty results to all requests. | No-result requests / Drop-down suggestion PV. |
| Request error count | Number of drop-down suggestion requests that received an error response (for example, due to throttling). | Counts each failed request. |
| Drop-down suggestion PV-CTR | CTR of drop-down suggestions, measured by page view. Requires raw_query and from_request_id. | Drop-down suggestion IPV / Drop-down suggestion PV. |
| Drop-down suggestion UV-CTR | CTR of users who received drop-down suggestions, measured by unique visitors. Requires raw_query, from_request_id, and user_id. | Drop-down suggestion IPV_UV / Drop-down suggestion UV. |
| Drop-down suggestion top-3 PV-CTR | CTR of the top three drop-down suggestions. Use this to assess ranking quality. Requires raw_query and from_request_id. | Item page views (IPVs) on top 3 suggestions / Drop-down suggestion PV. |
| Guided search PV ratio | Ratio of searches initiated by clicking a drop-down suggestion (guided searches) to all searches. Requires raw_query and from_request_id. | Guided search PV / Search PV. |
| Guided search PV-CTR | CTR of search result pages reached via guided searches. Requires raw_query, from_request_id, the data collection feature, and uploaded click behavioral data. | IPVs on guided search results / Guided search PV. |
Traffic metrics
Traffic metrics show request volume, retrieval coverage, and error rates in detail. Use these to identify retrieval gaps and error patterns.
| Metric | Definition | Calculation |
|---|---|---|
| Drop-down suggestion PV | Number of successful drop-down suggestion requests. Failed requests (for example, due to throttling) are not counted. | Counts each request that receives a success response. |
| Drop-down suggestion UV | Number of unique users who sent drop-down suggestion requests and received results. Failed requests are not counted. Requires user_id. | Counts each user once, regardless of how many requests the user sent. |
| No-result rate | Ratio of requests returning empty results to all requests. A high rate indicates a retrieval or content coverage gap. | No-result requests / Drop-down suggestion PV. |
| Partial-result rate | Ratio of requests whose results contain fewer suggestions than the expected count (set by the hits field) to all requests. | Under-threshold requests / Drop-down suggestion PV. |
| Request error count | Number of requests that received an error response (for example, due to throttling). | Counts each failed request. |
| Request error rate | Ratio of failed requests to all requests. | Request error count / (Drop-down suggestion PV + Request error count). |
Click metrics
Click metrics track how users interact with the suggestions returned. All metrics in this category require raw_query and from_request_id in search requests.
| Metric | Definition | Calculation |
|---|---|---|
| Drop-down suggestion IPV | Number of clicks on drop-down suggestions. | Counts each click on a suggestion. |
| Drop-down suggestion IPV_UV | Number of unique users who clicked a drop-down suggestion. Requires user_id in addition to raw_query and from_request_id. | Counts each user once, regardless of how many times the user clicked. |
| Drop-down suggestion PV-CTR | CTR of drop-down suggestions, measured by page view. | Drop-down suggestion IPV / Drop-down suggestion PV. |
| Drop-down suggestion UV-CTR | CTR of users who received suggestions. Requires user_id in addition to raw_query and from_request_id. | Drop-down suggestion IPV_UV / Drop-down suggestion UV. |
| Top-1 PV-CTR | CTR of the first drop-down suggestion. Measures how effective the top-ranked suggestion is. | Clicks on the first suggestion / Drop-down suggestion PV. |
| Top-3 PV-CTR | CTR of the top three drop-down suggestions. | IPVs on top 3 suggestions / Drop-down suggestion PV. |
| Top-5 PV-CTR | CTR of the top five drop-down suggestions. | Clicks on top 5 suggestions / Drop-down suggestion PV. |
Guided search metrics
A guided search is a search triggered when a user clicks a drop-down suggestion. Guided search metrics show the volume, engagement, and conversion impact of suggestion-driven searches.
All metrics in this category require raw_query and from_request_id in search requests, unless noted otherwise.
| Metric | Definition | Calculation |
|---|---|---|
| Guided search PV | Number of guided searches, including paging requests. | Counts each search request sent after a suggestion click. |
| Guided search PV ratio | Ratio of guided searches to all searches. | Guided search PV / Search PV. |
| Guided search UV | Number of unique users who performed a guided search. Requires user_id. | Counts each user once. |
| Guided search UV ratio | Ratio of users who performed a guided search to all users who received suggestions. Requires user_id. | Guided search UV / Search UV. |
| Guided search no-result rate | Ratio of guided searches returning empty results to all guided searches. | Empty-result guided searches / Guided search PV. |
| Guided search PV-CTR | CTR of items in guided search results. Requires the data collection feature and uploaded click behavioral data. | IPVs in guided search results / Guided search PV. |
| Guided search click-through rate | Ratio of guided searches whose results were clicked to all guided searches. Requires the data collection feature and uploaded click behavioral data. | Guided searches with at least one click / Guided search PV. |
| Guided search GMV | Gross merchandise volume (GMV) generated from guided searches. Requires the data collection feature and uploaded purchase behavioral data (bhv_type=buy). | Sum of transaction amounts from guided searches. |
| Guided search favorite conversion rate | Ratio of guided searches that led users to add an item to favorites to all guided searches. Requires the data collection feature and uploaded favorites behavioral data (bhv_type=collect). | Guided searches with a favorites action / Guided search PV. |
| Guided search cart conversion rate | Ratio of guided searches that led users to add an item to their shopping cart (or bookshelf, or playlist) to all guided searches. Requires the data collection feature and uploaded cart behavioral data (bhv_type=cart). | Guided searches with a cart action / Guided search PV. |
| Guided search like conversion rate | Ratio of guided searches that led users to like an item to all guided searches. Requires the data collection feature and uploaded like behavioral data (bhv_type=like). | Guided searches with a like action / Guided search PV. |
| Guided search review conversion rate | Ratio of guided searches that led users to post a comment to all guided searches. Requires the data collection feature and uploaded comment behavioral data (bhv_type=comment). | Guided searches with a comment action / Guided search PV. |
Query analysis metrics
Query analysis metrics surface the top 100 queries with retrieval problems: either no suggestions at all, or fewer suggestions than expected. Use these lists to identify and fix retrieval gaps.
Queries with no suggestions
These are the top 100 most frequently queried terms that returned zero suggestions.
| Metric | Definition | Calculation |
|---|---|---|
| Query | A high-frequency query with zero drop-down suggestions returned. | Ranked by frequency compared against other queries with empty results. |
| Drop-down suggestion PV | Number of successful requests for this query. | Counts each request for this query that received a success response. |
If a query consistently returns no suggestions, consider expanding your suggestion content or adjusting your retrieval configuration to cover these terms.
Queries with too few suggestions
These are the top 100 most frequently queried terms that returned fewer suggestions than the expected count set by the hits field.
| Metric | Definition | Calculation |
|---|---|---|
| Query | A high-frequency query returning fewer suggestions than the hits threshold. | Ranked by frequency and compared against the hits value. |
| Drop-down suggestion PV | Number of successful requests for this query. | Counts each request for this query that received a success response. |
If a query consistently returns fewer suggestions than expected, consider adding more content variations or increasing the coverage in your suggestion index.