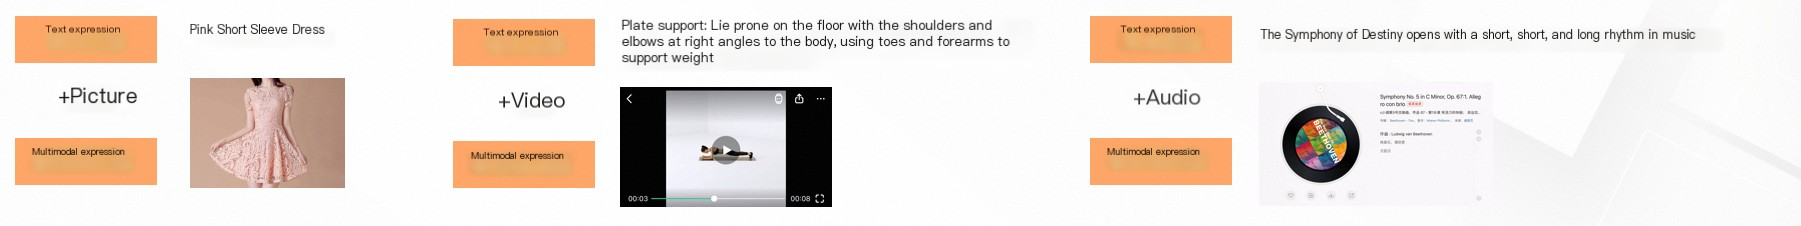
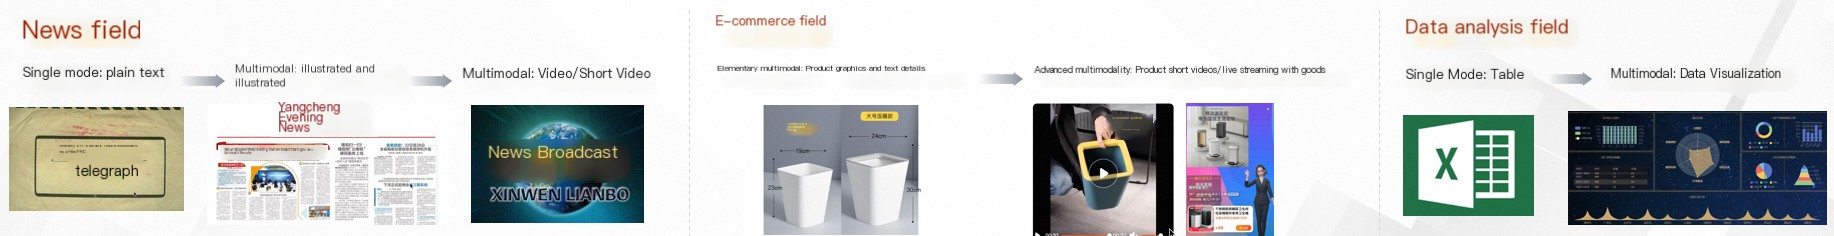
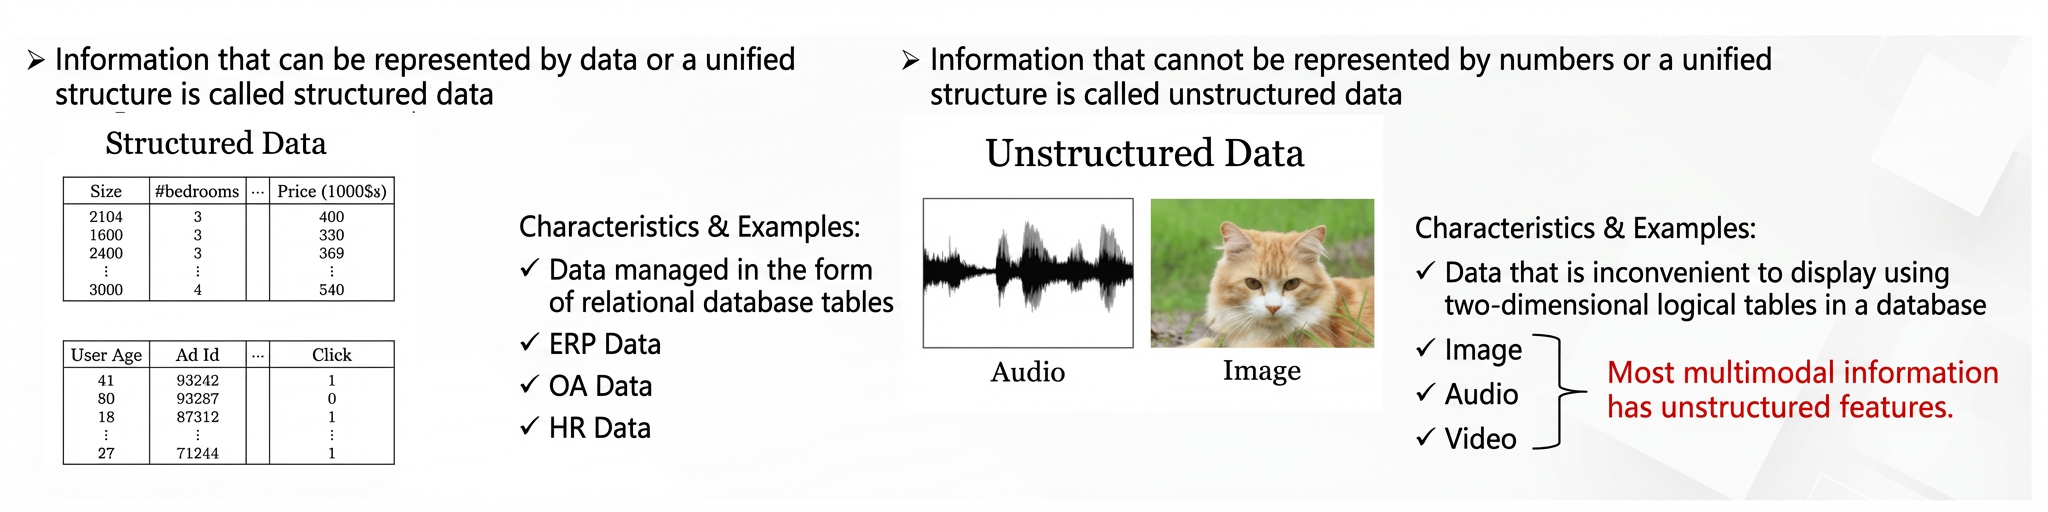
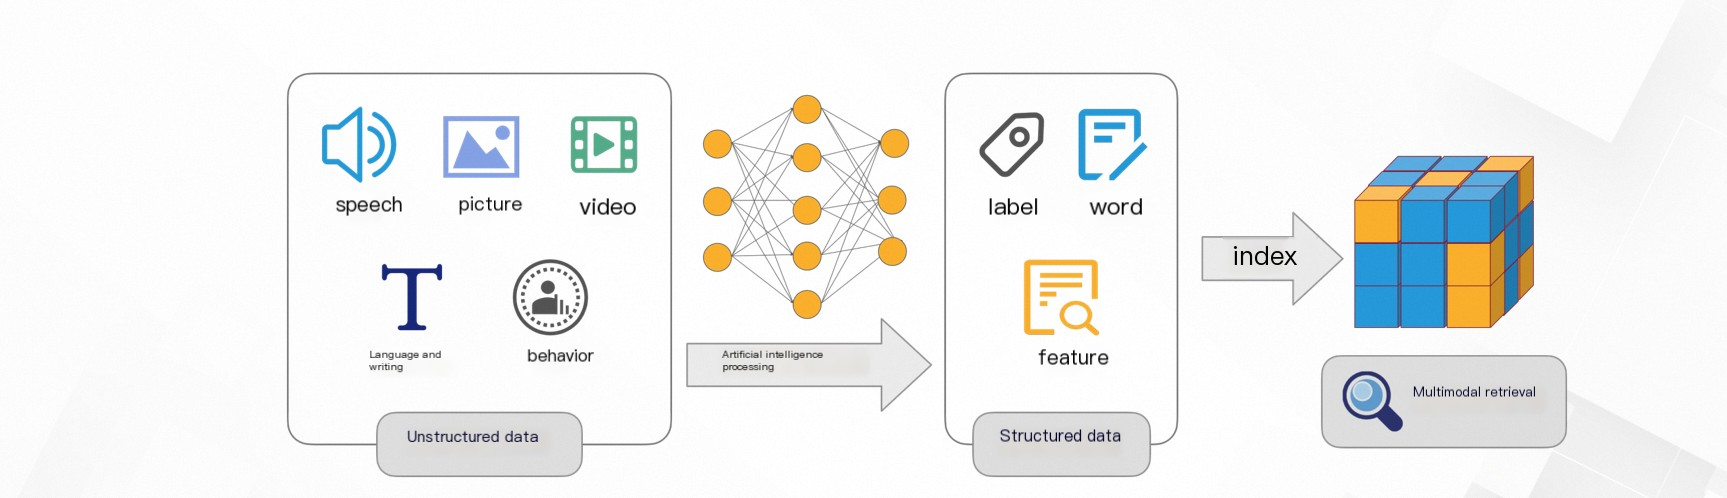
OpenSearch Vector Search Edition converts unstructured data—images, audio, video, and text—into multidimensional vectors and retrieves the most similar results by calculating the distance between them. This topic explains how vector retrieval works, the five available algorithms, and the two distance metrics used to measure similarity.
How vector retrieval works
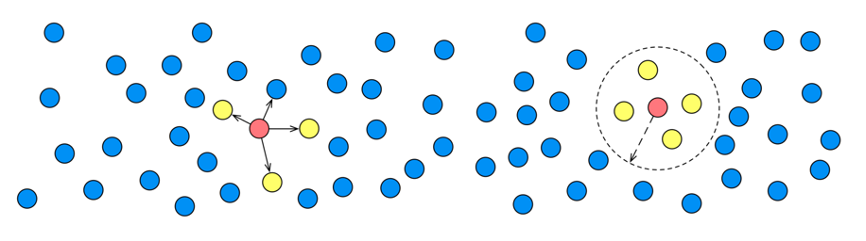
Traditional keyword-based search cannot effectively handle unstructured data. Vector retrieval solves this by encoding unstructured data as multidimensional vectors that capture semantic relationships between entities.
Once data is encoded as vectors, OpenSearch calculates the distance between the query vector and stored vectors. The closer the distance, the higher the similarity. OpenSearch returns the top N vectors with the highest similarity.
Vector retrieval algorithms
OpenSearch supports five algorithms across four categories:
| Category | Algorithm | Best for |
|---|---|---|
| Brute-force | Linear | Tens of thousands of vectors; exact results required |
| Cluster-based | Quantized clustering | Hundreds of millions of vectors; high accuracy not required |
| Graph-based | HNSW | Tens of millions of vectors; high recall and low latency required |
| Graph-based | QGraph | Billions of vectors; high speed required; high accuracy not required |
| GPU-accelerated graph | CAGRA | High-QPS workloads; low latency critical |
Linear
The linear algorithm scans all vectors sequentially to find the nearest neighbors, achieving 100% recall.
When to use: datasets with tens of thousands of vectors where exact results are required.
Trade-off: low query speed; high CPU and memory usage at large scale.
Quantized clustering
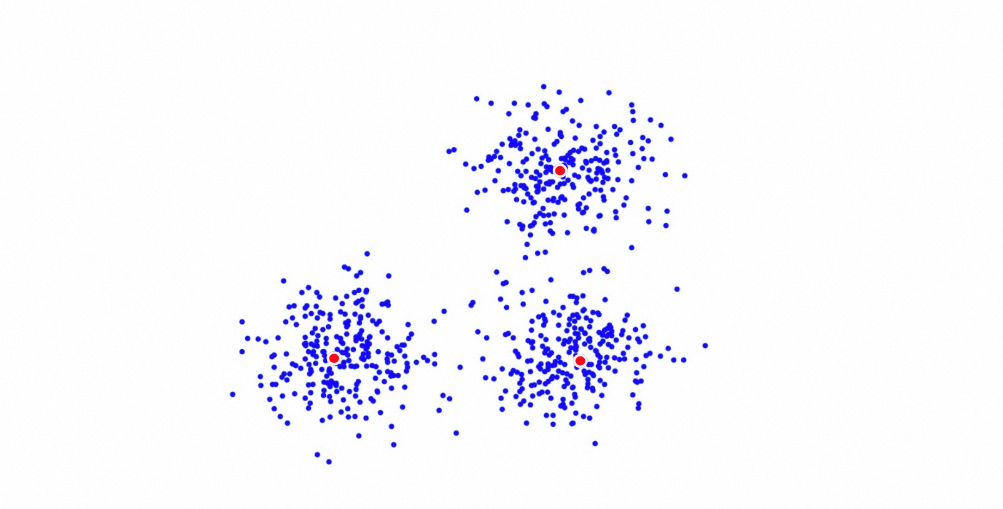
Quantized clustering is an algorithm developed by Alibaba Cloud based on K-means clustering. During indexing, it identifies n centroids across the vector dataset and assigns each document to its nearest centroid, building n posting lists. These centroids and their posting lists form the index.
During retrieval, OpenSearch calculates the distance between the query vector and several centroids, selects the nearest ones, then searches within their posting lists and returns the top K documents.
Quantized clustering supports FP16 and INT8 quantization, which reduces index size and improves retrieval speed at the cost of some accuracy. Enable or disable quantization based on your accuracy requirements.
When to use: datasets with hundreds of millions of vectors where maximum accuracy and minimum latency are not required, or real-time scenarios using GPU resources.
Trade-off: lower recall rate and lower query speed than HNSW.
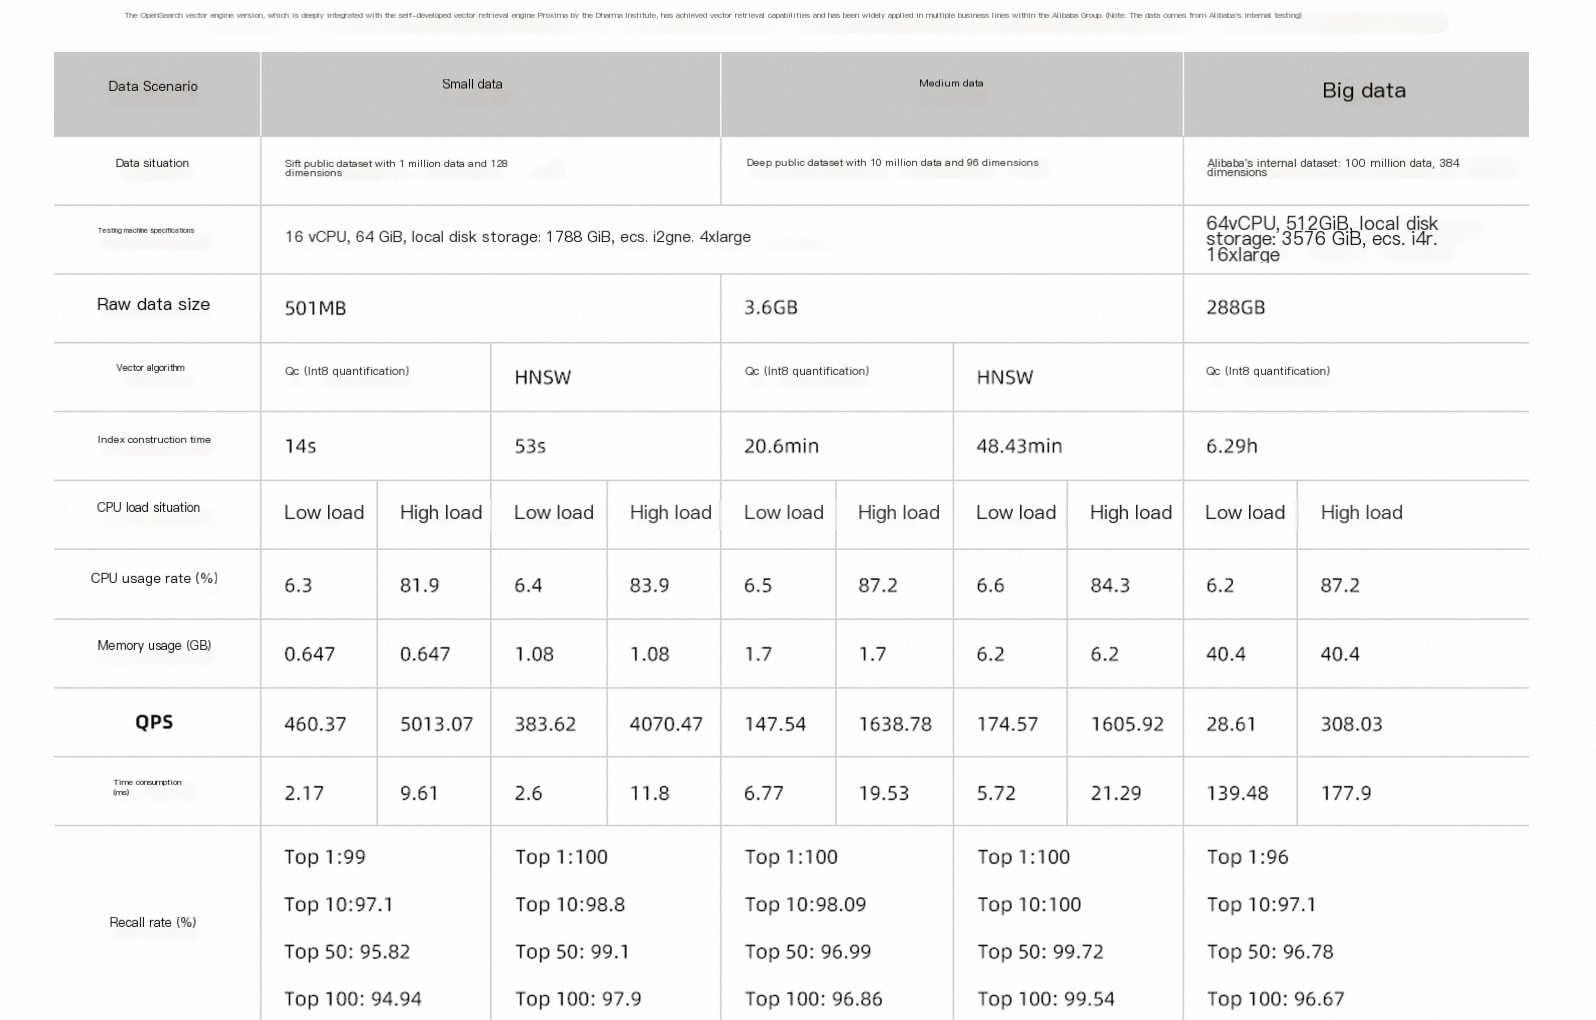
Parameter tuning: Quantized clustering configurations
The following figure shows algorithm performance across different data volumes.
HNSW
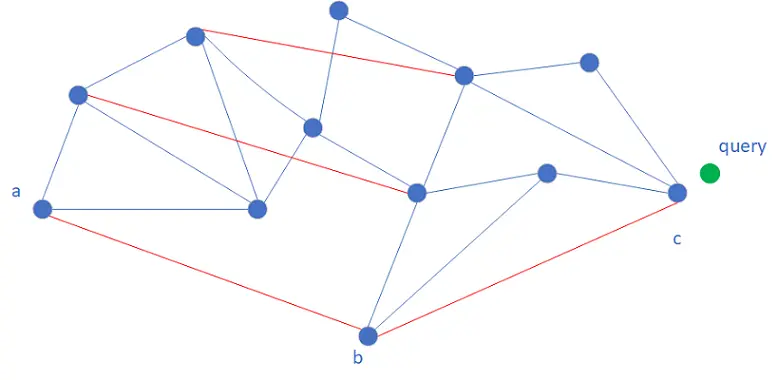
Hierarchical Navigable Small World (HNSW) is a graph-based algorithm that builds edges between neighboring vectors to form a proximity graph. The graph—vertices and edges—forms the index.
During retrieval, OpenSearch starts from an entry vector, calculates distances to adjacent vectors, and moves to the nearest neighbor at each step. This continues until convergence: when OpenSearch finds an adjacent vector of the current vector that is closer to the request vector than all other retrieved adjacent vectors.
To accelerate convergence, HNSW uses a multi-layer proximity graph modeled on skip list logic. Retrieval proceeds top-down. Upper layers contain sparser nodes with longer edges, enabling larger traversal steps. When convergence is reached in layer K, the convergence point becomes the entry vector for layer K-1, and the search continues downward with finer granularity.
When to use: datasets with tens of millions of vectors where both high recall and low latency are required.
Trade-off: high CPU utilization and memory usage.
Parameter tuning: HNSW configuration
QGraph
Quantized Graph (QGraph) is an improved HNSW-based algorithm developed by OpenSearch. It quantizes raw vector data during index construction before building the graph index, reducing the index to up to 1/8 the size of an equivalent HNSW index. CPU instruction optimizations for integer arithmetic improve query performance by several times compared to HNSW.
QGraph supports three quantization levels:
| Quantization level | Memory usage | Query performance | Recall rate |
|---|---|---|---|
| int4 | Lowest | Highest | Lowest |
| int8 | Medium | Medium | Medium |
| int16 | Nearly identical to unquantized | Nearly identical to unquantized | Nearly identical to unquantized |
int16 quantization behaves similarly to unquantized data due to characteristics of the underlying CPU instruction set.
After quantization, vector discrimination decreases, so recall rate is lower than HNSW. Use more recall candidates to compensate when needed.
When to use: datasets with billions of vectors where high query speed is required and high accuracy is not.
Trade-off: lower recall rate than HNSW.
Parameter tuning: QGraph (Quantized Graph) configuration
CAGRA
CUDA ANN GRAph-based (CAGRA) is a GPU-accelerated graph algorithm optimized for NVIDIA GPUs. Unlike HNSW, CAGRA builds a single-layer proximity graph designed for parallel computing.
During retrieval, CAGRA maintains an ordered set of candidate vectors. In each iteration, it selects the top K candidates as retrieval starting points and updates the set with their neighbors. The process repeats until all top K candidates have been used as starting points, at which point the algorithm converges.
CAGRA uses two execution policies:
Single-CTA: one thread block handles one vector retrieval. More efficient at large batch sizes.
Multi-CTA: multiple thread blocks handle one vector retrieval. Higher recall at small batch sizes, but lower throughput than single-CTA at large batch sizes.
The optimal policy is selected automatically based on workload.
When to use: high-QPS scenarios where low latency is critical.
Trade-off: high GPU costs; low cost-effectiveness in low-QPS scenarios.
Algorithm comparison
| Algorithm | Advantage | Disadvantage | Data scale |
|---|---|---|---|
| Linear | 100% recall rate | Low query speed; highest CPU and memory usage | Tens of thousands of vectors |
| Quantized clustering | Low CPU utilization and memory usage | Lower recall rate and query speed than HNSW | Hundreds of millions of vectors |
| HNSW | High recall rate and query speed | High CPU utilization and memory usage | Tens of millions of vectors |
| QGraph | Low CPU utilization and memory usage; several times faster than HNSW | Lower recall rate than HNSW | Billions of vectors |
| CAGRA | Several times to dozens of times faster than CPU-based algorithms | High GPU costs; low cost-effectiveness at low QPS | High-QPS workloads |
Vector distance metrics
Similarity between vectors is measured by calculating the distance between them. A smaller score indicates a closer distance and higher similarity; a larger score indicates a greater distance and lower similarity.
OpenSearch supports two distance metrics:
| Metric | Definition | Range | Interpretation |
|---|---|---|---|
| Squared Euclidean distance | Square root of the sum of squared coordinate differences between two vectors | 0 <= d < infinity | 0: identical vectors; larger value = less similar |
| Inner product | Sum of products of corresponding vector elements (dot product) | -infinity < d < infinity | Larger value = more similar; depends on whether the algorithm supports an inner product model |
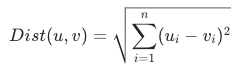
Squared Euclidean distance
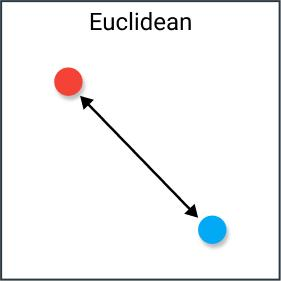
Squared Euclidean distance refers to the distance between two vectors on the plane. A smaller value means higher similarity; a value of 0 means the vectors are identical.
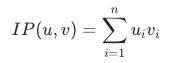
Inner product
The inner product (dot product or scalar product) multiplies corresponding elements of two vectors and sums the results. A larger inner product means higher similarity. This metric is commonly used in search and recommendation scenarios. Whether to use it depends on whether the chosen algorithm supports an inner product model.