Exception analysis
When Java applications throw exceptions in production, you need to quickly identify which exceptions occur most frequently, which operations they affect, and what the root cause is. Exception analysis in Managed Service for OpenTelemetry aggregates exceptions across your application and lets you filter by exception name, operation, or host to pinpoint recurring failures, track trends over time, and drill into stack traces.
How exception analysis works
Managed Service for OpenTelemetry captures Java exceptions thrown during operation calls. Two behaviors affect which exceptions appear in the analysis:
Caught exceptions: Exceptions handled by
try-catchblocks may not appear. If atry-catchblock runs multiple times within a single operation call, each execution can produce a different exception type.Uncaught exceptions: When an exception affects the response of a request without being caught by a
try-catchblock, an error is returned.
View exception analysis data
Before you begin, make sure your application data is reported to Managed Service for OpenTelemetry. For setup instructions, see Connection description.
Log on to the ARMS console. In the left-side navigation pane, choose Application Monitoring > Application List.
On the Application List page, select a region in the top navigation bar, then click the application name.
The Language column indicates how the application is connected. A
 icon means the application uses Application Monitoring. A hyphen (-) means it uses Managed Service for OpenTelemetry.
In the top navigation bar, click Exceptions.
The Exceptions tab has three sections:
Quick filter
Use the Quick Filter section to narrow results by exception name, operation, or host. The filters apply to both the trend chart and the exception list.
Exception trend chart
The trend chart displays the number of exceptions reported over a selected time period as a stacked chart. Each exception type is shown as a separate layer, so spikes in specific exception types are easy to spot.
| Action | Description |
|---|---|
| View or compare metrics | Click the  icon to view metric data in a specific time period or compare metric data across different dates within the same time window. icon to view metric data in a specific time period or compare metric data across different dates within the same time window. |
| Switch chart type | Click the  icon to switch between a column chart and a trend chart. icon to switch between a column chart and a trend chart. |
Exception list
The exception list shows each exception with its name, occurrence count, proportion, and exception stack.
| Action | Description |
|---|---|
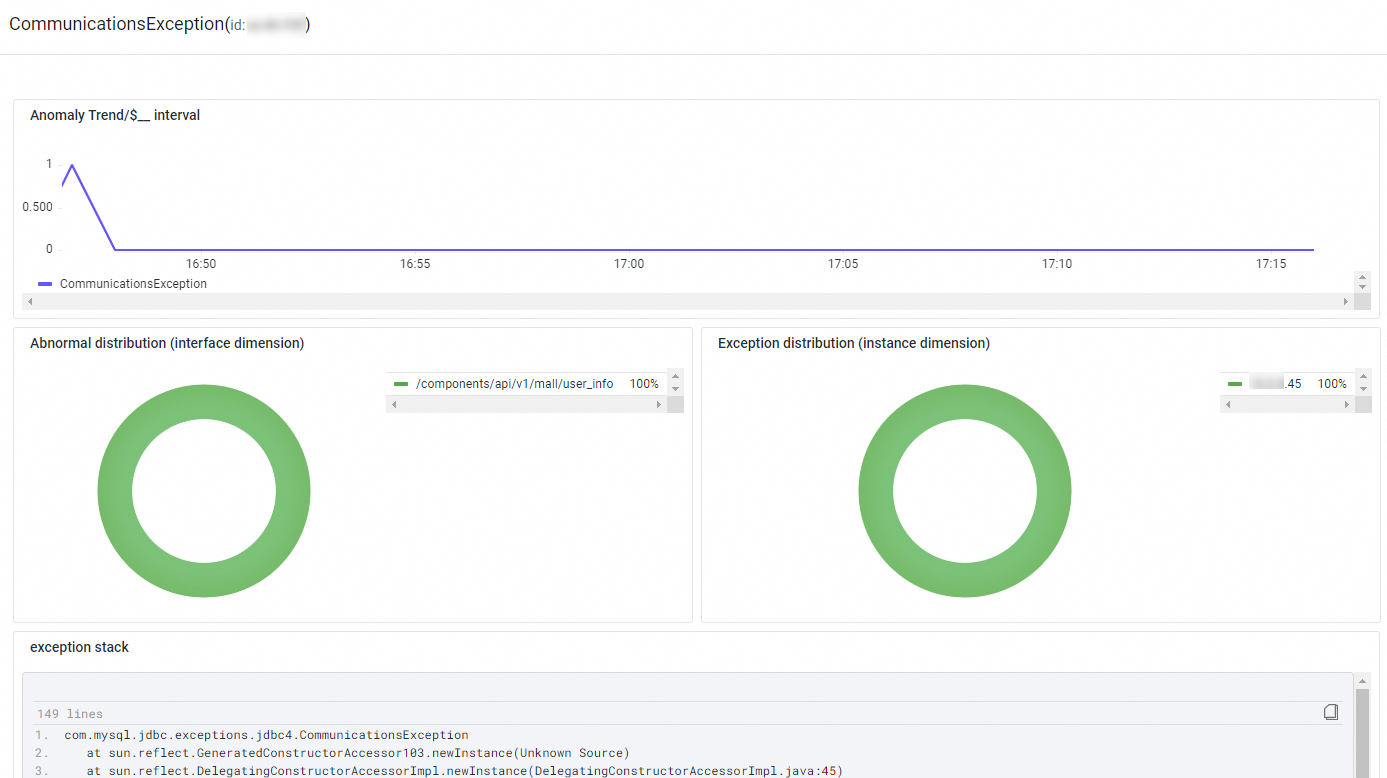
| View exception details | Click Overview in the Actions column. The panel shows the trend of how often the exception occurs, exception distribution by operation and host, and the exception stack. |
| Inspect related traces | Click Traces in the Actions column to open the trace details for a specific request. For more information, see Trace Explorer. |
Set up exception alerts
To avoid diagnosing errors only after they occur, create alert rules for specific operations or all operations. When errors occur, the system sends notifications to your O&M team. For details, see Application monitoring alert rules.