Cluster configurations
Managed Service for OpenTelemetry uses cluster-level settings to control how trace and metric data flows through a region. Use the Cluster Configurations tab to enable or disable data ingestion, configure metrics aggregation from traces, and review data retention periods.
All settings on this tab apply to every application in the selected region. The following diagram shows where each setting takes effect in the data pipeline:
Instrumented app ──> Data ingestion ──> Trace storage (30 days)
                    (Capture Data)   |
                                     |──> Metrics aggregation ──> Metric storage (90 days)
                                     |   (Metrics Aggregation       |
                                     |    by Traces)            Dashboards / Alerts
                                     |
                                     └──> Trace analysis
Enable or disable data ingestion
The Capture Data setting determines whether Managed Service for OpenTelemetry accepts trace and metric data from applications in the selected region. When set to Disable All, no data ingestion charges apply.
| Value | Behavior |
|---|---|
| Enable All | Accepts data from all applications in the region. |
| Disable All | Rejects data from all applications in the region. No data ingestion charges apply. |
| Enable by Default | Accepts data from applications that have no explicit per-application ingestion configuration. Applications with explicit configuration follow their own settings. |
| Disable by Default | Rejects data from applications that have no explicit per-application ingestion configuration. Applications with explicit configuration follow their own settings. |

Aggregate metrics from traces
By default, Managed Service for OpenTelemetry derives service metrics from ingested trace data. These derived metrics power dashboards, alerting rules, and custom queries.
Set Metrics Aggregation by Traces to one of the following values:
| Value | Behavior | Affected features |
|---|---|---|
| Enable | Derives service metrics from trace data. Only traces ingested after you enable this setting are processed. Previously ingested traces are not retroactively processed. | Dashboards, alerting rules, and custom metric queries receive data. |
| Disable | Stops deriving service metrics from traces. Raw trace data is still ingested and stored. | Dashboard panels that rely on derived metrics show no data. Trace analysis remains fully functional. |
What is not affected when you disable aggregation:
Metrics that the client SDK reports directly (not derived from traces) are still ingested and stored.
Raw trace data continues to be ingested and queryable through trace analysis.

Data retention
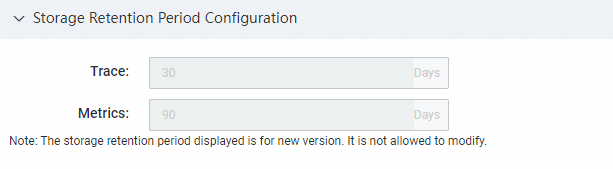
Managed Service for OpenTelemetry stores data for fixed retention periods. These periods are not configurable.
| Data type | Retention period |
|---|---|
| Traces | 30 days |
| Metrics | 90 days |
Charges are based on the volume of observable data written, not on storage duration. To stop incurring data ingestion charges for a region, set Capture Data to Disable All.