Trace Explorer lets you query and analyze the stored full trace data in real time. Combine filters and aggregation dimensions to diagnose performance bottlenecks, identify failing spans, and understand request flows across microservices.
Prerequisites
Before you begin, make sure that you have:
Application data reported to Managed Service for OpenTelemetry. For setup instructions, see Integrate services or components
Open Trace Explorer
Log on to the Managed Service for OpenTelemetry console.
In the left-side navigation pane, click Trace Explorer.
In the top navigation bar, select a region.
In the upper-right corner, select a time range.
Filter and query traces
Trace Explorer provides three ways to filter trace data:
Quick Filter: Filter by status, duration, application name, span name, or host address. Selected conditions appear in the search bar.
Filter panel: Click the search bar to open the drop-down filter panel. Add or modify filter conditions from the panel.
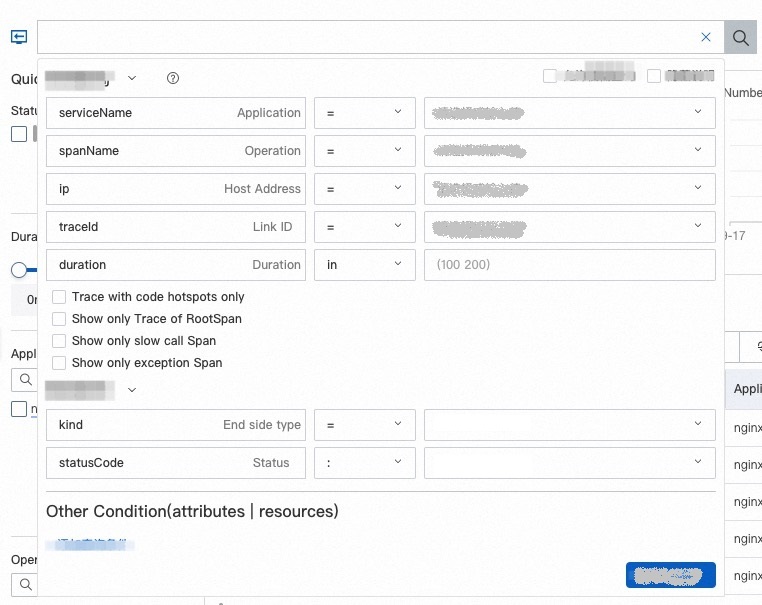
Query syntax: Enter a query statement directly in the search bar. For syntax details, see Usage methods of Trace Explorer.
Click the
 icon next to the Aggregation Dimension drop-down list to save your current filter conditions as a view.
Click Saved View to access all saved views, or click a specific view to load its filter conditions.
Aggregate trace data
Select an aggregation dimension from the drop-down list to group queried data. Aggregation helps you identify patterns, such as which spans consume the most time or which services produce the most errors.
View the trace list
After you apply filters, the Trace Explorer page displays column charts of call counts and HTTP errors, a time series curve of duration, and a trace list.
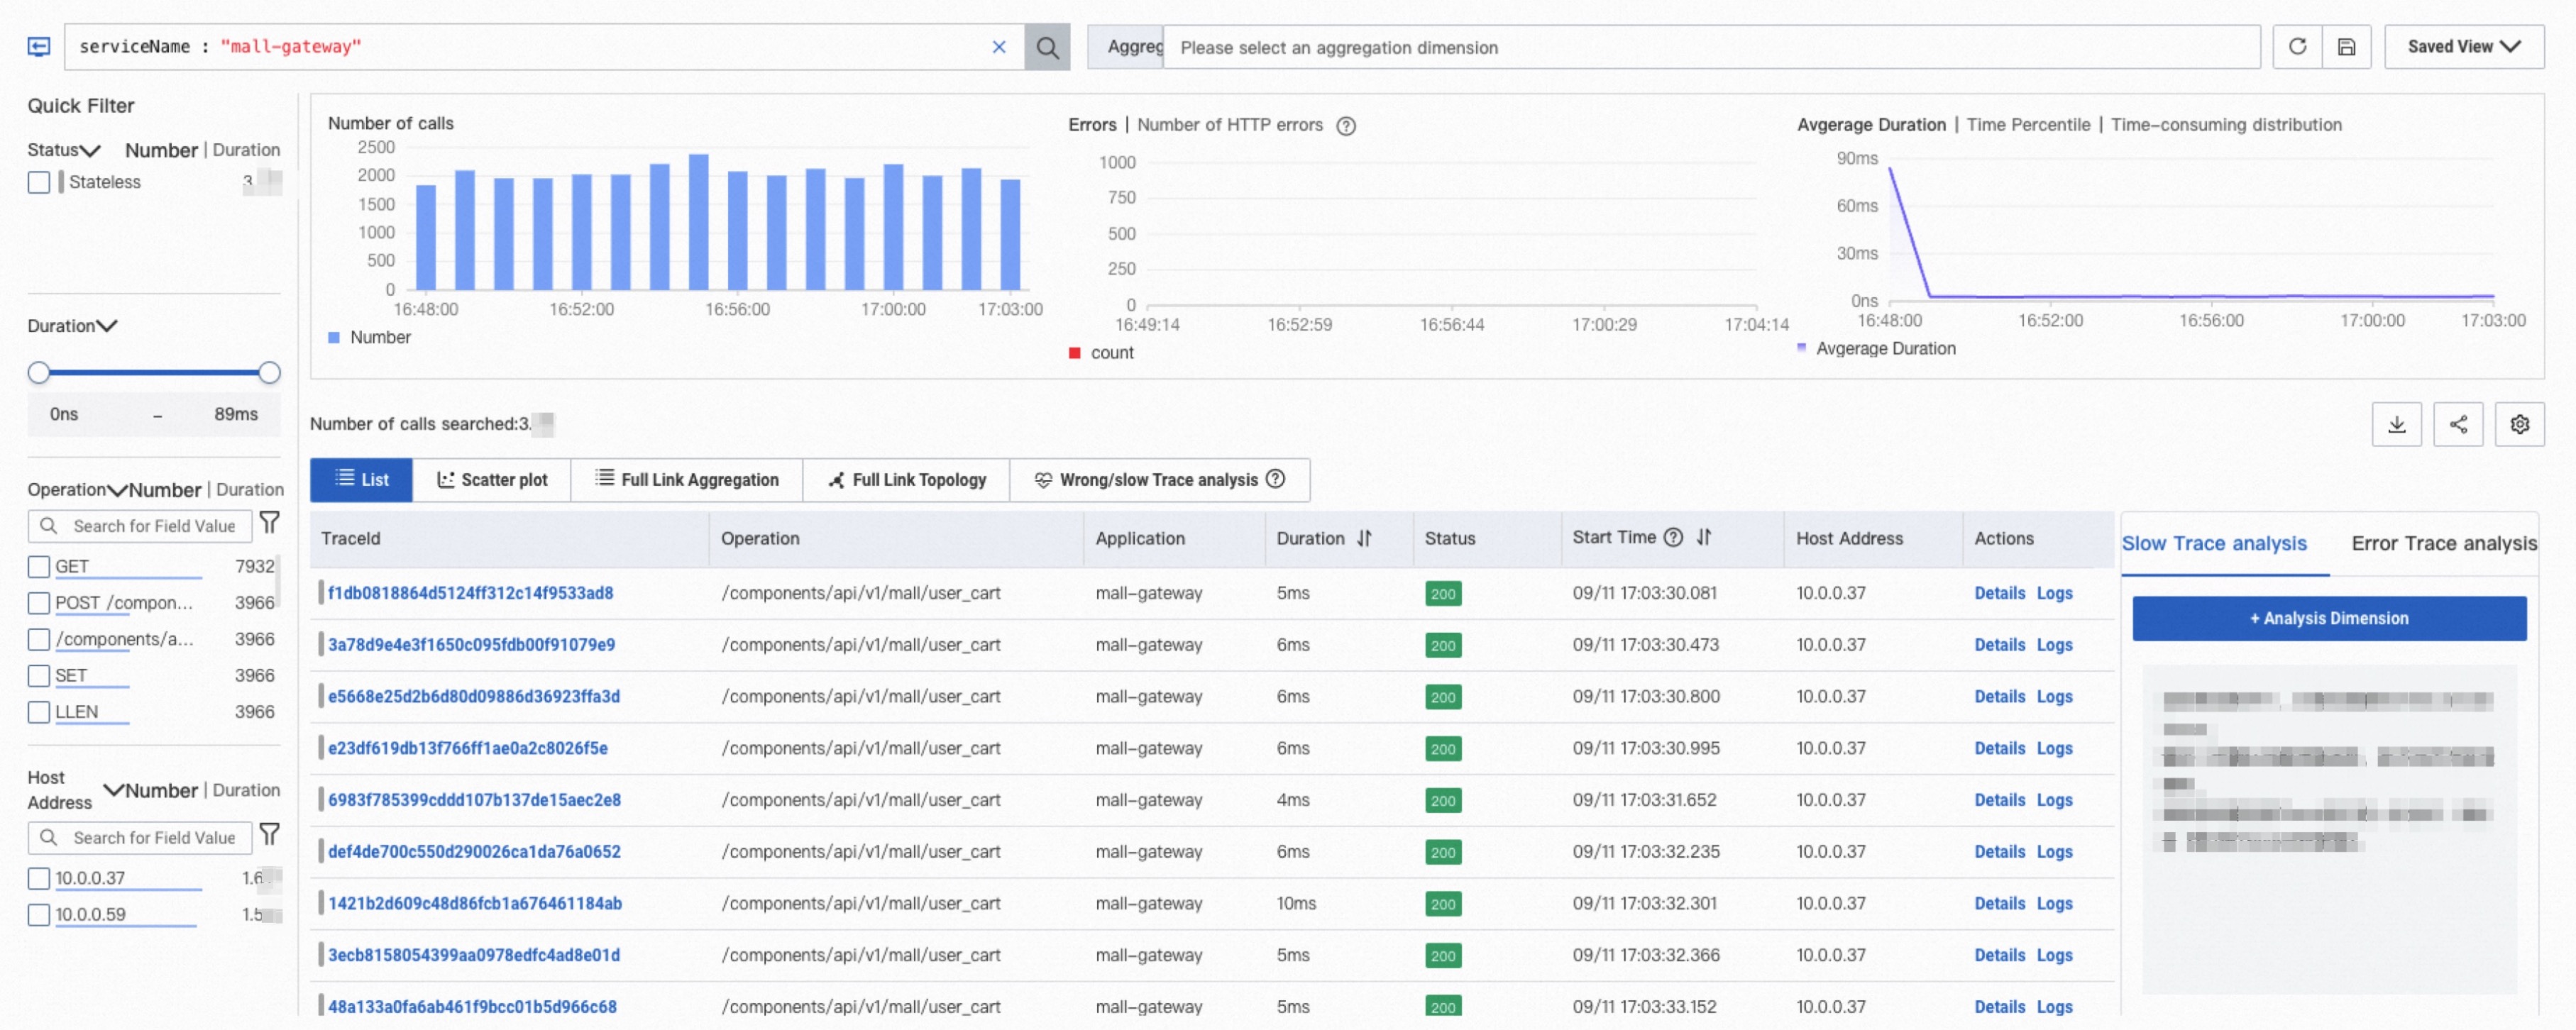
The following table describes the actions available in the trace list.
| Action | How to use |
|---|---|
| View trace details | Click a trace ID or click Details in the Actions column to view trace details and topology. See Trace details. |
| View trace logs | Click Logs in the Actions column. See Use the log analysis feature. |
| Customize columns | Click the  icon in the upper-right corner. icon in the upper-right corner. |
| Add a filter from a value | Hover over a span value and click the  icon to add that value as a filter condition. icon to add that value as a filter condition. |
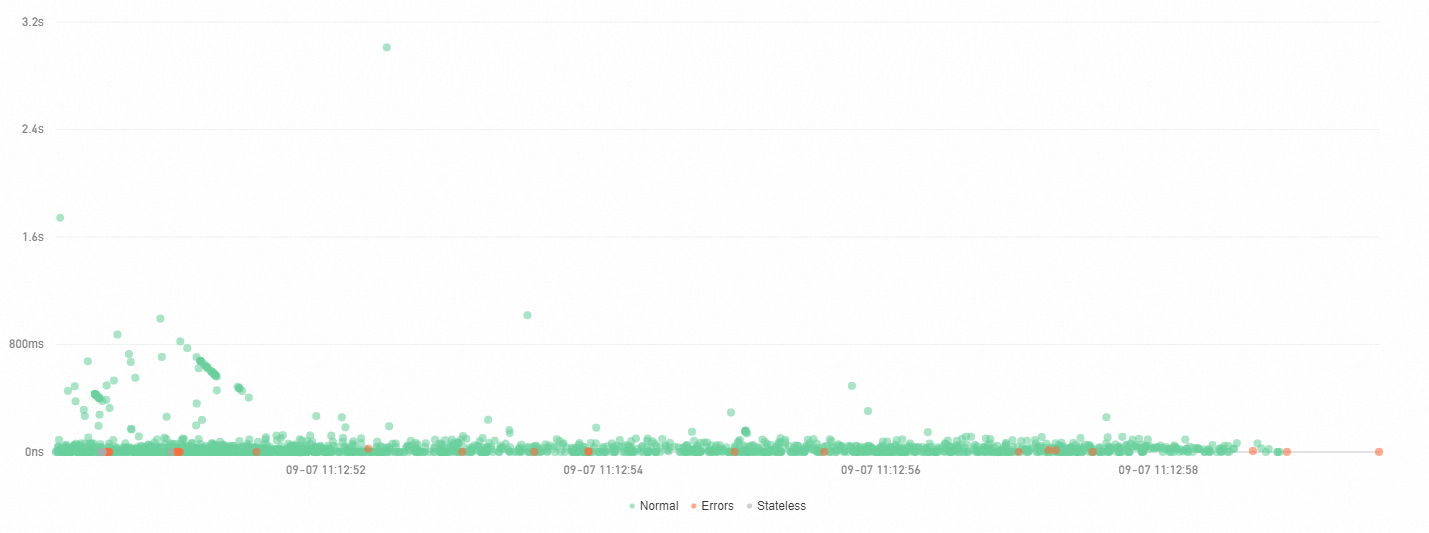
View the scatter chart
The Scatter plot tab plots each trace as a point, with time on the X axis and duration on the Y axis. Use this view to spot outliers and duration trends at a glance.
Hover over a point to view basic trace information.
Click a point to open trace details. See Trace details.
Analyze trace aggregation
Trace Explorer allows you to analyze queried spans based on various dimensions. For traces that consist of a large number of spans, the trace aggregation feature queries up to 5,000 distributed traces, retrieves their spans by trace ID, and aggregates the results. Trace integrity is preserved throughout this process.
When multiple query conditions are specified, aggregation may take longer to complete. Wait for the calculation to finish before reviewing results.
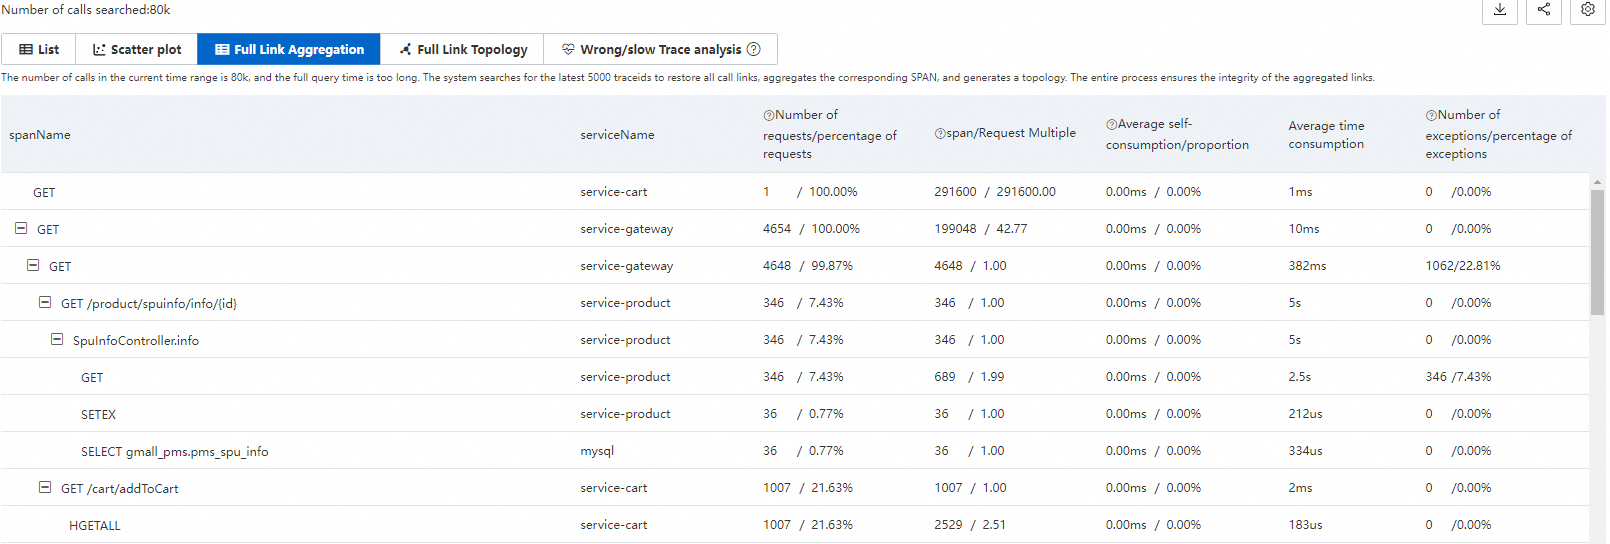
Aggregation metrics
| Metric | Description |
|---|---|
| spanName | Name of the span. |
| serviceName | Name of the application that the span belongs to. |
| Request count / request ratio | Number of requests that call this span, and its percentage of total requests. Formula: requests calling this span / total requests x 100%. |
| Span count / request multiple | Average number of times each request calls this span. Formula: total span count / request count. |
| Average self-time / proportion | Average time spent in the span itself, excluding child spans. Formula: total span time - time in all child spans. For asynchronous calls, self-time equals total span time. |
| Average duration | Average end-to-end duration of the span. |
| Exception count / exception ratio | Number of requests with exceptions and their percentage of total requests. Formula: requests with exceptions / total requests. When the request multiple exceeds 1, a single request may produce multiple exceptions. |
Aggregation example
Consider a trace where Span A calls Span B and Span C:
| spanName | serviceName | Request count / request ratio | Span count / request multiple | Average self-time / proportion | Average duration | Exception count / exception ratio |
|---|---|---|---|---|---|---|
| A | demo | 10 / 100.00% | 10 / 1.00 | 5.00 ms / 25.00% | 20 ms | 2 / 20.00% |
| - B | demo | 4 / 40.00% | 8 / 2.00 | 16.00 ms / 100.00% | 16 ms | 2 / 50.00% |
| - C | demo | 1 / 10.00% | 1 / 1.00 | 4.00 ms / 100.00% | 4 ms | 1 / 100.00% |
How to read this data:
Request distribution: Span A is called by all 10 requests (100%). Only 4 requests reach Span B (40%), and only 1 reaches Span C (10%). The remaining requests skip Span B and C due to conditional logic or exceptions.
Span-per-request distribution: Span A has a request multiple of 1.00, meaning each request calls it once. Span B has a multiple of 2.00: each of the 4 requests that reach Span B calls it twice on average.
Self-time distribution: Span A's average self-time is 5.00 ms, which accounts for only 25% of its total 20 ms duration. The remaining 75% is spent in child spans (B and C). Both Span B and Span C show 100% self-time because they have no child spans.
Exception distribution: Span A has 2 exceptions across 10 requests (20% exception ratio). Span B also has 2 exceptions, but across only 4 requests (50% exception ratio). Since each request calls Span B twice, the likely distribution is: 2 out of 4 requests encounter an exception on the first call, while the second call succeeds.
To view a specific trace, hover over a blue span name and click the recommended trace ID.
View trace topology
The Full Link Topology tab shows inter-application call relationships for the aggregated traces. Each application node displays the request count, error count, and response time.

Diagnose slow and failed traces
Trace Explorer analyzes slow and failed traces to help you identify root causes. Instead of manually inspecting individual traces, use the analysis features to find common patterns across problematic traces -- for example, whether failures concentrate on a specific host or interface.
Query traces by host, interface, or a combination of conditions. Example: serviceName="arms-demo" AND ip="192.168.1.1".
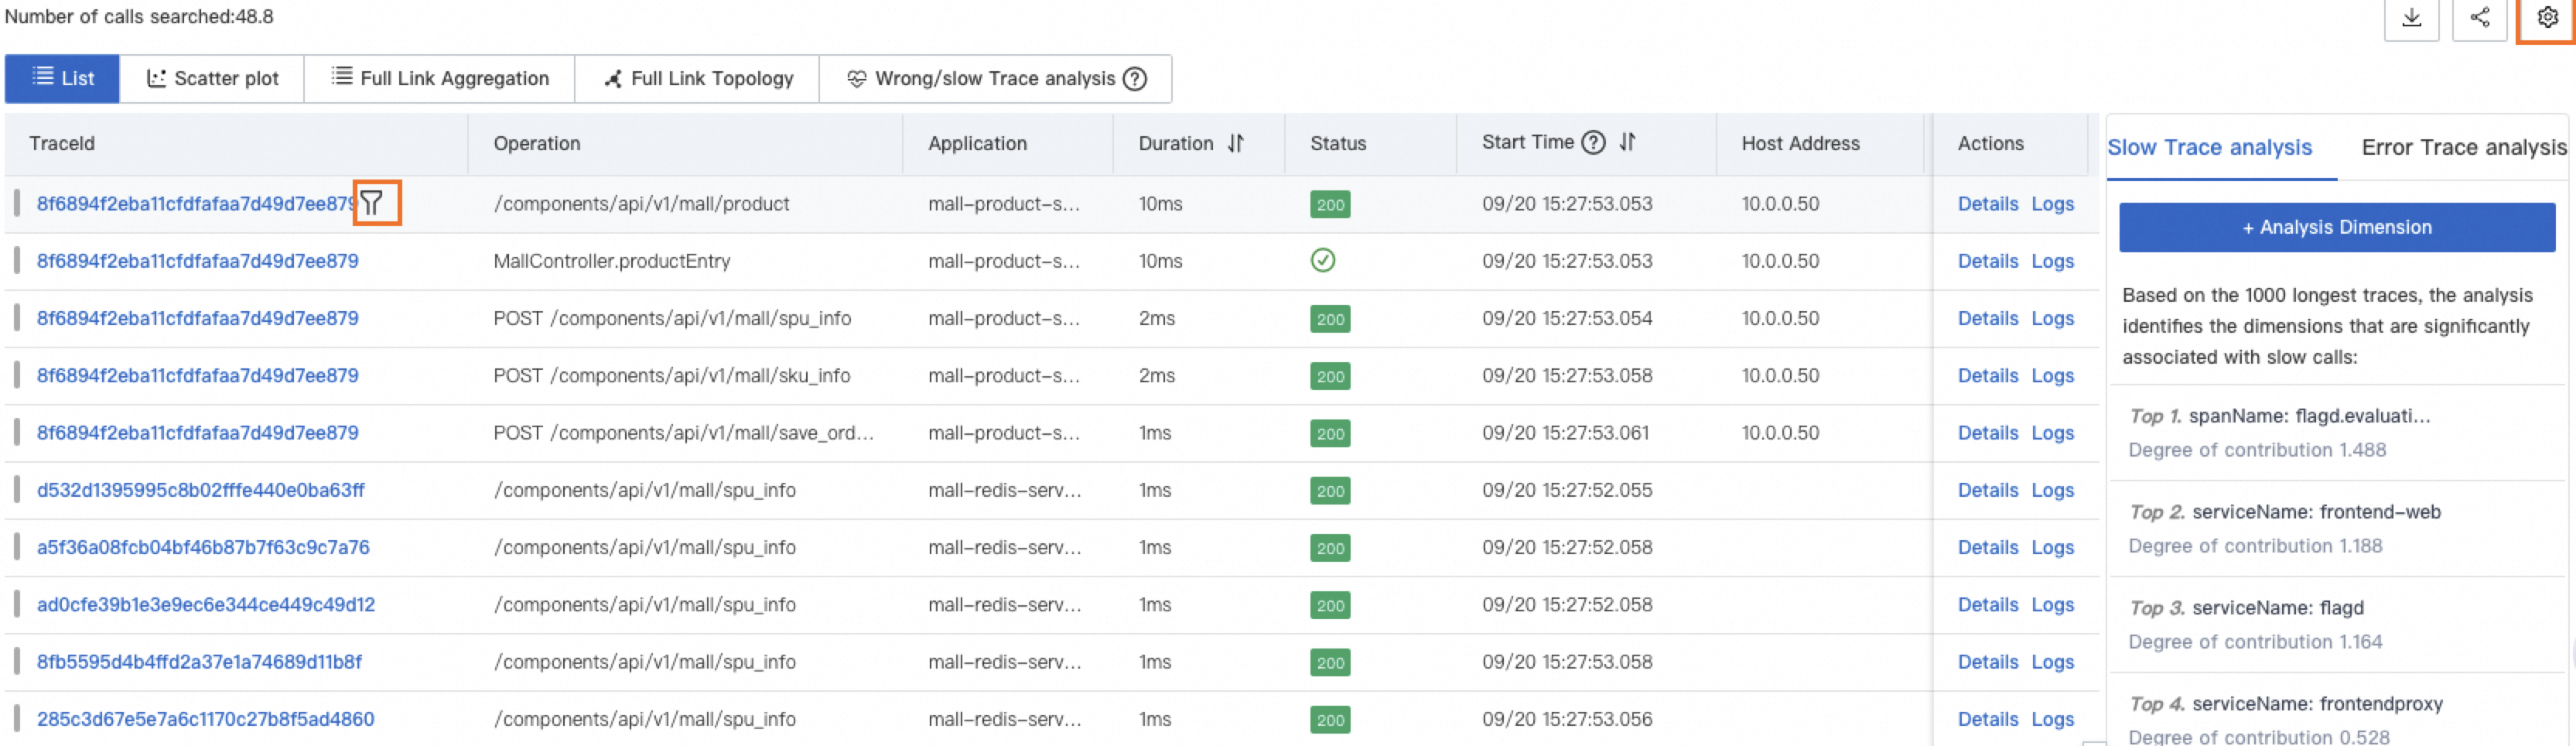
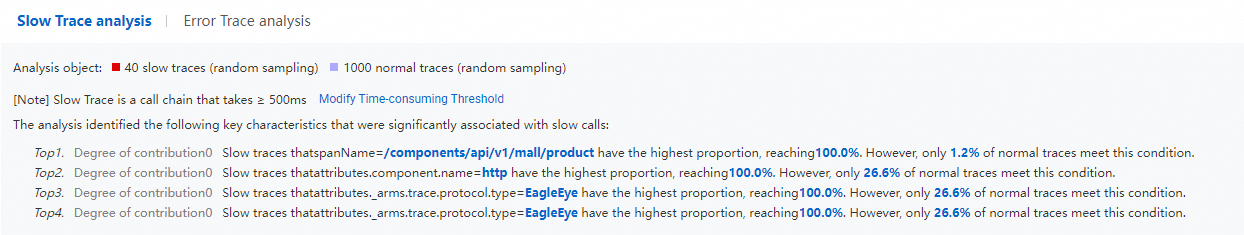
Slow trace analysis
ARMS selects the 1,000 traces with the longest duration and identifies the five dimensions most correlated with slowness.

Slow trace details
ARMS selects the 1,000 longest traces above the configured threshold, samples 1,000 traces below the threshold, compares the two groups, and surfaces the three characteristics most correlated with slow calls.
Set the threshold based on your business requirements. For example, to analyze traces that take longer than 1 minute, set the threshold to 60,000 milliseconds.
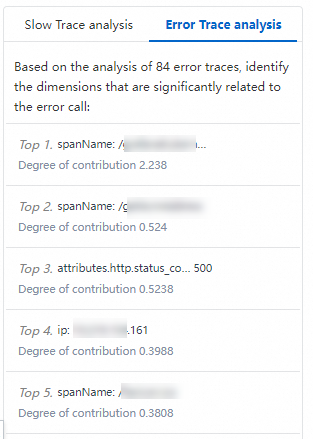
Failed trace analysis
ARMS randomly samples 1,000 failed traces and identifies the five dimensions most correlated with failures.
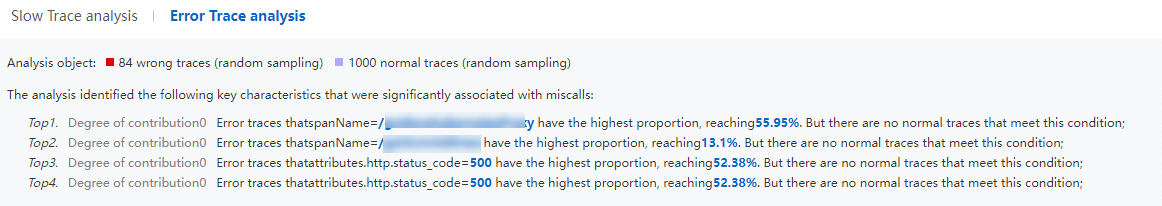
Failed trace details
ARMS compares failed traces with normal traces and surfaces the three characteristics most correlated with failures.
Trace details
Click a trace ID from the trace list or scatter chart to open the trace details view. The trace details view contains four sections: component tags, trace bar chart, trace waterfall, and span details.

Component tags
The tags at the top of the trace details view show call types and span counts. Each tag corresponds to a value of the attributes.component.name field. Click a tag to show or hide spans of that type.
Trace bar chart
The horizontal bar chart visualizes the entire trace and the distribution of spans within it.
| Element | Description |
|---|---|
| Bars | Each bar represents a span. Only spans with a duration greater than 1% of the total trace duration are displayed. |
| Colors | Different colors represent different applications. For example, blue represents the opentelemetry-demo-adservice application. |
| Black lines | Black lines within bars indicate self-time: the span's own processing time, excluding time spent in child spans. For example, if Span A takes 10 ms and its child Span B takes 8 ms, Span A's self-time is 2 ms. |
| Timeline | The timeline at the top shows the full time range of the trace. |
Trace focus and filtering
Each row represents a span and shows the parent-child hierarchy. A number before each parent span indicates how many child spans it contains.
| Action | How to use |
|---|---|
| Collapse / expand | Click the  icon to collapse or expand a span's children. icon to collapse or expand a span's children. |
| Focus | Select a span and click the  icon to display only that span and its downstream spans. icon to display only that span and its downstream spans. |
| Defocus | Click the  icon to restore the full trace view. icon to restore the full trace view. |
| Filter | Enter a span name, application name, or attribute value in the search box to filter the trace down to matching spans and their path to the entry span. Clear the search box and click the Search icon to remove the filter. |
| Zoom | Click the  icon to zoom in and hide the bar chart. Click the icon to zoom in and hide the bar chart. Click the  icon to restore the bar chart. icon to restore the bar chart. |
Span details
Select a span to view its details, related metrics, logs, and exceptions.
| Tab | Description | When to use |
|---|---|---|
| Additional information | Displays the span's attributes, resources, details, and events, grouped by type. For field descriptions, see Trace Explorer parameters. | Inspect specific span attributes and event data. |
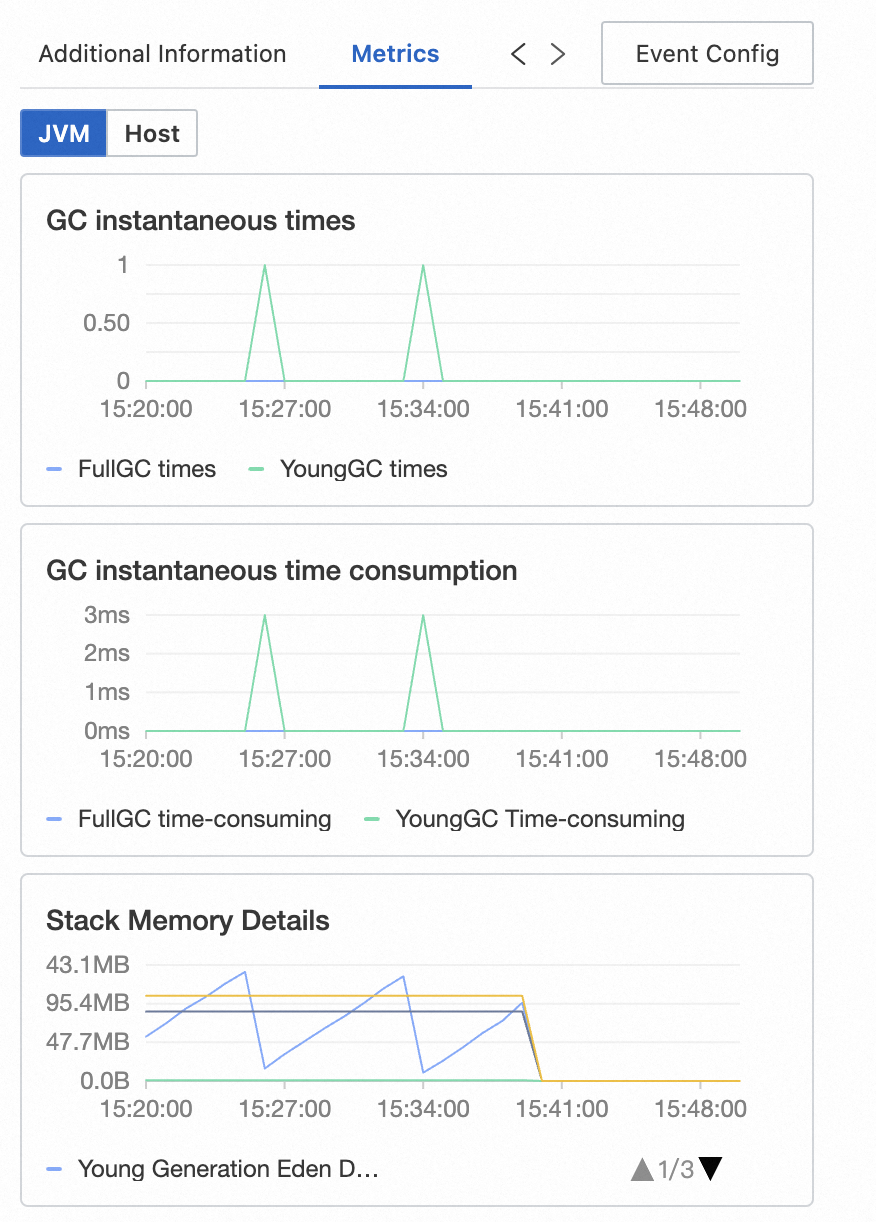
| Metrics | For Java applications monitored by ARMS: JVM and host metrics. For applications using an open-source agent: RED Method metrics (rate, errors, duration). | Correlate span performance with infrastructure metrics. |
| Logs | Displays business logs associated with the trace. If a Simple Log Service (SLS) Logstore is configured for the application, you can go to the Logstore and query the business logs based on the trace ID. | Find application-level log entries related to a trace. |
| Exceptions | Lists exception information for the selected span, if any. | Identify the root cause of span errors. |
| Event Config | Configure custom interaction events for one or more trace attributes. Use interaction events to query more details about the trace or view related logs and metrics. For configuration steps, see Configure a custom interaction event for a trace. | Create shortcuts to related details from trace data. |
What to do next
Set up alert rules to get notified when specific errors occur. Automated alerts help your operations team respond before issues affect users. For details, see Application monitoring alert rules.