Report .NET application data through Zipkin
Zipkin is an open source distributed tracing system originally developed by Twitter. It aggregates real-time monitoring data from multiple heterogeneous systems. You can use the zipkin4net library to instrument .NET applications and report trace data to Application Real-Time Monitoring Service (ARMS) Tracing Analysis.
This topic covers three instrumentation methods for .NET and C# applications.
Choose an instrumentation method
Select the method that matches your application framework.
| Method | Best for | Required NuGet packages |
|---|---|---|
| ASP.NET Core | Cross-platform web apps built on ASP.NET Core | zipkin4net.middleware.aspnetcore, zipkin4net |
| OWIN | .NET Framework web apps using OWIN middleware | zipkin4net.middleware.aspnetcore, zipkin4net |
| Manual | Background jobs, message consumers, or custom protocols that need fine-grained span control | zipkin4net |
Prerequisites
Before you begin, make sure that you have:
An Alibaba Cloud account with ARMS activated
A .NET development environment
The Zipkin endpoint for your ARMS Tracing Analysis instance (see Get a Zipkin endpoint)
Get a Zipkin endpoint
Log on to the Tracing Analysis console.
In the left-side navigation pane, click Cluster Configurations. Then, click the Access point information tab.
In the top navigation bar, select a region. In the Cluster Information section, turn on Show Token.
In the Client section, click Jaeger or Zipkin.
In the Related Information column, copy the endpoint URL.
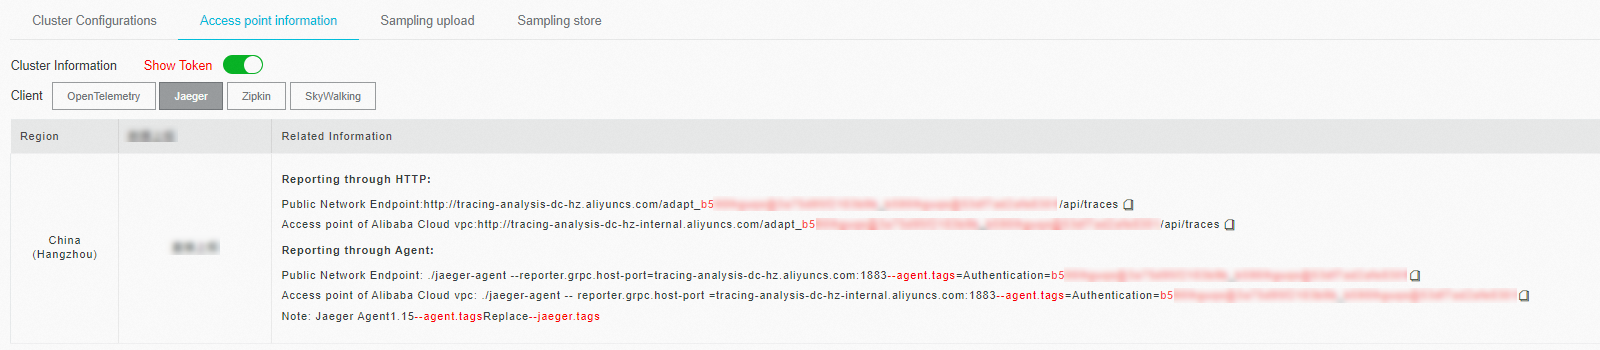
If your application runs in an Alibaba Cloud production environment, use a VPC access point. Otherwise, use a public endpoint. Use the v2 endpoint unless you have a specific reason to use v1.
Instrument with ASP.NET Core
Download the complete demo project and follow the instructions in its README.md.
Step 1: Install NuGet packages
dotnet add package zipkin4net.middleware.aspnetcore
dotnet add package zipkin4net| Package | Purpose |
|---|---|
zipkin4net | Core tracing library. Creates spans, manages sampling, and reports trace data to a Zipkin-compatible backend. |
zipkin4net.middleware.aspnetcore | ASP.NET Core middleware. Automatically creates a server span for each incoming HTTP request. |
Step 2: Register and start the tracer
Add the following code to your application startup logic to configure zipkin4net and connect it to your ARMS Tracing Analysis endpoint.
lifetime.ApplicationStarted.Register(() => {
    TraceManager.SamplingRate = 1.0f;
    var logger = new TracingLogger(loggerFactory, "zipkin4net");

    // Replace with your Zipkin endpoint from the Tracing Analysis console.
    // Do not append /api/v2/spans to the URL.
    var httpSender = new HttpZipkinSender("<your-zipkin-endpoint>", "application/json");

    var tracer = new ZipkinTracer(httpSender, new JSONSpanSerializer());
    TraceManager.RegisterTracer(tracer);
    TraceManager.Start(logger);
});
lifetime.ApplicationStopped.Register(() => TraceManager.Stop());
app.UseTracing(applicationName);
Replace the following placeholder with your actual value:
| Placeholder | Description | Example |
|---|---|---|
<your-zipkin-endpoint> | Zipkin endpoint from the Tracing Analysis console | http://tracing-analysis-dc-hz.aliyuncs.com/adapt_your_token |
Step 3: Trace outgoing HTTP requests
Add TracingHandler to your HttpClient pipeline so that outgoing HTTP calls are automatically traced and correlated with the parent span.
public override void ConfigureServices(IServiceCollection services)
{
    services.AddHttpClient("Tracer").AddHttpMessageHandler(provider =>
        TracingHandler.WithoutInnerHandler(provider.GetService<IConfiguration>()["applicationName"]));
}
Instrument with OWIN
Open Web Interface for .NET (OWIN) is a middleware specification for .NET Framework web applications.
Download the complete demo project and follow the instructions in its README.md.
Step 1: Install NuGet packages
dotnet add package zipkin4net.middleware.aspnetcore
dotnet add package zipkin4net| Package | Purpose |
|---|---|
zipkin4net | Core tracing library. |
zipkin4net.middleware.aspnetcore | ASP.NET Core middleware. Automatically creates a server span for each incoming HTTP request. |
Step 2: Register and start the tracer
// Configure tracing.
TraceManager.SamplingRate = 1.0f;
var logger = new ConsoleLogger();

// Replace with your Zipkin endpoint from the Tracing Analysis console.
// Do not append /api/v2/spans to the URL.
var httpSender = new HttpZipkinSender("<your-zipkin-endpoint>", "application/json");

var tracer = new ZipkinTracer(httpSender, new JSONSpanSerializer());
TraceManager.RegisterTracer(tracer);
TraceManager.Start(logger);

// Stop TraceManager when the application shuts down.
var properties = new AppProperties(appBuilder.Properties);
var token = properties.OnAppDisposing;

if (token != CancellationToken.None)
{
    token.Register(() =>
    {
        TraceManager.Stop();
    });
}

// Register OWIN middleware.
appBuilder.UseZipkinTracer(System.Configuration.ConfigurationManager.AppSettings["applicationName"]);
Step 3: Trace outgoing HTTP requests
Wrap your HttpClient with TracingHandler to propagate trace context across service boundaries.
using (var httpClient = new HttpClient(new TracingHandler(applicationName)))
{
    var response = await httpClient.GetAsync(callServiceUrl);
    var content = await response.Content.ReadAsStringAsync();

    await context.Response.WriteAsync(content);
}
Instrument manually
Use manual instrumentation for full control over span creation -- for example, tracing background jobs, message consumers, or custom protocols.
Download the complete demo project and follow the instructions in its README.md.
Step 1: Install the NuGet package
Only the core tracing library is required for manual instrumentation.
dotnet add package zipkin4netStep 2: Register and start the tracer
TraceManager.SamplingRate = 1.0f;
var logger = new ConsoleLogger();

// Replace with your Zipkin endpoint from the Tracing Analysis console.
// Do not append /api/v2/spans to the URL.
var httpSender = new HttpZipkinSender("<your-zipkin-endpoint>", "application/json");

var tracer = new ZipkinTracer(httpSender, new JSONSpanSerializer());
TraceManager.RegisterTracer(tracer);
TraceManager.Start(logger);
Step 3: Create and record spans
Create a root span for each request or operation, then record its lifecycle events.
var trace = Trace.Create();

Trace.Current = trace;
trace.Record(Annotations.ClientSend());

trace.Record(Annotations.Rpc("client"));
trace.Record(Annotations.Tag("mytag", "spanFrist"));
trace.Record(Annotations.ServiceName("dotnetManual"));
// ... perform your operation here
testCall();

trace.Record(Annotations.ClientRecv());
To record a child span (for example, a downstream call within the same request), call Child() on the current trace:
var trace = Trace.Current.Child();
Trace.Current = trace;
trace.Record(Annotations.ServerRecv());
trace.Record(Annotations.Rpc("server"));
trace.Record(Annotations.Tag("mytag", "spanSecond"));
trace.Record(Annotations.ServiceName("dotnetManual"));
// ... perform your operation here
trace.Record(Annotations.ServerSend());
(Optional) Step 4: Add custom tags
Attach custom tags to spans for easier troubleshooting. For example, record the HTTP status code or flag errors.
tracer.activeSpan().setTag("http.status_code", "200");Step 5: Propagate trace context across services
In a distributed system, trace context travels with each RPC request so that spans from different services are correlated into a single trace. The zipkin4net library uses B3 propagation, passing four values through HTTP headers:
| Trace field | HTTP header |
|---|---|
| TraceId | X-B3-TraceId |
| ParentSpanId | X-B3-ParentSpanId |
| SpanId | X-B3-SpanId |
| Sampled | X-B3-Sampled |
Client Span                                                Server Span
┌──────────────────┐                                       ┌──────────────────┐
│                  │                                       │                  │
│   TraceContext   │           Http Request Headers        │   TraceContext   │
│ ┌──────────────┐ │          ┌───────────────────┐        │ ┌──────────────┐ │
│ │ TraceId      │ │          │ X-B3-TraceId      │        │ │ TraceId      │ │
│ │              │ │          │                   │        │ │              │ │
│ │ ParentSpanId │ │ Inject   │ X-B3-ParentSpanId │Extract │ │ ParentSpanId │ │
│ │              ├─┼─────────>│                   ├────────┼>│              │ │
│ │ SpanId       │ │          │ X-B3-SpanId       │        │ │ SpanId       │ │
│ │              │ │          │                   │        │ │              │ │
│ │ Sampled      │ │          │ X-B3-Sampled      │        │ │ Sampled      │ │
│ └──────────────┘ │          └───────────────────┘        │ └──────────────┘ │
│                  │                                       │                  │
└──────────────────┘                                       └──────────────────┘
Client side -- inject trace context into outgoing request headers:
_injector.Inject(clientTrace.Trace.CurrentSpan, request.Headers);Server side -- extract trace context from incoming request headers:
var traceContext = traceExtractor.Extract(context.Request.Headers);
var trace = traceContext == null ? Trace.Create() : Trace.CreateFromId(traceContext);
When no trace context exists in the incoming headers, a new root trace is created. Otherwise, the existing trace continues.
FAQ
Q: Why does no data appear in the Tracing Analysis console after I run the demo?
A: Verify that the Zipkin endpoint URL in your HttpZipkinSender configuration is correct. Copy the endpoint directly from the Tracing Analysis console. The URL must not include /api/v2/spans.
// Correct: use the base endpoint without /api/v2/spans
var httpSender = new HttpZipkinSender("http://tracing-analysis-dc-hz.aliyuncs.com/adapt_your_token", "application/json");