OSS provides monitoring metrics and logging to help you track application behavior, identify issues, and pinpoint root causes.
Use OSS monitoring, logging, and third-party tools to achieve the following goals:
-
Monitor OSS health and performance in real time with alert notifications.
-
Obtain effective methods and tools to locate issues.
-
Resolve OSS issues using the troubleshooting guides in this topic.
This topic covers:
-
Service monitoring: Use OSS monitoring to track service health and performance.
-
Tracking and diagnosis: Diagnose issues by correlating monitoring data and log files.
-
Troubleshooting: Common problem scenarios and resolution methods.
Service monitoring
-
Monitor overall health
-
Availability and valid request rate
Availability and valid request rate measure system stability and user activity. A rate below 100% indicates failed requests.
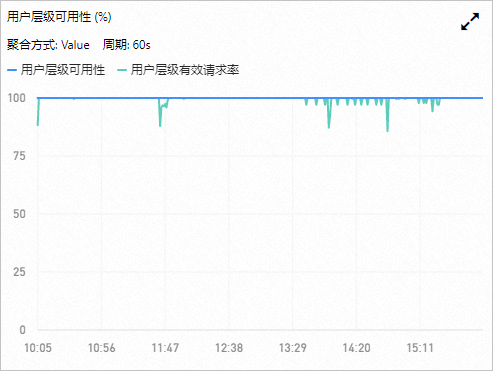
The rate may temporarily drop below 100% during system optimizations such as partition migration. The OSS SDK retry mechanism handles these intermittent failures automatically.
If the rate is below 100%, check request distribution statistics or request status details to identify error types and causes.
A rate below 100% is expected in some scenarios. For example, checking whether an object exists returns a 404 error if the object is not found.
Set alert rules to trigger notifications when the rate falls below your threshold.
-
Total requests and valid requests
This metric reflects system status by total access volume. A mismatch between valid and total requests indicates failures.
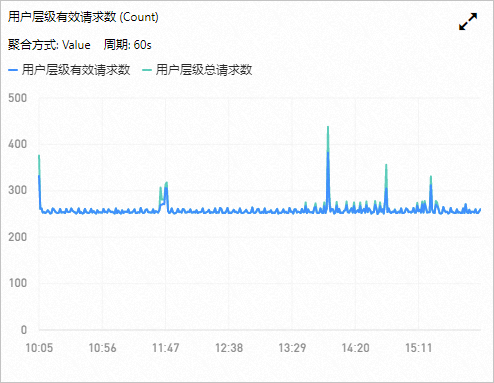
Monitor fluctuations in request counts, especially sudden spikes or drops. Set alert rules in the Alert service user guide for timely notifications.
-
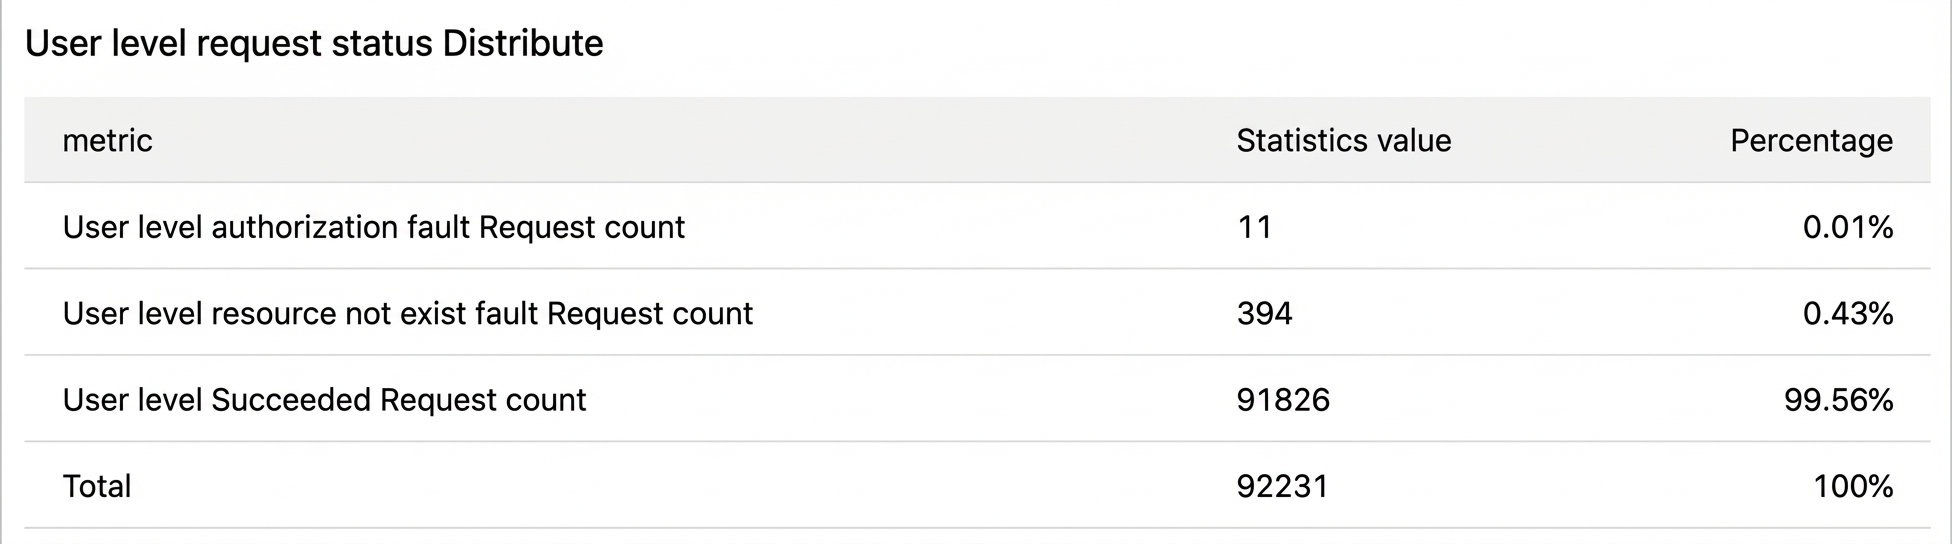
Request status distribution statistics
When availability or the valid request rate is below 100% (or when valid requests do not equal total requests), view the request status distribution to determine error types. OSS monitoring metrics reference.
-
-
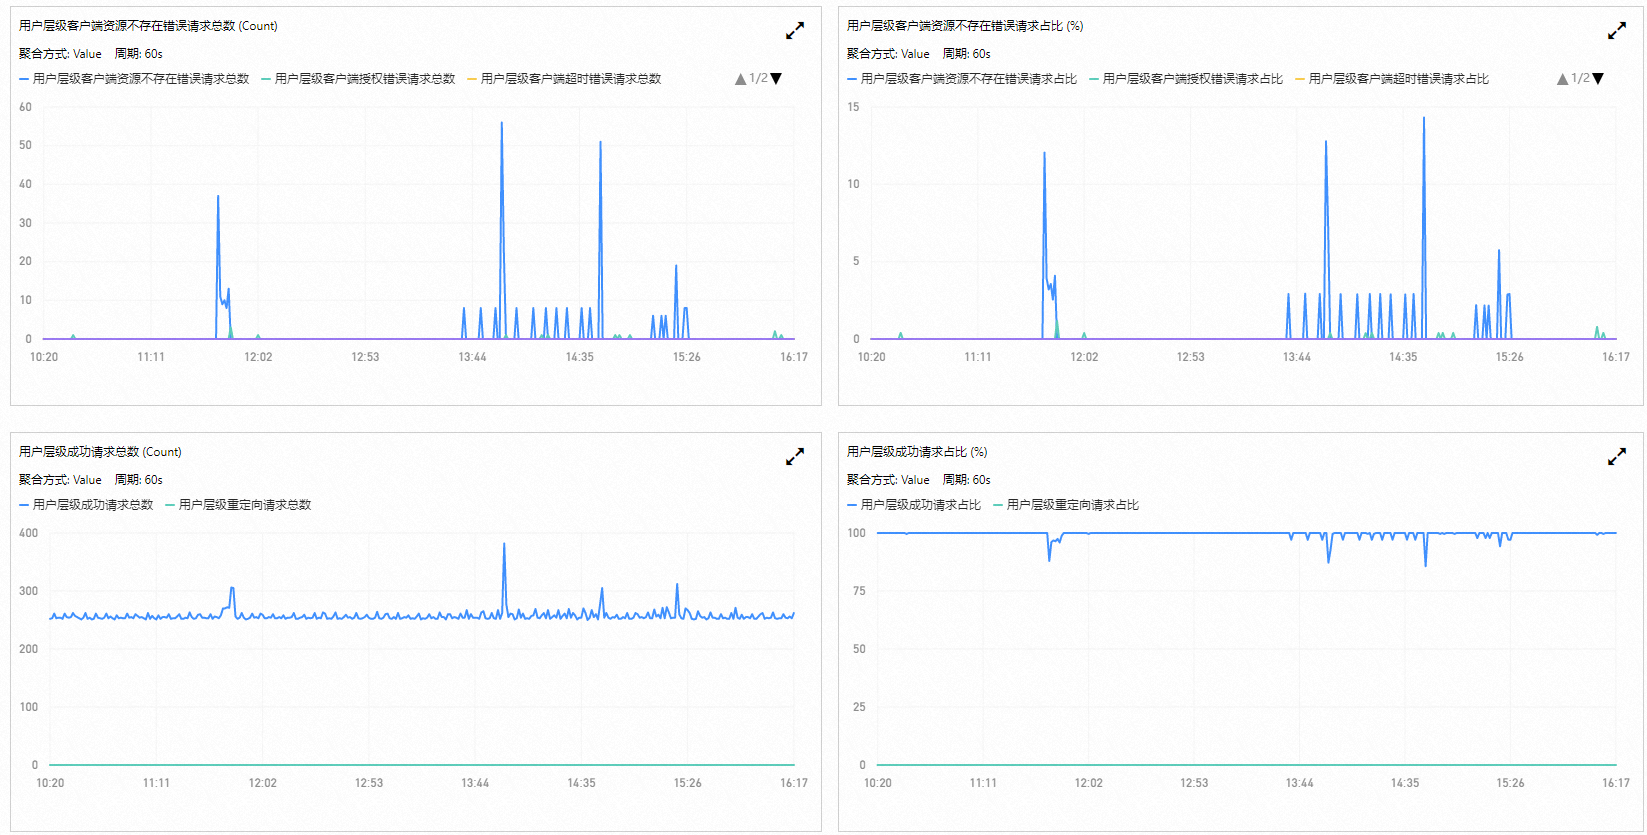
Monitor request status details
Request status details provide a more granular view than distribution statistics, letting you monitor specific request types in depth.
-
Monitor performance
The monitoring service provides the following performance metrics:
-
Average latency, including average end-to-end (E2E) latency and average server latency
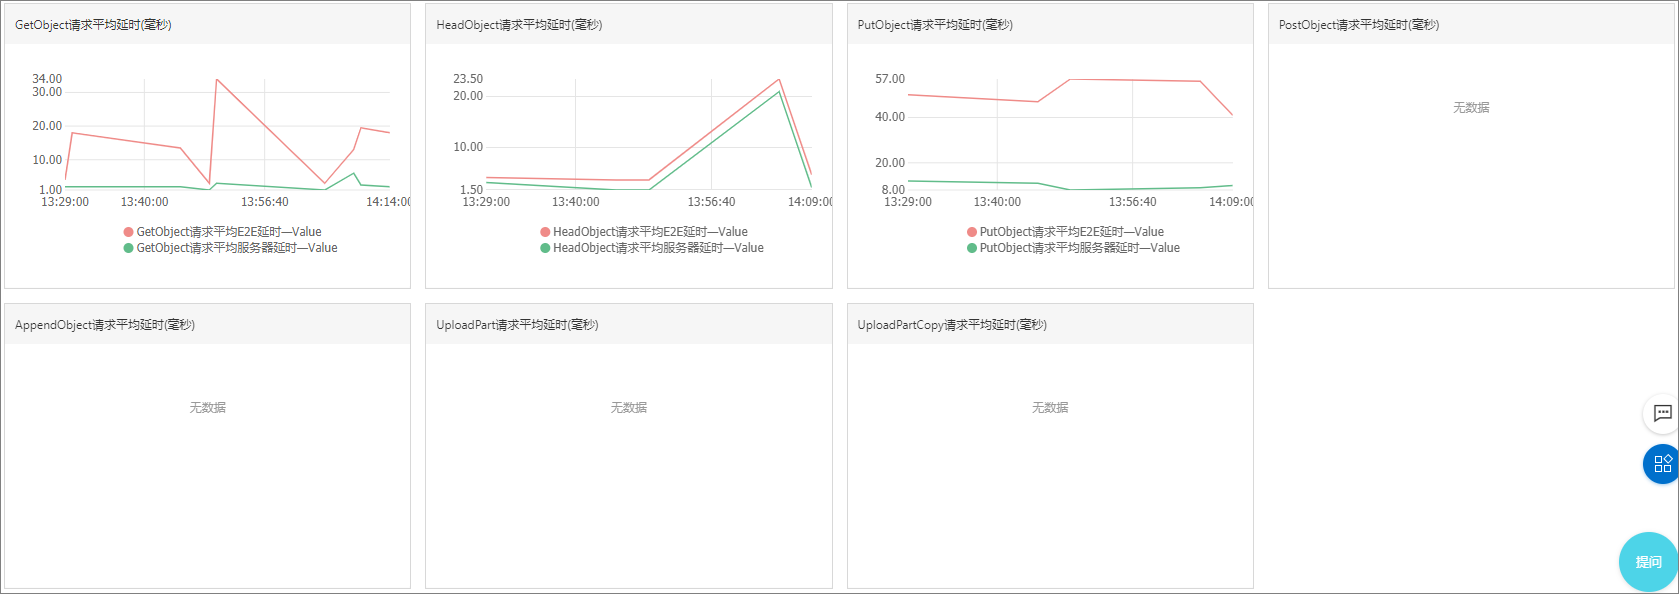
E2E latency includes request processing, response transmission, and network time. Server latency covers only server-side processing. If E2E latency spikes but server latency stays stable, the issue is likely network-related rather than an OSS system failure.
-
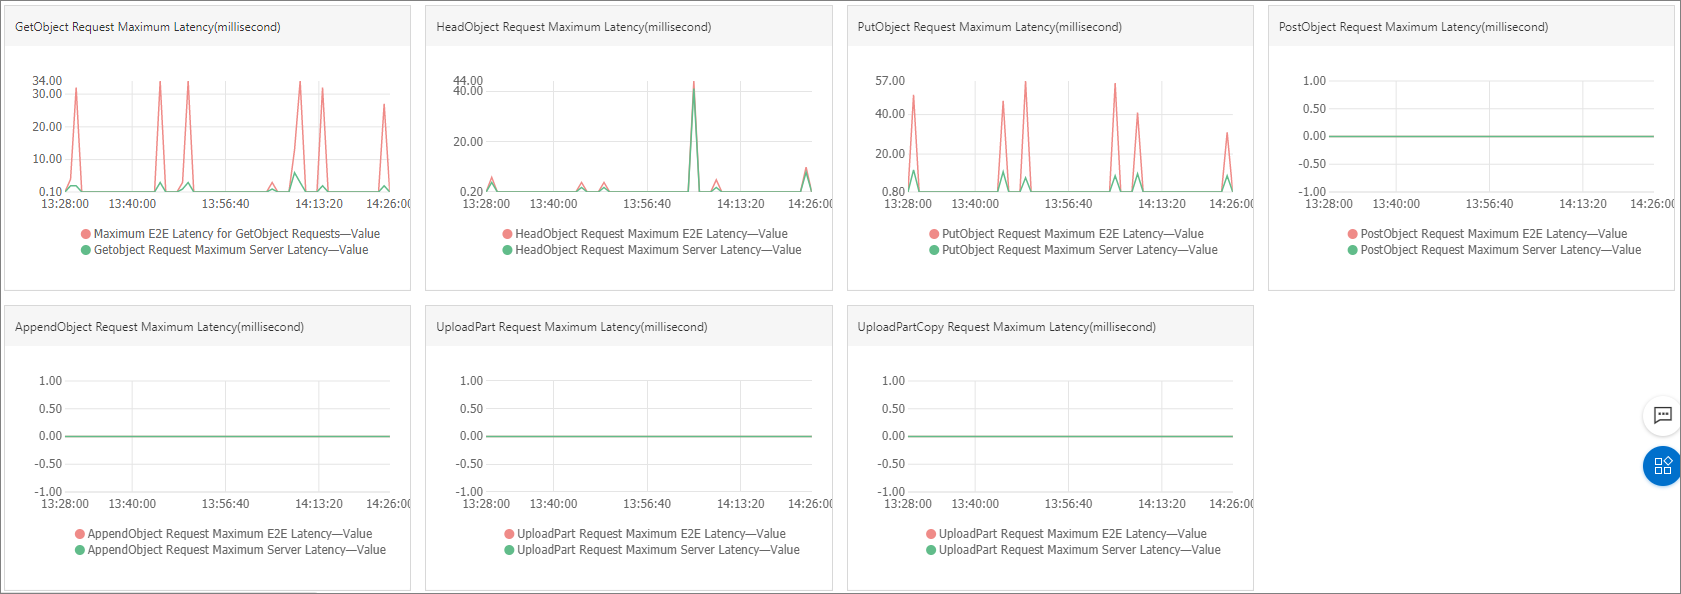
Maximum latency, including maximum E2E latency and maximum server latency

-
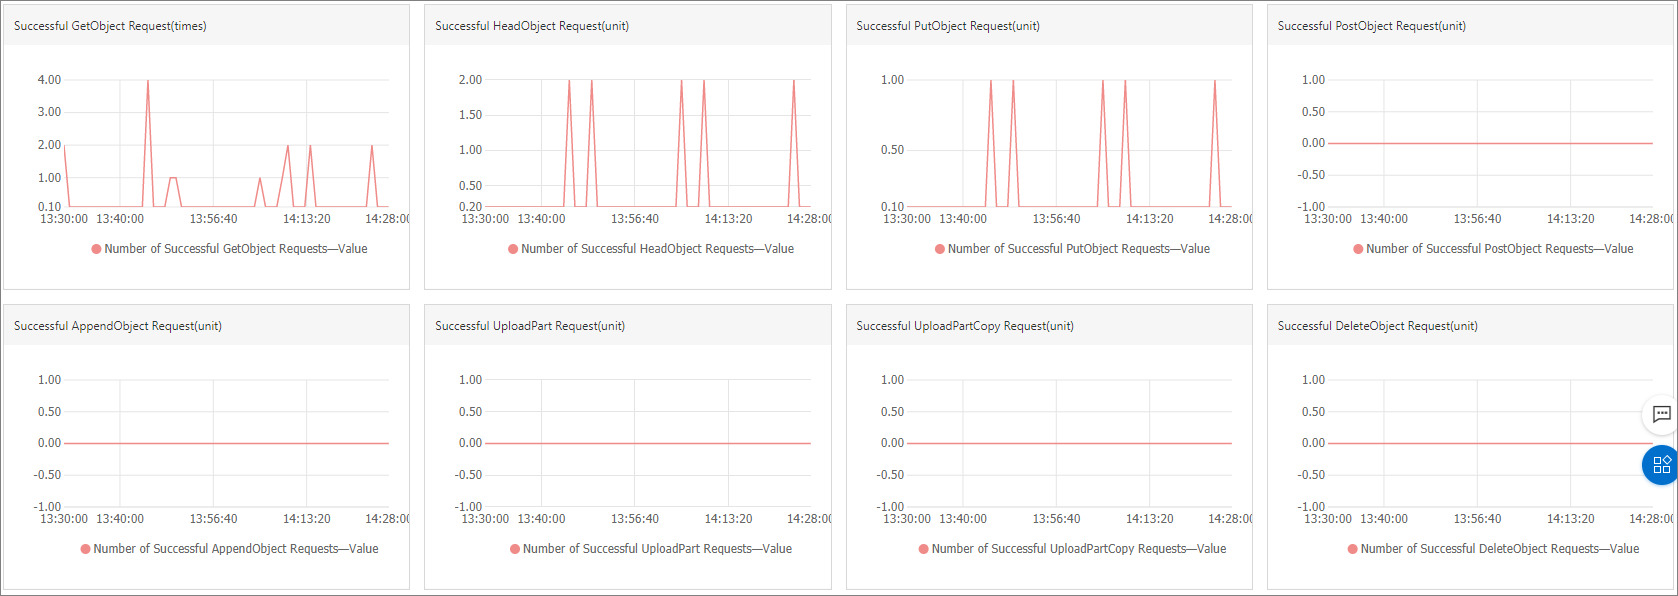
Successful request operation classification
-
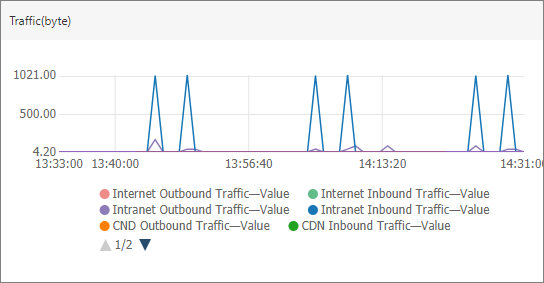
Traffic
Traffic metrics show network resource usage at the user or bucket level across public network, private network, CDN back-to-origin, and cross-region replication scenarios.
All metrics except traffic are categorized by API operation type:
-
GetObject
-
HeadObject
-
PutObject
-
PostObject
-
AppendObject
-
UploadPart
-
UploadPartCopy
Successful request operation classification also monitors request counts for:
-
DeleteObject
-
DeleteObjects
Watch for sudden changes in performance metrics, such as latency spikes or sustained deviations from the baseline. Set alert rules to notify personnel when metrics exceed thresholds.
-
-
Monitor metering
Currently, OSS monitoring supports metering for bucket size, public outbound traffic, Put-like requests, and Get-like requests. Cross-region replication outbound traffic, CDN outbound traffic, alert rules, and OpenAPI-based metering retrieval are not supported.
OSS collects metering data at hourly granularity. Use the bucket monitoring view to analyze resource usage trends and estimate costs.
OSS also provides monthly resource consumption statistics at both the user and bucket levels, updated hourly.
OSS billable items and billing methods are described in Metering and billable items.
NoteMetering data in the monitoring service is best-effort and may differ from your actual bill. Check the User Center for accurate billing information.

Tracking and diagnosis
-
Diagnose issues
-
Diagnose performance
Establish a performance baseline for your business scenario. Performance issues can stem from OSS service load, client TCP configuration, or network bottlenecks. Use monitoring metrics to identify root causes, then check logs for details.
In summary: set a baseline, use monitoring metrics to narrow the cause, then examine logs for details.
-
Diagnose errors
When a request fails, the client receives an error message and the monitoring service records the error type. Check server-side, client-side, and network logs for details. HTTP status codes and OSS error codes indicate the failure reason.
Error response details are documented in OSS error responses.
-
Use the logging feature
OSS provides server-side logging to record detailed request logs.
Enable this feature by following Configure logging and Configure access logging.
-
Use network logging tools
When server-side logs lack detail, capture client-server traffic with network logging tools. You can also use Simple Log Service to investigate. Wireshark is a common tool for viewing packet-level protocol data. Install Wireshark. Use Wireshark.
-
-
E2E tracking and diagnosis
Correlate client, network, and server-side logs to identify root causes. OSS assigns a unique RequestID to each request for log correlation. Use timestamps to narrow the log scope and identify related events.
-
RequestID
The RequestID appears in different log fields:
-
In OSS server-side logs, the RequestID is in the "Request ID" column.
-
In network traces (such as data streams captured by Wireshark), the RequestID appears as the value of the x-oss-request-id header in the response message.
-
In the latest version of the Java SDK, call getRequestId on the Result object for successful requests, or on OSSException for failed requests.
-
-
Timestamp
When searching server-side logs by client-side timestamps, add or subtract 15 minutes to account for potential time drift.
-
Troubleshooting
-
Common performance issues
-
High average end-to-end (E2E) latency with low average server latency
Possible causes include the following:
-
Slow client application response
-
A limited number of available connections or threads
-
You can use relevant commands to check the system connection status and adjust kernel parameters.
-
You can check for client-side resource bottlenecks, increase the number of concurrent threads as needed, and optimize the client code.
-
-
Insufficient resources, such as CPU, memory, or network bandwidth
You can use a resource monitoring tool to check for resource bottlenecks. You can also optimize the code or scale out resources.
-
-
Network issues
You can use Wireshark to investigate network issues.
-
-
Low average E2E latency and low average server latency, but high client request latency
High client-side latency usually indicates a delay before the request reaches the server. Investigate why the request is delayed.
Possible causes:
-
A limited number of available connections or threads
-
You can check the system connection status and adjust kernel parameters.
-
You can check for client-side resource bottlenecks, increase the number of concurrent threads as needed, and optimize the client code.
-
-
The client request is retried multiple times
You can check the client logs to investigate the reason for the retries. You can also use Wireshark to investigate network issues.
-
You can check the client logs. Detailed logs indicate whether a retry has occurred. For example, in the OSS Java SDK, you can search for the following log messages at the WARN or INFO level. The existence of these logs indicates that a retry may have occurred.
[Server]Unable to execute HTTP request: or [Client]Unable to execute HTTP request: -
If the client log level is set to DEBUG, you can search for the following log message in the OSS Java SDK. If this log message exists, a retry has occurred.
Retrying on
-
-
-
High average server latency
Possible causes of high server latency for uploads or downloads:
-
Many clients frequently access the same small object
Check server-side logs and consider enabling CDN or adjusting access permissions.
-
Internal system factors
Provide client logs and contact technical support for assistance.
-
-
-
Server-side errors
-
Temporary increases
You can adjust the client retry policy and use a reasonable backoff mechanism.
-
Permanent increase in errors
You can provide the client logs and contact technical support for assistance.
-
-
Network errors
A network error (HTTP 499) occurs when the client terminates the connection before the server returns a response. Common causes:
-
The server detects an inactive connection before processing the request.
-
The client closes the connection while the server is still processing the request.
If the client actively closes the connection, investigate the client-side code. If the network connection is lost, use Wireshark to diagnose connectivity issues.
-
-
Client-side errors
-
Increase in client authorization error requests
Common causes of increased 403 errors:
-
Incorrect bucket domain name
-
If you access the bucket directly using a third-level or second-level domain name, the bucket may not be in the region indicated by that domain name. For example, a bucket in the China (Hangzhou) region accessed via Bucket.oss-cn-shanghai.aliyuncs.com. Verify the bucket region and correct the domain name.
-
If CDN acceleration is enabled, verify that the CDN origin domain matches your bucket's third-level domain name.
-
A 403 error from a JavaScript client typically indicates a CORS configuration issue. Check your bucket's CORS settings and correct them as needed. Cross-origin resource sharing.
-
-
Access control issues
-
When using a primary AccessKey, verify that it is correctly configured and valid.
-
For RAM user access, verify that the correct AccessKey is used and the user has permissions for the required operations.
-
For STS temporary token access, verify that the token has not expired. Request a new token if needed.
-
If access control is configured, verify that you have the required permissions for the target bucket or object.
-
-
URL expiration
For signed URL access, a sudden 403 error typically means the URL has expired.
-
OSS developer tools (OSS FTP, ossbrowser, OSS console client) may return 403 errors for RAM users. Verify that the AccessKey is correct and the RAM user has GetService and other required permissions.
-
-
Increase in client "resource not found" error requests
A 404 error indicates the requested resource does not exist. Common causes of increased 404 errors:
-
Application logic that checks object existence (for example, doesObjectExist in the Java SDK) generates a `false` return value when the object is not found, but the server generates a 404 request. This is expected behavior.
-
The object was deleted by the client or another process. Check server-side logs for delete operations on the object.
-
Network packet loss triggers a retry. For example, a successful delete response is lost, causing the client to retry and receive a 404 error. Identify network-caused 404 errors by checking both client and server logs:
-
Check the client application logs for retry requests.
-
Check the server-side logs to determine whether two delete operations exist for the object and the first delete operation returned an HTTP status code in the 2xx range.
-
-
-
Low valid request rate and high number of other client error requests
The valid request rate is the ratio of 2xx/3xx responses to total requests. "Other client errors" exclude 5xx (server), 499 (network), 403 (authorization), 404 (not found), and 408 or 400 with OSS error code RequestTimeout (timeout) errors.
Check server-side logs to identify error types, then use OSS error responses to determine causes and resolve issues.
-
-
Abnormal increase in storage capacity
If storage capacity increases abnormally without a corresponding increase in uploads, the issue is typically cleanup-related. Investigate from two aspects:
-
The client application uses a periodic cleanup process. To investigate:
-
Check whether the valid request rate has decreased, which may indicate failed delete requests preventing cleanup.
-
Check error request types to identify the cause. For example, the STS token used for cleanup may have expired.
-
-
Lifecycle rules handle automated cleanup. Verify that bucket lifecycle rules are configured as expected via the console or API. Check server-side logs for modification details. If rules are correct but not applied, contact the OSS system administrator.
-
-
Other storage service issues
For issues not covered above, use the following diagnostic methods:
-
Check the OSS monitoring service for deviations from baseline behavior. Determine whether the issue is temporary or permanent and which operations are affected.
-
Search server-side logs for relevant error messages using the monitoring data as guidance.
-
If server-side logs are insufficient, examine client logs or use Wireshark to investigate network issues.
-