Elastic Algorithm Service (EAS) provides stress testing for large language model (LLM) and general-purpose services to evaluate performance under load.
Feature comparison
EAS offers two stress testing types: LLM service and general-purpose service.
|
Item |
LLM service stress testing |
General-purpose service stress testing |
|
Use cases |
Optimized for large language models to evaluate response speed and token generation performance. |
Suitable for all HTTP/HTTPS-based services. |
|
Creation method |
PAI console only |
PAI console: Supports |
|
Key metrics |
Includes all general-purpose metrics plus LLM-specific metrics: time to first token (TTFT), time per output token (TPOT), and tokens per second (TPS). |
Includes metrics such as queries per second (QPS) and response time (RT). |
Prerequisites
-
Deployed and available EAS service
-
At least one EAS online service deployed in the destination region and workspace.
-
Service status is Running and can be invoked.
-
-
Requirements for LLM service stress testing
-
Service uses an OpenAI API-compatible inference engine, such as vLLM, SGLang, LMDeploy, or BladeLLM.
-
Service exposes the
/v1/completionsor/v1/chat/completionsendpoint. -
Stress testing data includes the
"stream": truefield to enable streaming requests for collecting token-related metrics such as TTFT and TPOT.
-
Quick start
This example stress-tests a Qwen3-8B LLM service using both LLM-specific and general-purpose scenarios. To deploy the model, see Deploy large language models.
This is a quick start guide. Do not perform general-purpose stress testing on LLM services in production.
Step 1: Create a stress testing task
-
Log on to the PAI console and select the destination region at the top of the page.
-
In the left-side navigation pane, click Elastic Algorithm Service (EAS), select the target workspace, and go to the EAS page.
-
Go to the Benchmark Task tab and click Create Stress Testing Task.
-
Configure the following parameters and keep defaults for the rest. Full parameter references: LLM configuration details and General-purpose scenario configuration details.
LLM service stress testing
Parameter
Description
Basic Information
Service
Select the service to test and choose LLM Service.
Service Endpoint
Select
Chat.Stress Testing URL
Auto-populated after you select a service interface.
Model ID
The model ID from ModelScope or Hugging Face. Enter
Qwen/Qwen3-8B.Stress Testing Configurations
Data Type
Select Public Dataset.
Dataset
ShareGPT.
Test Mode
Select Fixed Concurrency Test.
Number of Request Samples
200.
General-purpose service stress testing
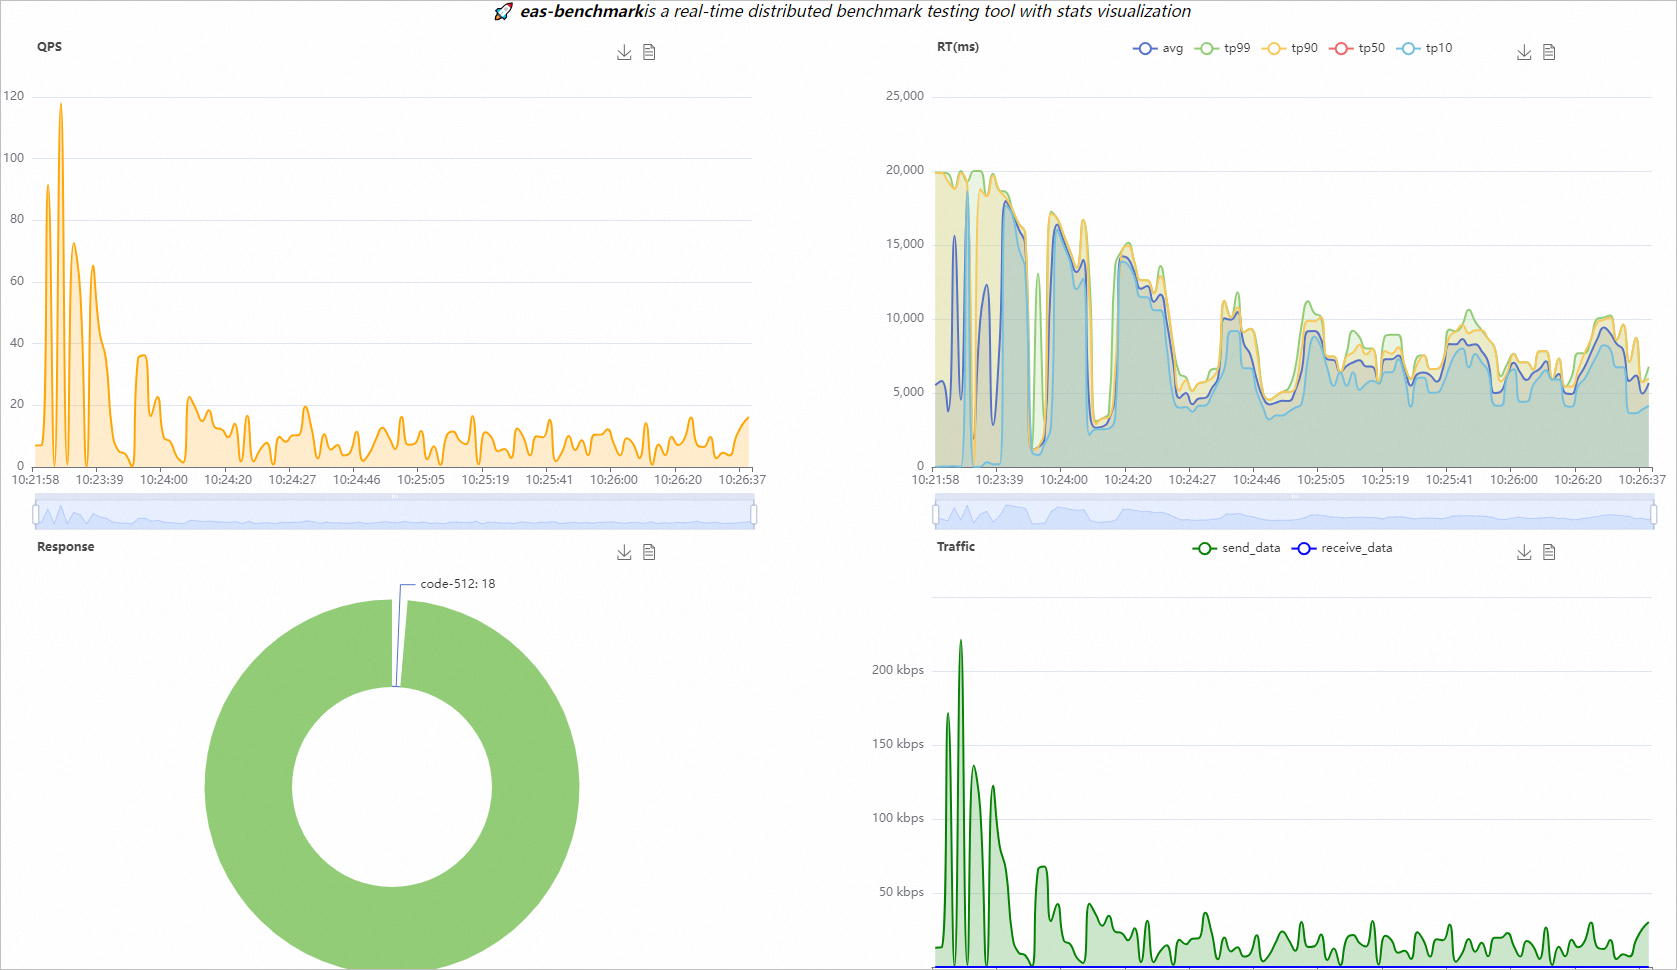
NoteThe stress testing console has a fixed request timeout of 20 seconds. If the stress testing report shows a 512 return code, this indicates a request timeout. The EAS stress testing console does not support custom timeout settings.
Parameter
Description
Basic Information
Service
The service to test.
Stress Testing URL
Service invocation URL. Provide the full interface path, such as
/api/predict/<service_name>/v1/chat/comletions.Stress Testing Configurations
Data Source
Select Single Data Entry.
Single Data Entry
Run
echo -n '{"model": "Qwen3-8B", "messages": [{"role": "user", "content": "Hello!"}], "max_tokens": 1024}' | base64to get the Base64 encoding:eyJtb2RlbCI6ICJRd2VuMy04QiIsICJtZXNzYWdlcyI6IFt7InJvbGUiOiAidXNlciIsICJjb250ZW50IjogIkhlbGxvISJ9XSwgIm1heF90b2tlbnMiOiAxMDI0fQ==
Step 2: View stress testing details
-
View real-time monitoring data: On the Benchmark Task tab, click a Running task name to open the real-time dashboard. Charts include Real-time response time (TP50/TP90/TP99/TP100/AVG), Real-time return codes, Real-time traffic (RECEIVE/SEND), and Real-time queries per second (QPS).
-
View the stress testing report. When task Status is Completed, click the task name to view the stress testing report.
The report includes Basic Information, Stress Testing Configurations, Test Result, and Test Monitoring. Metric definitions: Stress testing task monitoring metrics.
Step 3: Manage stress testing tasks
Manage stress testing tasks in the console
On the Benchmark Task tab, view the list of created tasks and perform operations such as Enable, Clone, Copy Report, and Delete.
Manage stress testing tasks using the EASCMD client
-
View the list of stress testing tasks
Use the
bench listcommand to view the list of stress testing tasks created by the current user. The following example shows the command format for Windows 64-bit.eascmdwin64.exe bench lsThe following is a sample output.
[RequestId]: 7F953F8E-8897-5785-808A-CA648302**** +-------------------------+--------------------------+-------------+----------------+---------+---------------------+ | TASKNAME | TASKID | REGION | AVAILABLEAGENT | STATUS | CREATETIME | +-------------------------+--------------------------+-------------+----------------+---------+---------------------+ | benchmark-***-test-**** | eas-b-ql470xog6qeh25**** | cn-shanghai | 0 | Stopped | 2022-06-17 17:58:01 | | benchmark-***-test-**** | eas-b-bdnzvwq0z0h3xq**** | cn-shanghai | 2 | Running | 2022-06-20 12:18:54 | +-------------------------+--------------------------+-------------+----------------+---------+---------------------+ -
View stress testing task details
Use the
bench desccommand to view the details of a specific stress testing task. The following example shows the command format for Windows 64-bit.eascmdwin64.exe bench desc [benchmark_task_name]Replace [benchmark_task_name] with the name of the stress testing task.
The following is a sample output.
+----------------+------------------------------------------------------------------------------+ | TaskName | benchmark-***-test-b514 | | TaskId | eas-b-bdnzvwq0z0h3xq**** | | ServiceName | xgb_test | | Region | cn-shanghai | | DesiredAgent | 2 | | AvailableAgent | 2 | | Status | Running | | Message | Benchmark task is running | | CreateTime | 2021-10-20 12:38:35 | | UpdateTime | 2021-10-20 12:38:45 | | Config | { | | | "base": { | | | "agentCount": 2, | | | "concurrency": 40, | | | "duration": 1200, | | | "requestCount": | | | 922337203685477****, | | | }, | | | ... | | | } | +----------------+------------------------------------------------------------------------------+ -
Enable real-time visualization for a stress testing task
Use the
bench visualizecommand to enable real-time visualization for a stress testing task. After this command is run, a real-time monitoring page provided by a web server is started at 127.0.0.1. The following example shows the command format for Windows 64-bit.eascmdwin64.exe bench visualize [benchmark_task_name]Replace [benchmark_task_name] with the name of the stress testing task.
The following is a sample output.
[OK] Click the link http://127.0.0.1:18734/eas-benchmark/statsview to observe realtime visualization details, you can turn it off with CTRL+C.
Turning off will not interrupt the benchmark test task, and you can reopen it by the visualize command:
eascmd -c [config_file] bench visualize benchmark-xgb-test-b514
Open the link
http://127.0.0.1:18734/eas-benchmark/statsviewin a browser to view the real-time data. -
Obtain the stress testing report
When the stress testing task status is Stopped, the task is complete. The stress testing report is saved to OSS. You can use the
bench reportcommand to retrieve the report URL. The following example shows the command format for Windows 64-bit.eascmdwin64.exe bench report [benchmark_task_name]Replace [benchmark_task_name] with the name of the stress testing task.
The following is a sample output.
[OK] Benchmark task benchmark-demo-test-c7eb report url: http://eas-benchmark.oss-cn-chengdu.aliyuncs.com/summary/benchmark-demo-test-c7eb-10004.htmlOpen the link after url in a browser to view the stress testing report, as shown in the following figure.
-
Dynamically modify the number of client replicas and concurrency
When the stress testing mode is manual, you must use the
bench updatecommand to dynamically modify the number of client replicas and concurrency. The following example shows the command format for Windows 64-bit.eascmdwin64.exe bench update [benchmark_task_name] -Doptional.concurrency=<attr_value> -Doptional.agentCount=<attr_value>The <attr_value> is the specific value. The following is a sample command:
eascmdwin64.exe bench update benchmark-demo-b99c -Doptional.concurrency=2 -Doptional.agentCount=1The following is a sample output.
[RequestId]: 9920C672-4D41-5CC4-8EC0-C690F76EB2BA [OK] Running [TaskName: benchmark-demo-b99c, DesiredAgent:1, AvailableAgent: 1, Message: Benchmark task is Updating] [OK] Benchmark task benchmark-demo-b99c was updated successfully -
Stop a stress testing task
Use the
bench stopcommand to stop a running stress testing task. The following example shows the command format for Windows 64-bit.eascmdwin64.exe bench stop [benchmark_task_name]Replace [benchmark_task_name] with the name of the stress testing task.
The following is a sample output.
Are you sure to stop the benchmark task [benchmark-***-test-b514] in [cn-shanghai]? [Y/n]
[OK] Task [benchmark-***-test-b514] is stopping
[OK] [Agnet: 0/1]: Benchmark task is Running
[OK] [Agnet: 0/1]: Benchmark task is Stopped
[OK] Benchmark task is stopped
If the real-time visualization feature is running when you stop the task, the system outputs the stress testing report to the terminal where the visualization command was run. You can also use the
bench reportcommand to obtain a more detailed HTML report with graphs. -
Start a stress testing task
Use the
bench startcommand to start a stopped stress testing task. The following example shows the command format for Windows 64-bit.eascmdwin64.exe bench start [benchmark_task_name]NoteThe difference between this command and the
bench createcommand is that when you restart a stress testing task with this command, a new round of stress testing starts based on the last updated configuration of the task.Replace [benchmark_task_name] with the name of the stress testing task.
The following is an example of system output.
Are you sure to start the benchmark task [benchmark-***-test-b514] in [cn-shanghai]? [Y/n] [OK] Task [benchmark-***-test-b514] is starting [OK] [Agnet: 0/1]: Succeed to start benchmark master [OK] [Agnet: 1/1]: Benchmark task is Running [OK] Benchmark task is Running [OK] Click the link http://127.0.0.1:18947/eas-benchmark/statsview to observe realtime visualization details, you can turn it off with CTRL+C. Turning off will not interrupt the benchmark test task, and you can reopen it by the visualize command: eascmd -c [config_file] bench visualize benchmark-xgb-test-b514 -
Delete a stress testing task
After a stress testing task is complete, the VPC controller retains the task record based on its end status. The retention rules are described in the following table.
End status
Retention period
Stopped
48 hours.
CreateFailed, UpdateFailed, Terminated, or Error
10 minutes.
The system automatically deletes the stress testing task after the retention period.
You can also use the
bench deletecommand to manually delete a stress testing task. The command format is as follows.eascmdwin64.exe bench delete [benchmark_task_name]Replace [benchmark_task_name] with the name of the stress testing task.
The following is a sample output.
Are you sure to delete the benchmark task [benchmark-***-test-b514] in [cn-shanghai]? [Y/n]
[OK] Benchmark task benchmark-***-test-b514 is Deleting
[OK] Benchmark task was deleted successfully
LLM configuration details
Basic information
|
Parameter |
Description |
|
Service |
Select the service to test and choose LLM Service. |
|
Service Endpoint |
Only these two OpenAI interfaces are supported:
|
|
Stress Testing URL |
Auto-populated after you select a service interface. |
|
Model ID |
Required. The model ID from ModelScope or Hugging Face, used to load the correct tokenizer for token counting. On ModelScope, the model ID is the path under the model name (for example, |
|
Model Name |
Optional. Overrides the model ID in the request body. If empty, the model ID is used. |
Select a data type
|
Data Type |
Description |
|
Public Dataset |
Use the public ShareGPT dataset for stress testing.
|
|
Custom Dataset |
Configure a custom dataset based on your specific scenario: Important
Request data for LLM stress testing must include the
|
|
Simulation Data |
|
Select a test mode
Three test modes are supported:
-
Fixed Concurrency Test: Sets a fixed number of concurrent users. Suitable for testing system performance under a specific concurrency level.
-
Fixed Request Rate Test: Sets a fixed request rate. Suitable for testing system performance at a specific request rate.
-
Extreme Throughput Test: Sends all requests simultaneously to determine the maximum request rate (QPS) that the inference service can handle. Suitable for testing system limits.
In Fixed Concurrency Test and Fixed Request Rate Test modes, you can enable Continuous Test.
-
If you enable Continuous Test, the task runs until the stress testing duration ends, regardless of the Number of Request Samples.
-
If you disable Continuous Test, the task stops after completing the specified Number of Request Samples or reaching the Maximum Duration (s).
Parameter settings for different test modes are as follows:
|
Test Mode |
Parameter Settings |
|
Fixed Concurrency Test |
|
|
Fixed Request Rate Test |
Sets a fixed request rate for testing system performance. Configure the following parameters:
|
|
Extreme Throughput Test |
|
More configurations
|
Parameter |
Description |
|
HTTP Header |
A key-value pair. For example:
|
|
Burstiness |
|
|
Random Seed |
Default value: 0. Integer data type. Value range: 0-4294967295 (2**32-1). |
|
Ignore EOS |
Enabling Ignore EOS causes the model to ignore the End-of-Sequence (EOS) token when generating text, forcing generation until the preset maximum generation length is reached. |
General-purpose scenario configuration details
Console parameters
|
Parameter |
Description |
|
|
Basic Information |
Service |
Name of the service to test. |
|
Stress Testing URL |
Service invocation URL. |
|
|
Stress Testing Configurations |
Data Source |
Configure stress testing data using Single Data Entry, Data Address, OSS Object, or Upload Local File.
|
|
Split File Data by Line |
Available when Data Source is set to Data Address, OSS Object, or Upload Local File. If enabled, the uploaded stress testing file is split by line, and each line is used as a data entry. Otherwise, the entire file content is used as a single data entry. |
|
|
Maximum Duration (s) |
Duration of the stress test in seconds. Default: 300 seconds. |
|
|
Maximum QPS |
Maximum allowed QPS (requests per second). Default: 10000. |
|
|
Maximum Response Time (ms) |
Maximum allowed response time (RT) in milliseconds. If this threshold is exceeded, QPS is automatically adjusted until real-time RT meets expectations. |
|
|
HTTP Header |
Request header configuration in key-value pairs. For example:
|
|
Create using the EASCMD client
Use bench create to create a stress testing task. For client setup, see Download and authenticate the client. After creation, use the returned URL to view real-time monitoring. Windows 64-bit example:
eascmdwin64.exe bench create [bench_desc_json]The bench_desc_json is a JSON configuration file. Examples below; full parameter reference: JSON parameter descriptions.
The following is a sample output.
[RequestId]: DE240637-4976-59AF-A28C-BAA55C0A****
[OK] Task [benchmark-xgb-test-b514] is creating
[OK] [Agnet: 0/1]: Succeed to start benchmark master
[OK] [Agnet: 0/1]: Succeed to start benchmark master
[OK] [Agnet: 1/1]: Benchmark task is Running
[OK] Benchmark task is Running
[OK] Click the link http://127.0.0.1:18222/eas-benchmark/statsview to observe realtime visualization details, you can turn it off with CTRL+C.
Turning off will not interrupt the benchmark test task, and you can reopen it by the visualize command:
eascmd -c [config_file] bench visualize benchmark-xgb-test-b514
Stress testing modes
General-purpose service stress testing supports the following three modes:
-
auto mode: The eas-benchmark VPC controller automatically creates Agent Workers and uses an optimization algorithm to find the service's maximum capacity.
-
scan mode: Dynamically increases pressure from a starting QPS (minQPS) to maximum QPS (maxQPS) at a specified interval (adjustInterval) and step (qpsGrowthDelta). Stops when maxRT, maxQPS, or error tolerance (faultTolerate) is reached.
-
manual mode: Uses a fixed number of stress testing agents and concurrency per agent. Both can be adjusted dynamically during the test.
The console only supports auto mode. The EASCMD client supports auto, scan, and manual modes.
You can add the mode parameter in the optional section of the JSON configuration file to specify the stress testing mode. The following are configuration examples.
auto mode
In auto mode, you only need to specify the service name and stress testing data in the configuration file. You can use the default values for other parameters. The following is a configuration example.
{
    "service": {
        "serviceName": "demo"
    },
    "data": {
        "path": "https://examplebucket.oss-cn-chengdu.aliyuncs.com/data/warmup.tf.bin"
    },
    "optional": {
        "maxQPS": 1000,
        "duration": 300
     }
}
scan mode
{
    "service": {
        "serviceName": "demo"
    },
    "data": {
        "content": "aGVsbG8K"
    },
    "optional": {
        "mode": "scan",
        "maxQPS": 1000,
        "minQPS": 500,
        "qpsGrowthDelta": 100,
        "adjustInterval": 30
    }
}
manual mode
{
    "service": {
        "serviceName": "demo"
    },
    "data": {
        "content": "aGVsbG8K"
    },
    "optional": {
        "mode": "manual",
        "agentCount": 1,
        "concurrency": 5
    }
}
JSON parameter descriptions
|
Item |
Parameter |
Required |
Description |
|
service |
serviceName |
Yes |
The name of the service to be stress-tested. |
|
data |
content |
No |
A single stress testing request data entry as a Base64-encoded string. To specify multiple request data entries, use the path parameter. |
|
path |
No |
The path of the test data source. You can configure an HTTP path or an OSS path. You can specify multiple paths separated by commas (,). You can also package multiple test files into a .zip file for batch configuration. Note
Save the stress testing data file in its original format. Do not perform Base64 encoding. |
|
|
multiLine |
No |
Specifies whether to split the test data by line. This is a Boolean value, and the default is false. If set to true, the downloaded data is parsed line by line. |
|
|
http |
headers |
No |
HTTP request header settings. This is a list. For example: |
|
timeout |
No |
The HTTP request timeout in milliseconds. The default is 20000. |
|
|
optional |
mode |
No |
The stress testing mode. Three modes are supported (Stress testing modes):
|
|
duration |
No |
The stress testing duration in seconds. The default is 600, and the maximum is 1200. |
|
|
agentCount |
No |
The number of client replicas in manual mode. A higher number of replicas results in greater pressure. The default is 1. |
|
|
concurrency |
No |
Concurrent requests per client instance in manual mode. Default: 2. Increase concurrency first; if still insufficient, increase agent count. |
|
|
adjustInterval |
No |
The dynamic adjustment interval for automatic pressure in scan mode, in seconds. The default is 60. |
|
|
minQPS |
No |
The starting QPS value for automatic pressure in scan mode. The default is 100. |
|
|
maxQPS |
No |
The maximum allowed QPS in scan or auto mode. |
|
|
maxRT |
No |
The maximum RT (TP99) in scan or auto mode. If this threshold is exceeded, the QPS is automatically adjusted until the real-time RT meets expectations. |
|
|
qpsGrowthDelta |
No |
The amount by which QPS increases each time in scan mode. The default is 50. |
|
|
faultTolerate |
No |
Error tolerance (non-200 status codes) in scan or auto mode. For example, 0.01 means the error process triggers at 1% failure rate. Default: 0.001 (one in a thousand). |
|
|
faultAction |
No |
The behavior of the stress testing VPC controller when the request error rate exceeds the threshold set by faultTolerate in scan or auto mode. The following values are supported:
|
Stress testing task monitoring metrics
LLM service-specific metrics
|
TTFT (Time To First Token) Time from sending a request until receiving the first generated token.
|
TPOT (Time per Output Token) Time interval between two consecutive generated tokens.
|
|
TPS (Tokens Per Second) The number of tokens generated per second.
|


General metrics
|
Request per second distribution Requests received by the service per second over time.
|
Response time distribution Response count distribution within the selected time range.
|
|
Traffic distribution Volume of request and response data between client and service over time.
|
Response time interval distribution Percentage of responses falling into different latency intervals (ms).
|
|
Overall response time distribution End-to-end request latency at different quantiles (ms).
|
Return status code distribution Distribution of HTTP status codes returned by the service.
|


FAQ
Why do I get a 400 or 404 error during a single data test when a curl request works?
Symptom: When performing a one-click stress test on a large language model inference service deployed on EAS using a single data entry, all requests fail with an HTTP status code of 400 or 404. However, sending the same request manually with curl succeeds with a 200 status code.
Root cause:
-
404: The stress testing URL is incorrect. For example, it might contain an extra slash at the end (such as
/test/), while the actual registered path for the service is/test, causing a routing mismatch. -
400: The request body format is incorrect. A common mistake is not enclosing the JSON string in single quotes when generating the Base64 encoding for the request body (such as
echo -n {"file_names": [...]} | base64). This causes the shell to parse the JSON incorrectly, resulting in an invalid JSON format that the service cannot parse.
Solution:
-
Ensure the stress testing URL path exactly matches the service's registered path. Remove any extra slashes at the end (use
/testinstead of/test/). -
Before generating the Base64 encoding, enclose the entire JSON request body in single quotes. For example:
echo -n '{"file_names": ["xxx.pdf"]}' | base64
Next steps
-
Manage stress testing tasks through API: Stress testing tasks.
-
Invoke the stress-tested service: Overview of invocation methods.