Designer provides dozens of preset templates for various frameworks and industry use cases. You can create a pipeline from a preset template, and then modify its components or configurations to quickly build a model that meets your requirements. This topic uses the Heart Disease Prediction template as an example to walk you through building, debugging, and deploying a visual model.
Prerequisites
-
You have activated PAI and created a workspace. For more information, see Activate PAI and create a default workspace.
-
The workspace is associated with MaxCompute resources. For more information, see Quick start - Preparations.
Step 1: Create a pipeline from a template
In Designer, you use pipelines to build models. You first create a pipeline and then arrange components in it to define the processing and scheduling logic for your model.
-
Go to Visualized Modeling (Designer), select your workspace, and open Designer.
-
On the Preset Templates tab, find the Heart Disease Prediction template card and click Create.
-
Confirm the configurations and click OK.
Parameter
Description
Workflow name
Custom workflow name.
Workflow data storage
The OSS bucket path for temporary data and models. Defaults to workspace storage if not configured.
For each run, Designer automatically creates a temporary folder at
workflow_storage_path/task_ID/node_ID, which simplifies per-component storage configuration.Visibility
-
Visible to Me: Creates workflow in the My Pipelines folder, visible only to you and workspace administrators.
-
Visible to Current Workspace: Creates workflow in the Pipelines Visible to Workspaces folder, visible to everyone in the workspace.
For more information about configurations and parameters, see Create a pipeline.
-
-
Click Open.
Step 2: Build the model
The pipeline created from the template appears on the canvas, as shown in the following figure.
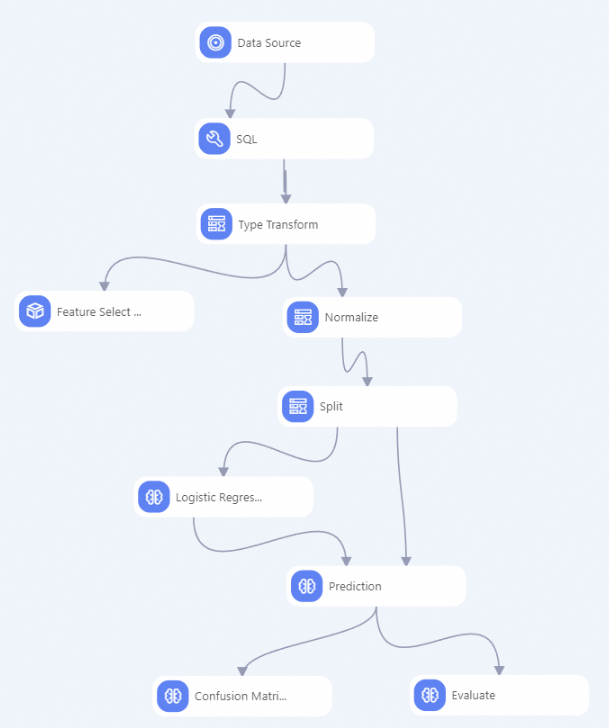
To help you get started quickly, the components in the preset template are pre-configured. You can click any component to view its parameters. For details, see Heart disease prediction.
To proceed with Step 4: Deploy the model (Optional), you must enable PMML export. Select the Logistic Regression component. On the right-side pane, go to the Fields Setting tab and select the Whether to Generate PMML checkbox.
Step 3: Run and debug the model
Click the Run icon ![]() in the upper-left corner of the canvas to run the entire pipeline.
in the upper-left corner of the canvas to run the entire pipeline.
-
View data and visual analysis
After a component runs successfully, you can right-click it and select View Data to check its output.
For certain components, such as the confusion matrix and binary classification evaluation in this example, Designer can visualize the output. This helps you understand complex data and analysis results through intuitive charts and graphs. You can also open the visualization by clicking Visual Analysis or the visualization icon above the canvas. For more information, see Visual Analysis.
-
View logs
If a component fails to run, you can right-click it and select View Log to identify the cause of the failure.
Step 4: Deploy the model (Optional)
Designer is seamlessly integrated with Elastic Algorithm Service (EAS). After you train, evaluate, and run offline predictions with a model, you can deploy it to EAS to create an online model service.
-
After the pipeline runs successfully, click Models in the left panel. Select the model that you want to deploy and click Deploy in EAS.
-
Confirm the configuration parameters. For details, see Deploy a single model as an online service.
On the EAS deployment page, the Model File and Processor Type parameters are configured by default. You can configure other parameters as needed.
-
Click Deploy.
When the Service Status changes from Creating to Running, the model deployment is successful.
ImportantTo avoid incurring unnecessary charges, click Stop in the Actions column for online services that you are not using.
References
-
For more information about building and debugging models in a pipeline, see Build and debug a model.
-
You can create a blank pipeline and arrange components from scratch to meet your business needs. For a quick start, see Create a custom pipeline.
-
You can use DataWorks to schedule offline pipelines for periodic model updates. For more information, see Use DataWorks to schedule Designer pipelines offline.