The Linear Model Feature Importance component calculates the feature importance for linear models, including linear regression and logistic regression for binary classification. It supports both sparse data and dense data formats. This topic describes how to configure the component.
Limitations
The supported computing engine is MaxCompute.
Component configuration
You can configure the parameters for the Linear Model Feature Importance component in one of the following ways.
Method 1: Visual interface
Configure the component parameters on the pipeline page in Machine Learning Designer.
|
Tab |
Parameter |
Description |
|
Fields Setting |
Feature Columns |
The feature columns from the input table to use for training. This parameter is optional. By default, all columns are used except for the label column. |
|
Target Column |
Required. Click Select Fields to select the label column. |
|
|
Input table data is in sparse format |
Optional. |
|
|
Tuning |
Number of Cores |
The number of cores for computation. Optional. |
|
Memory per Core (MB) |
The amount of memory per core, in MB. Optional. |
Method 2: PAI command
You can configure the component parameters by running a PAI command in the SQL Script component. For more information, see SQL Script.
PAI -name regression_feature_importance -project algo_public
    -DmodelName=xlab_m_logisticregressi_20317_v0
    -DoutputTableName=pai_temp_2252_20321_1
    -DlabelColName=y
    -DfeatureColNames=pdays,previous,emp_var_rate,cons_price_idx,cons_conf_idx,euribor3m,nr_employed,age,campaign
-DenableSparse=false -DinputTableName=pai_dense_10_9;|
Parameter |
Required |
Description |
Default |
|
inputTableName |
Yes |
The name of the input table. |
None |
|
outputTableName |
Yes |
The name of the output table. |
None |
|
labelColName |
Yes |
The name of the label column in the input table. |
None |
|
modelName |
Yes |
The name of the input model. |
None |
|
featureColNames |
No |
The feature columns to select from the input table. |
All columns except for the label column. |
|
inputTablePartitions |
No |
The partitions to use from the input table. |
The entire table. |
|
enableSparse |
No |
Specifies whether the input data is in a sparse format. |
false |
|
itemDelimiter |
No |
The delimiter between key-value pairs for input data in a sparse format. |
Space |
|
kvDelimiter |
No |
The delimiter between a key and its value for input data in a sparse format. |
Colon (:) |
|
lifecycle |
No |
The lifecycle of the output table, in days. |
Not specified |
|
coreNum |
No |
The number of cores. |
Auto |
|
memSizePerCore |
No |
The amount of memory per core, in MB. |
Auto |
Example
-
Create a table named
bank_dataand import data into it. For more information, see Create a table and Import data. -
Run the following SQL statement to generate training data.
create table if not exists pai_dense_10_9 as select age,campaign,pdays, previous, emp_var_rate, cons_price_idx, cons_conf_idx, euribor3m, nr_employed, fixed_deposit from bank_data limit 10; -
Build and run a pipeline. For more information, see Algorithm modeling. To connect the components, connect the output of Read Table-1 to the inputs of both Logistic Regression for Multiclass Classification and Linear Model Feature Importance. Then, connect the output of Logistic Regression for Multiclass Classification to the input of Linear Model Feature Importance.
-
Drag the Read Table, Logistic Regression for Multiclass Classification, and Linear Model Feature Importance components from the component list in Machine Learning Designer to the canvas.
-
Connect the components to build the pipeline.
-
Configure the parameters for each component.
-
On the canvas, click the Read Table-1 component. In the right-side pane, on the Select Table tab, set Table Name to
bank_data. -
On the canvas, click the Logistic Regression for Multiclass Classification-1 component. In the right-side pane, on the Fields Setting tab, set Feature Columns to
age,campaign,pdays,previous,emp_var_rate,cons_price_idx,cons_conf_idx,euribor3m, andnr_employed. Set Target Column tofixed_deposit. Use the default values for the other parameters. -
On the canvas, click the Linear Model Feature Importance-1 component. In the right-side pane, on the Fields Setting tab, set Target Column to
fixed_deposit. Use the default values for the other parameters.
-
-
After you configure the parameters, click the Run button
 .
.
-
-
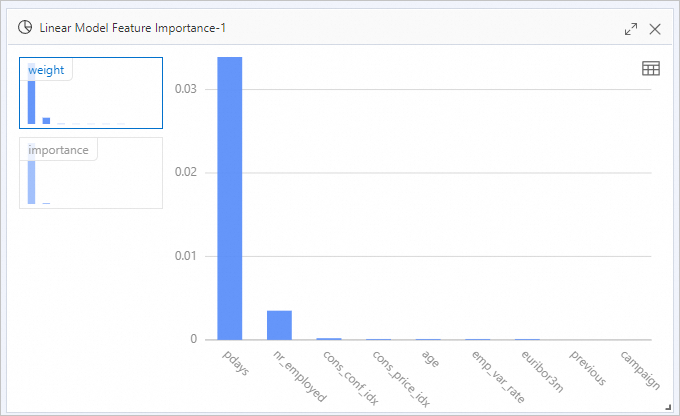
After the pipeline runs successfully, right-click the Linear Model Feature Importance-1 component and choose . The Linear Model Feature Importance component outputs a table that shows the colname, weight, and importance for each feature. Values are presented in scientific notation. For example, the weight of the
agefeature is9.61816270808075E-5.The metric formulas are as follows.
Column name
Formula
weight
abs(w_)
importance
abs(w_j) * STD(f_i)
Noteabs(w_j)is the absolute value of the feature coefficient, andSTD(f_i)is the standard deviation of the training data. -
Right-click the Linear Model Feature Importance-1 component and select View Analytics Report.
Related documents
-
For more information about the components in Machine Learning Designer, see Overview of Machine Learning Designer.
-
To explore other built-in algorithm components for your use case, see Component Reference: All Components.