Monitoring and Alerting Based on SLS
The PAI-Rec engine service supports deployment on EAS and generates a series of logs during operation. You can use Simple Log Service (SLS) to monitor the engine service and configure different alert settings based on your business needs to receive timely alert notifications from SLS. This topic describes how to configure log service and monitoring alert notifications.
Data ingestion configuration
The EAS engine service can be deployed in a public or dedicated resource group. The two deployment methods differ only slightly in Step 1.
Step 1: Create a machine group
The method for creating a machine group depends on whether you use a public or dedicated resource group. For details, see Step 1: Create a machine group for a resource group.
Step 2: Configure Logtail
Log on to the Simple Log Service console.
In the Project list, select the target Project where you want to store logs. If no suitable Project exists, create one. For more information about Projects and how to create them, see Manage Projects.
Select or create a Logstore. For more information about Logstores, see Manage Logstores.
In the Logstore, click Data ingestion. From the listed connection types, select Docker Standard Output - Container.
The machine group was created in step 1. Click Use existing machine group.
Move the machine group created in step 1 from the left to the right.
Configure Logtail. Set a name and enable the Container Filtering option.
ImportantIf you used a machine group associated with a public resource group in step 1, logs from all EAS services in the region are collected. If you used a machine group associated with a dedicated resource group, logs from all EAS services in that dedicated resource group are collected. In either case, the collection scope is large, so container filtering is required.
Add two types of container filters. The first type is Container label blacklist. Set the tag name to io.kubernetes.container.name and the tag value to easworker. The second type is K8s Namespace Regex Match, which filters logs for the engine service. If your engine service is named testing-rec, use the regular expression ^(testing-rec*). This expression ensures logs from both testing_rec and testing_rec_prepub services are ingested.
If you need further log filtering within the engine service—for example, to view only logs where event=end for each request and ignore other log entries—add a processing plugin in the Processing Configuration. Select the plugin type Regex Filter Logs (Match Log Field Values). Add a rule under Collect Logs with the log field set to content and the regular expression set to ^(?=.*event=end)(?=.*uri=/api/rec/feed).*.
Click Next until the configuration is complete.
Click Query Logs to view log details in the Simple Log Service console.
Enable indexing
To facilitate subsequent monitoring and alerting, we recommend that you enable index statistics. Perform the following steps:
Go to the index creation page. Click Query and Analysis Properties in the upper-right corner, and then click Properties from the drop-down list.
In the Query analysis panel, configure attribute fields and click OK.
Configure monitoring alert notifications
After you complete the preceding steps, you can go to the Simple Log Service console to configure monitoring alert notifications. Perform the following steps:
Go to the alert monitoring rules page.
Log on to the Simple Log Service console.
In the Projects section, click the one you want.

On the tab, click the logstore you want.
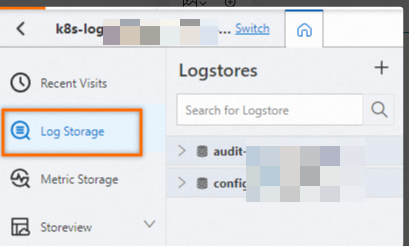
On the query and analysis page, click the
 icon.
icon. 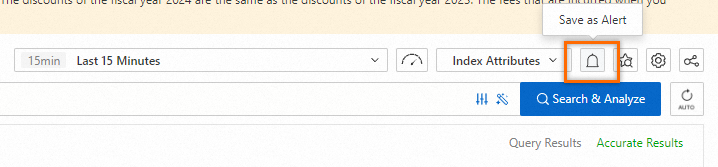
In the Alert Monitoring Rules panel, configure an alert rule and click OK.
You can configure the following alerts:
API timeout alert
Adjust the following key settings as needed. For more information, see Create alert monitoring rules.
Query statistics: Set to
*|select COUNT(*) as count where uri='/api/rec/internal/video_feed' and cost > 700. This triggers an alert if more than 150 requests to the/api/rec/internal/video_feedAPI take longer than 700 milliseconds within 2 minutes. Adjust the uri and cost values as needed.Add annotation: ${alert_name} alert triggered. Count: ${count}.
ERROR count alert
Adjust the following key settings as needed. For more information, see Create alert monitoring rules.
Query statistics: Set to
ERROR not exposure_history_pkey not INFO | SELECT COUNT(*) as count. This triggers an alert if more than 800 ERROR entries occur within 1 minute.Add annotation: ${alert_name} alert triggered. ERROR count: ${count}.
Insufficient recommendation items alert
Adjust the following key settings as needed. For more information, see Create alert monitoring rules.
Query statistics: Set to
"length of items less than size". This triggers an alert if fewer than 150 items appear within 5 minutes.Add annotation: ${alert_name} alert triggered. Affected request count: ${__count__}.