Cloud Native Application Performance Optimizer (CNP) is a platform for evaluating, analyzing, and optimizing cloud-native application performance. CNP automates training performance evaluation for LINGJUN Clusters and provides optimization suggestions.
Access the CNP platform
-
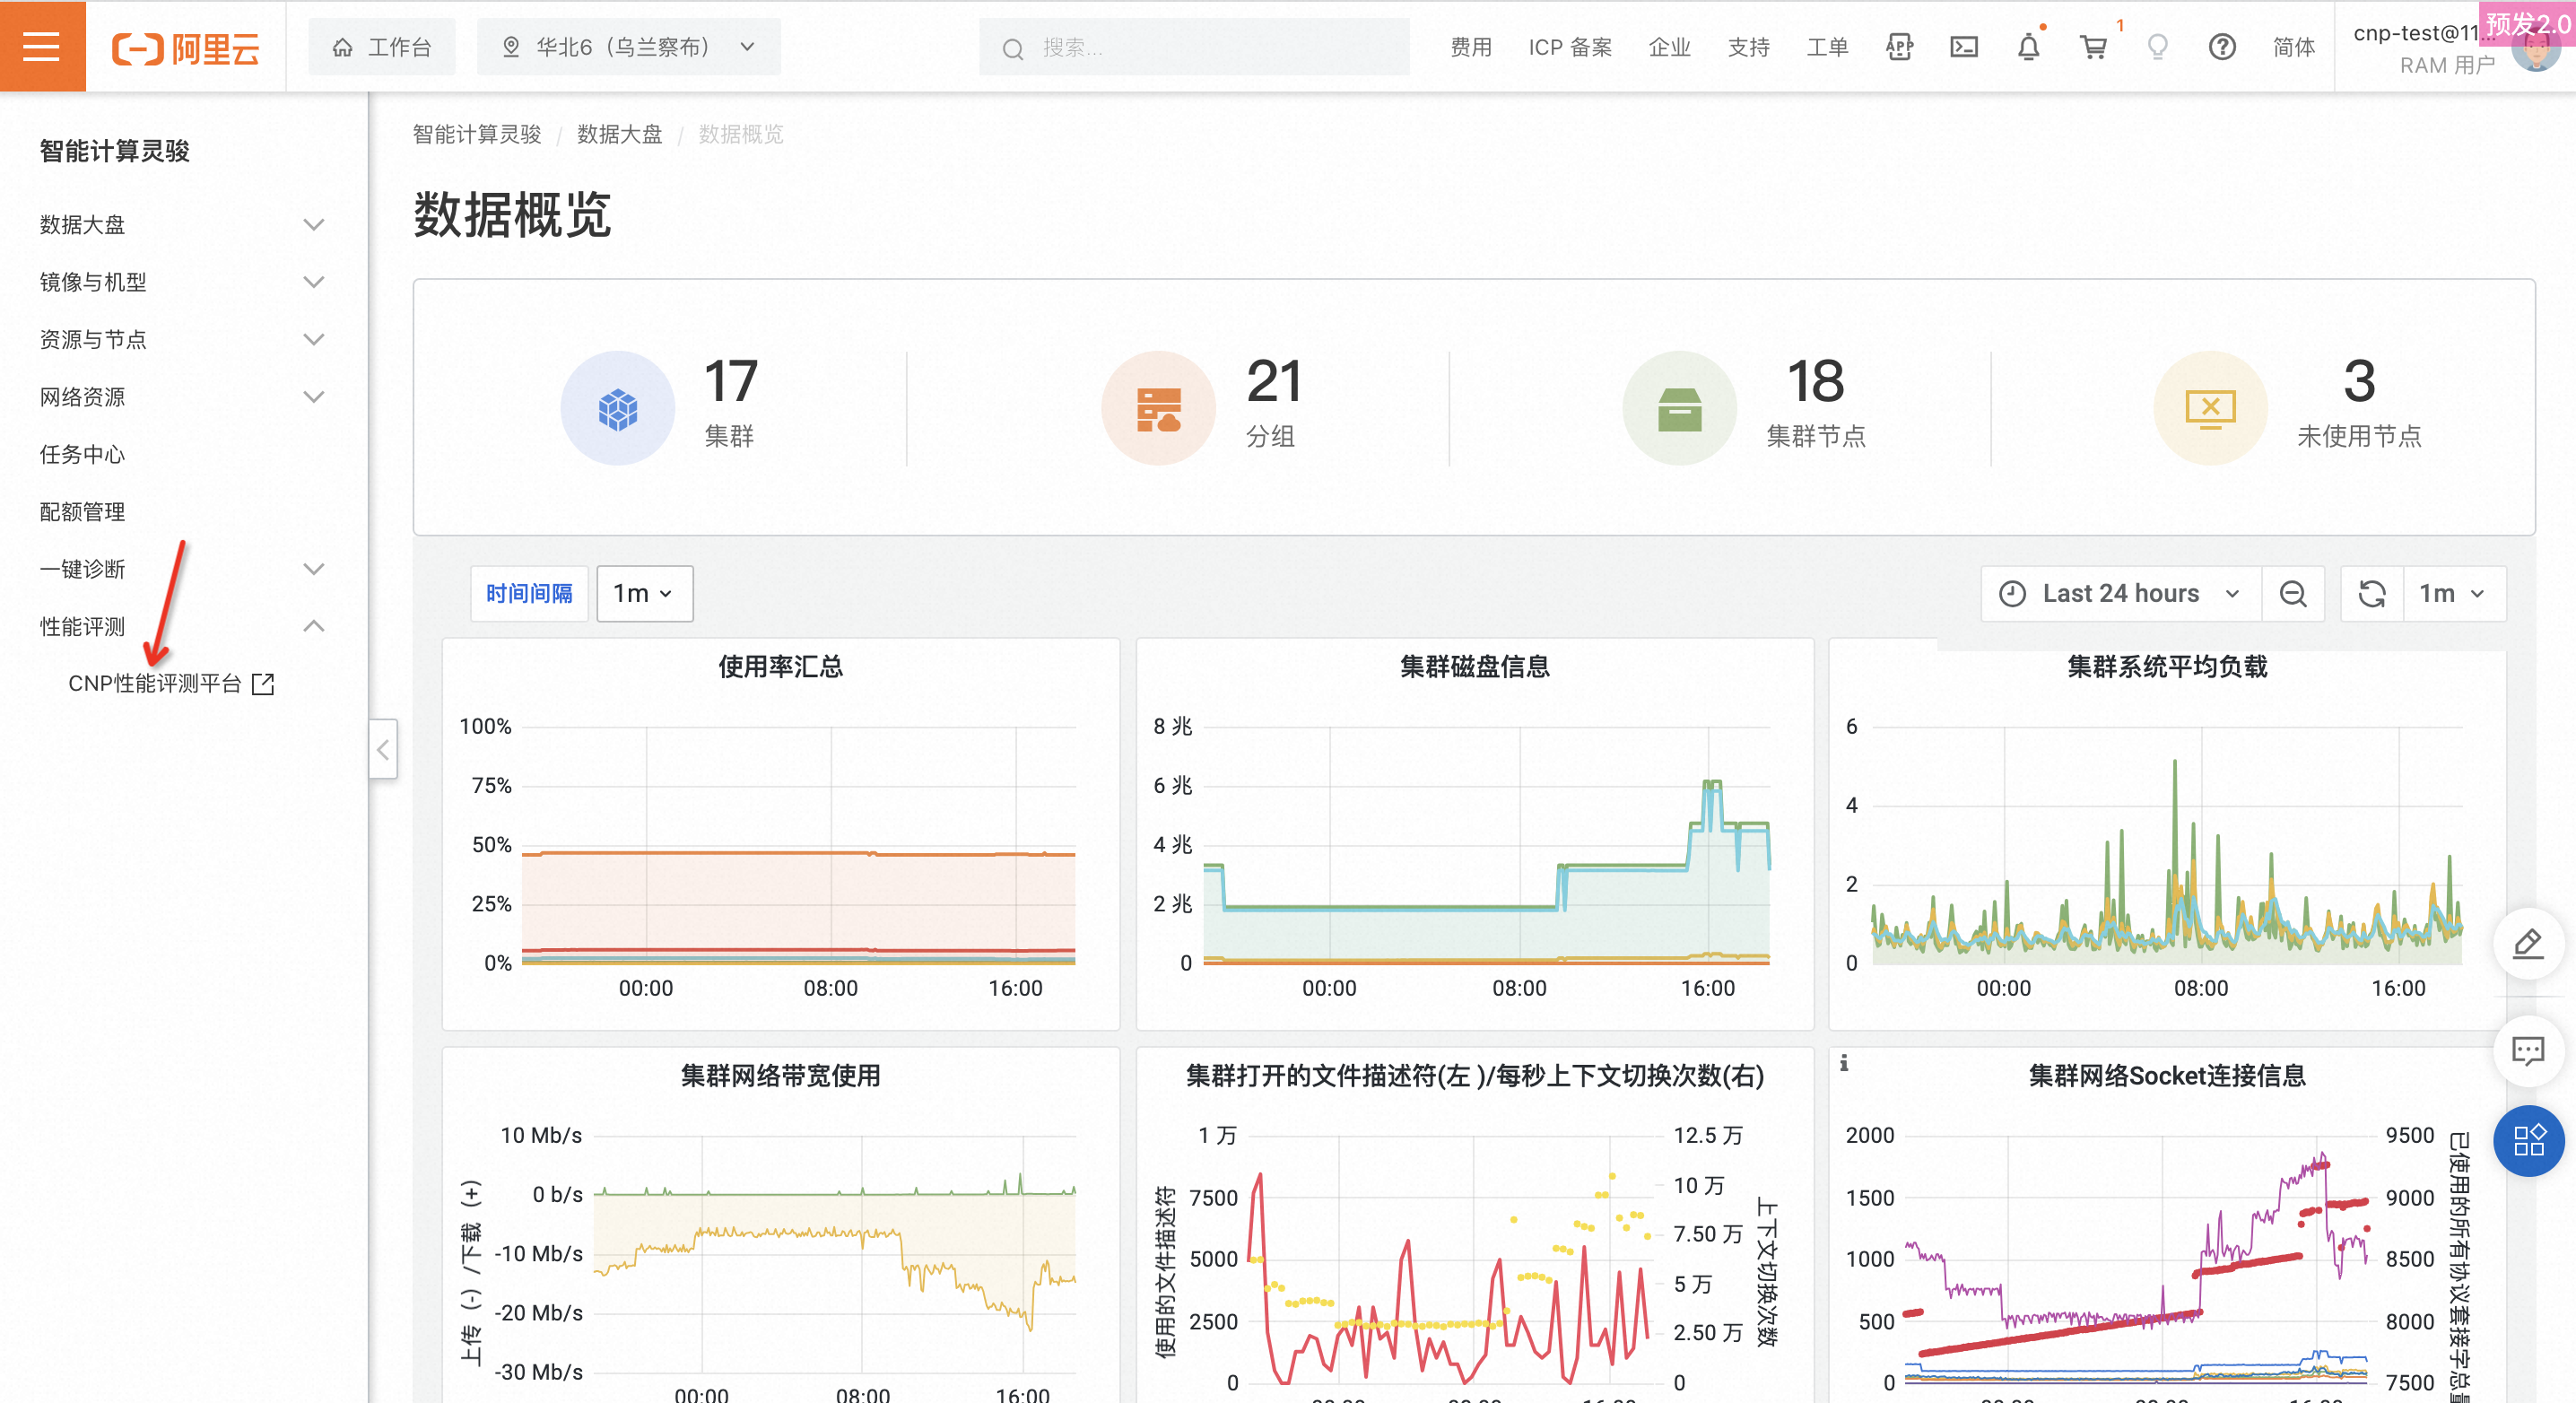
Log on to the LINGJUN Cluster console.
-
In the navigation pane on the left, click Performance Evaluation > CNP Performance Evaluation.
-
On the CNP platform, you can start a performance evaluation and view evaluation results.
-
In the lower-left corner of the page, click Back to return to the LINGJUN Cluster console.

Start an evaluation
Step 1: Select a cluster
On the welcome page, click Start Evaluation. Alternatively, on the performance evaluation page, click Start an Evaluation to begin the first step: Select a cluster.

-
Cluster Name: Select the cluster that you want to evaluate.
-
DLC access information: Enter the required information and click Test Connectivity. A success message appears if the connection is successful. Otherwise, a failure reason is displayed. The following table lists common failure reasons:
Failure reasons
Recommended operation
Connection timeout
Add CNP to the access whitelist and try again.
Incorrect information
At least one of the following is incorrect: AccessKey ID, AccessKey secret, workspace, or Endpoint. Check the information and try again.
Failed to obtain an STS token (D3001)
Failed to create an SLR (D3002)
Failed to create an ARMS instance (D3003)
Failed to check the ARMS service (D3004)
Activate ARMS.
Failed to obtain ARMS information (D3005)
No permission to create an SLR (D3006)
Grant the SLR permission.
After the connectivity test is successful, click Next to proceed to Step 2: Select a test plan.
Step 2: Select a test plan
Use a template
Two default test plan templates are available. Select one based on your business scenario.

|
Plan |
Test content |
Tested cluster scale |
|
Plan A: General plan for large language model scenarios |
|
|
|
Plan B: General plan for image recognition scenarios |
|
|
Custom plan
If the templates do not meet your requirements, create a custom test plan.
-
Single GPU test: You can customize the number of nodes. The default test case is MatMul.
-
Single machine test: You can customize the number of nodes. The default test case is Bert-base.
-
AI model test: You can customize the AI model and the number of GPUs to evaluate.
-
The following models are currently supported: LLaMA-7B, Stable Diffusion, Swin-Transformer, Bert-base, and UNet.
-
The default parameter settings use the baseline configuration. You can view the specific configuration on the page.

Estimated evaluation time
After you select a test plan, the system estimates the evaluation time based on the test content and the maximum scale of the cluster selected in Step 1. If the number of available nodes is less than the maximum, the actual evaluation time exceeds the estimate.
One-click start evaluation
After you complete Step 1 and Step 2, click One-click Start Evaluation to start the evaluation.
View evaluation progress and results
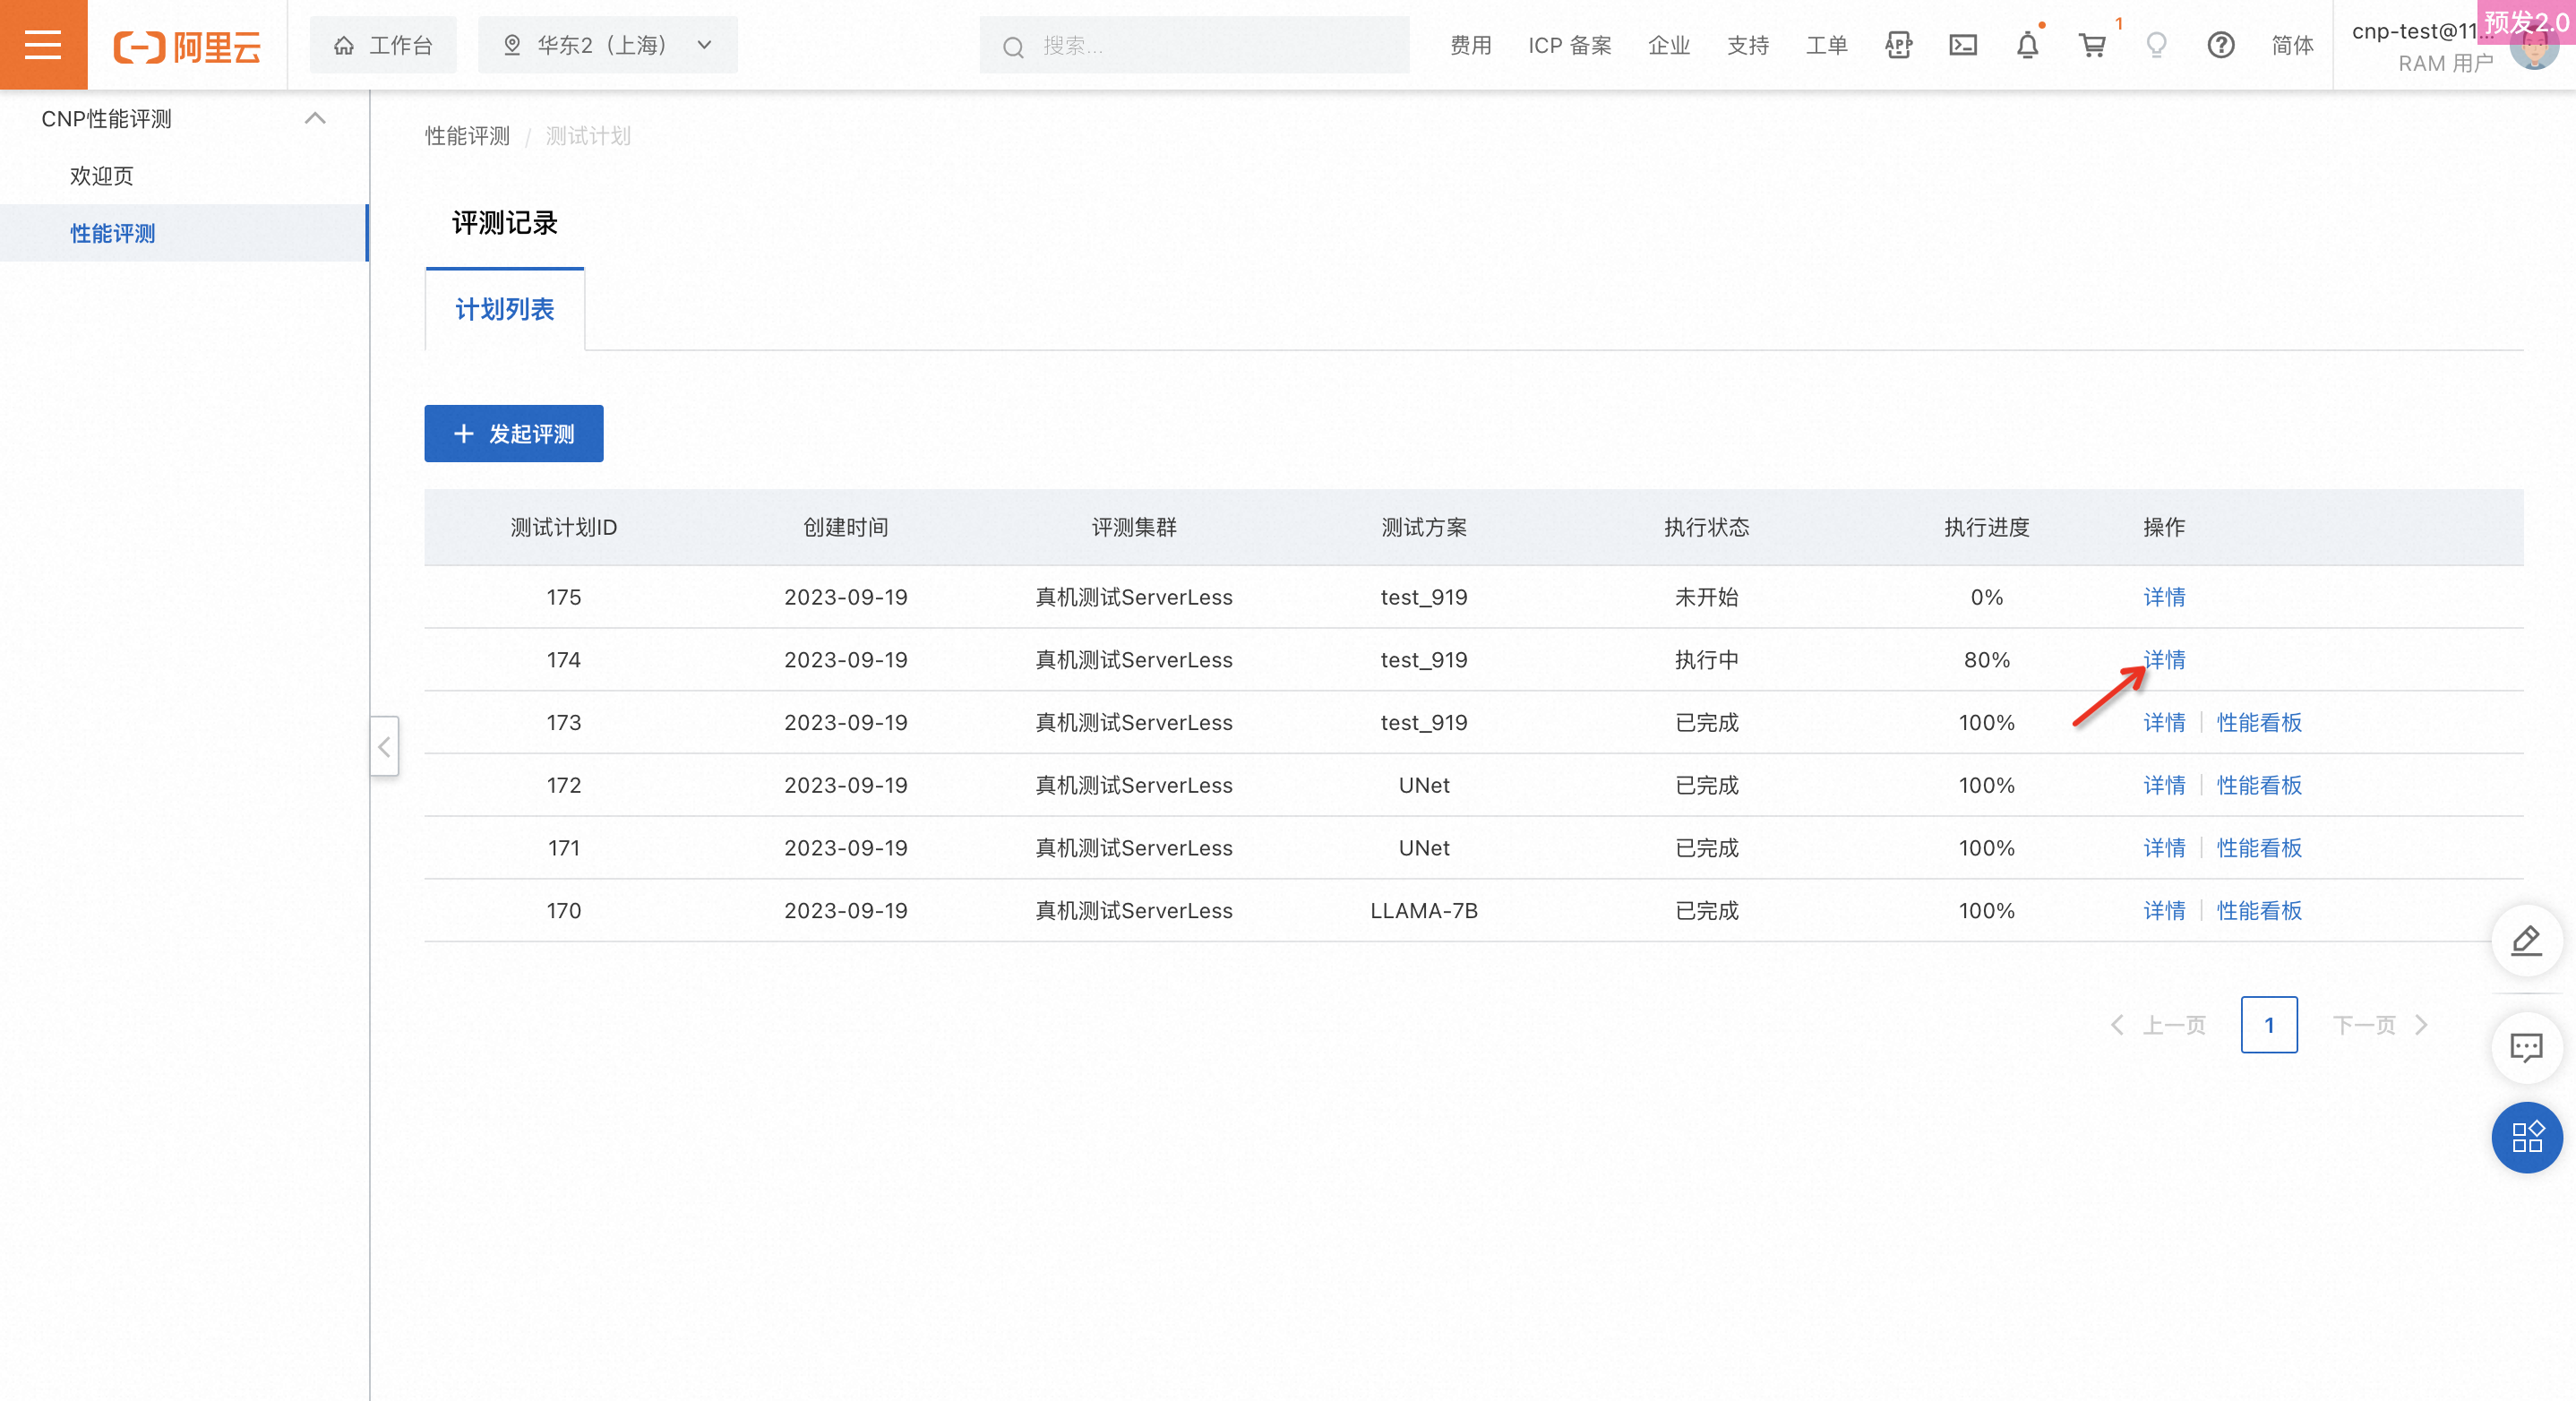
After you create a test plan, view its execution status and progress in real time on the test plan list page. Click Details to view the progress of each stage.
Single GPU test
-
Test passed
The single GPU test passes if no suspected faulty GPUs or warning GPUs are found.
Note-
Suspected faulty card: Indicates that a task failed on the card.
-
Warning card: Indicates that a card's TFLOPS variation falls outside the normal threshold range for more than 5 % of the iterations.
-
Calculation logic for the normal threshold: The median TFLOPS of all GPUs in each iteration is used as the baseline. The system compares the baseline ±3% with 4 × sigma (4 × standard deviation). The larger of the two values is used as the normal threshold range.

-
-
Abnormal test results
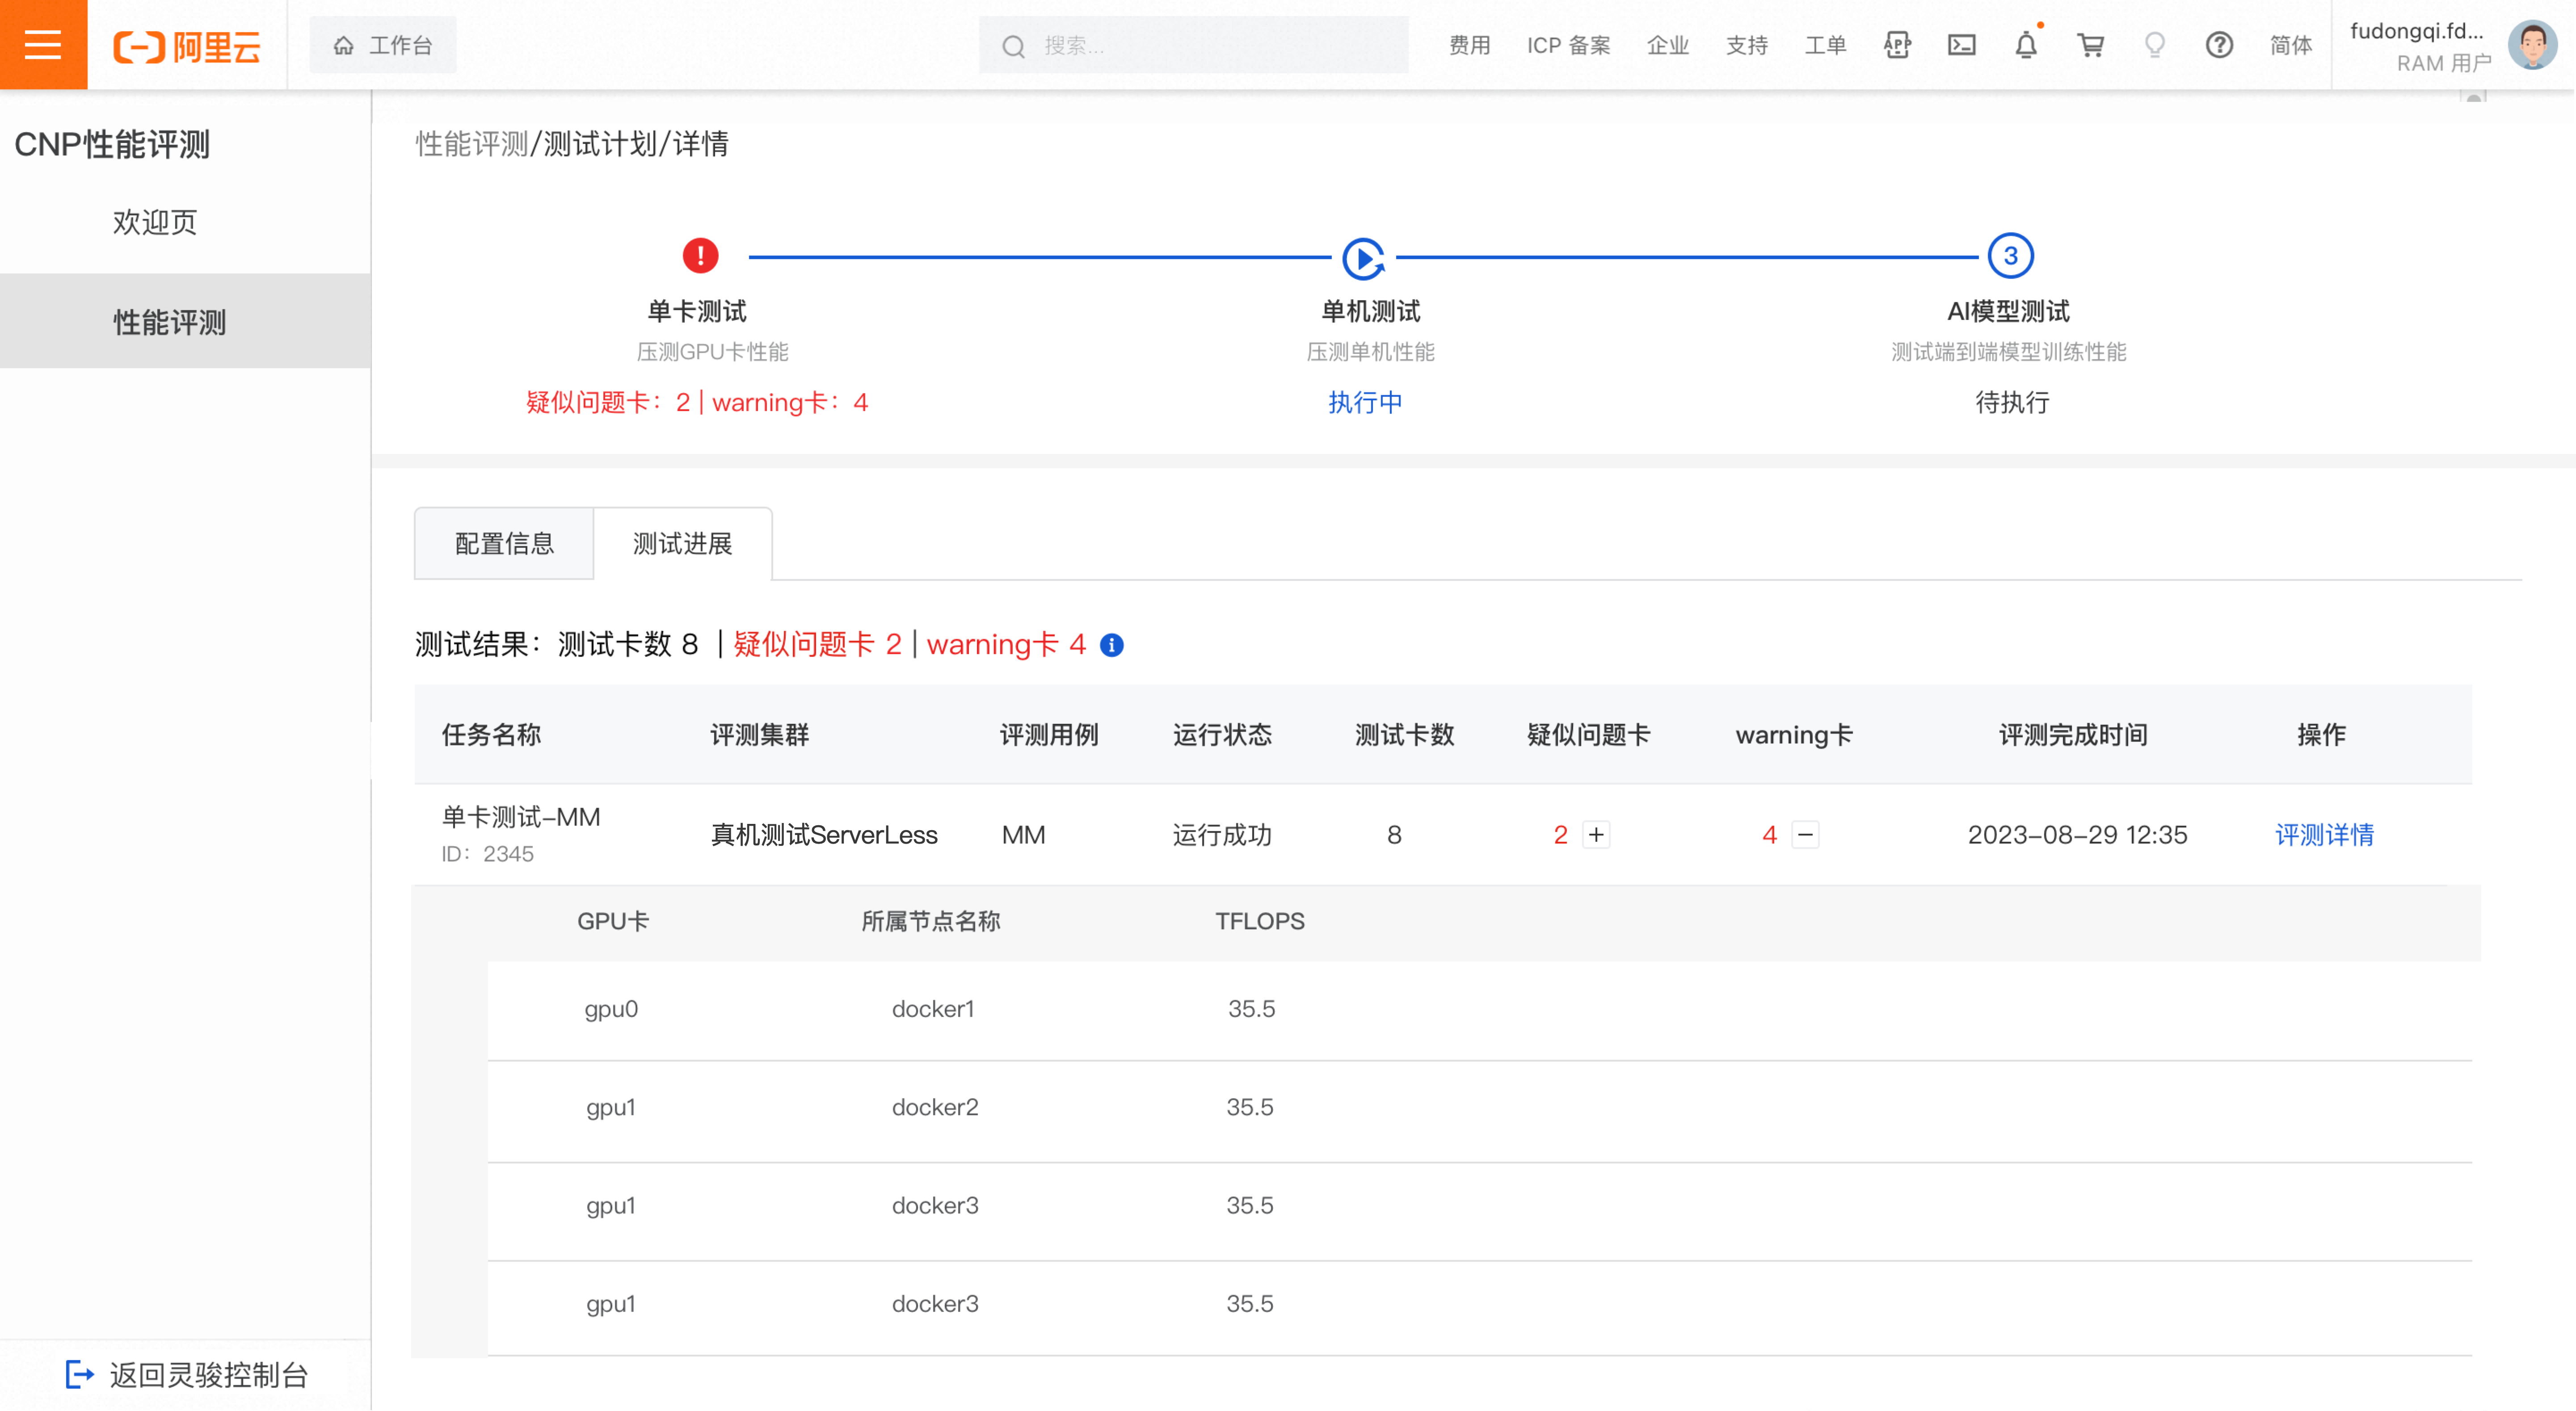
The single GPU test result is abnormal if a suspected faulty GPU or a warning GPU is found.
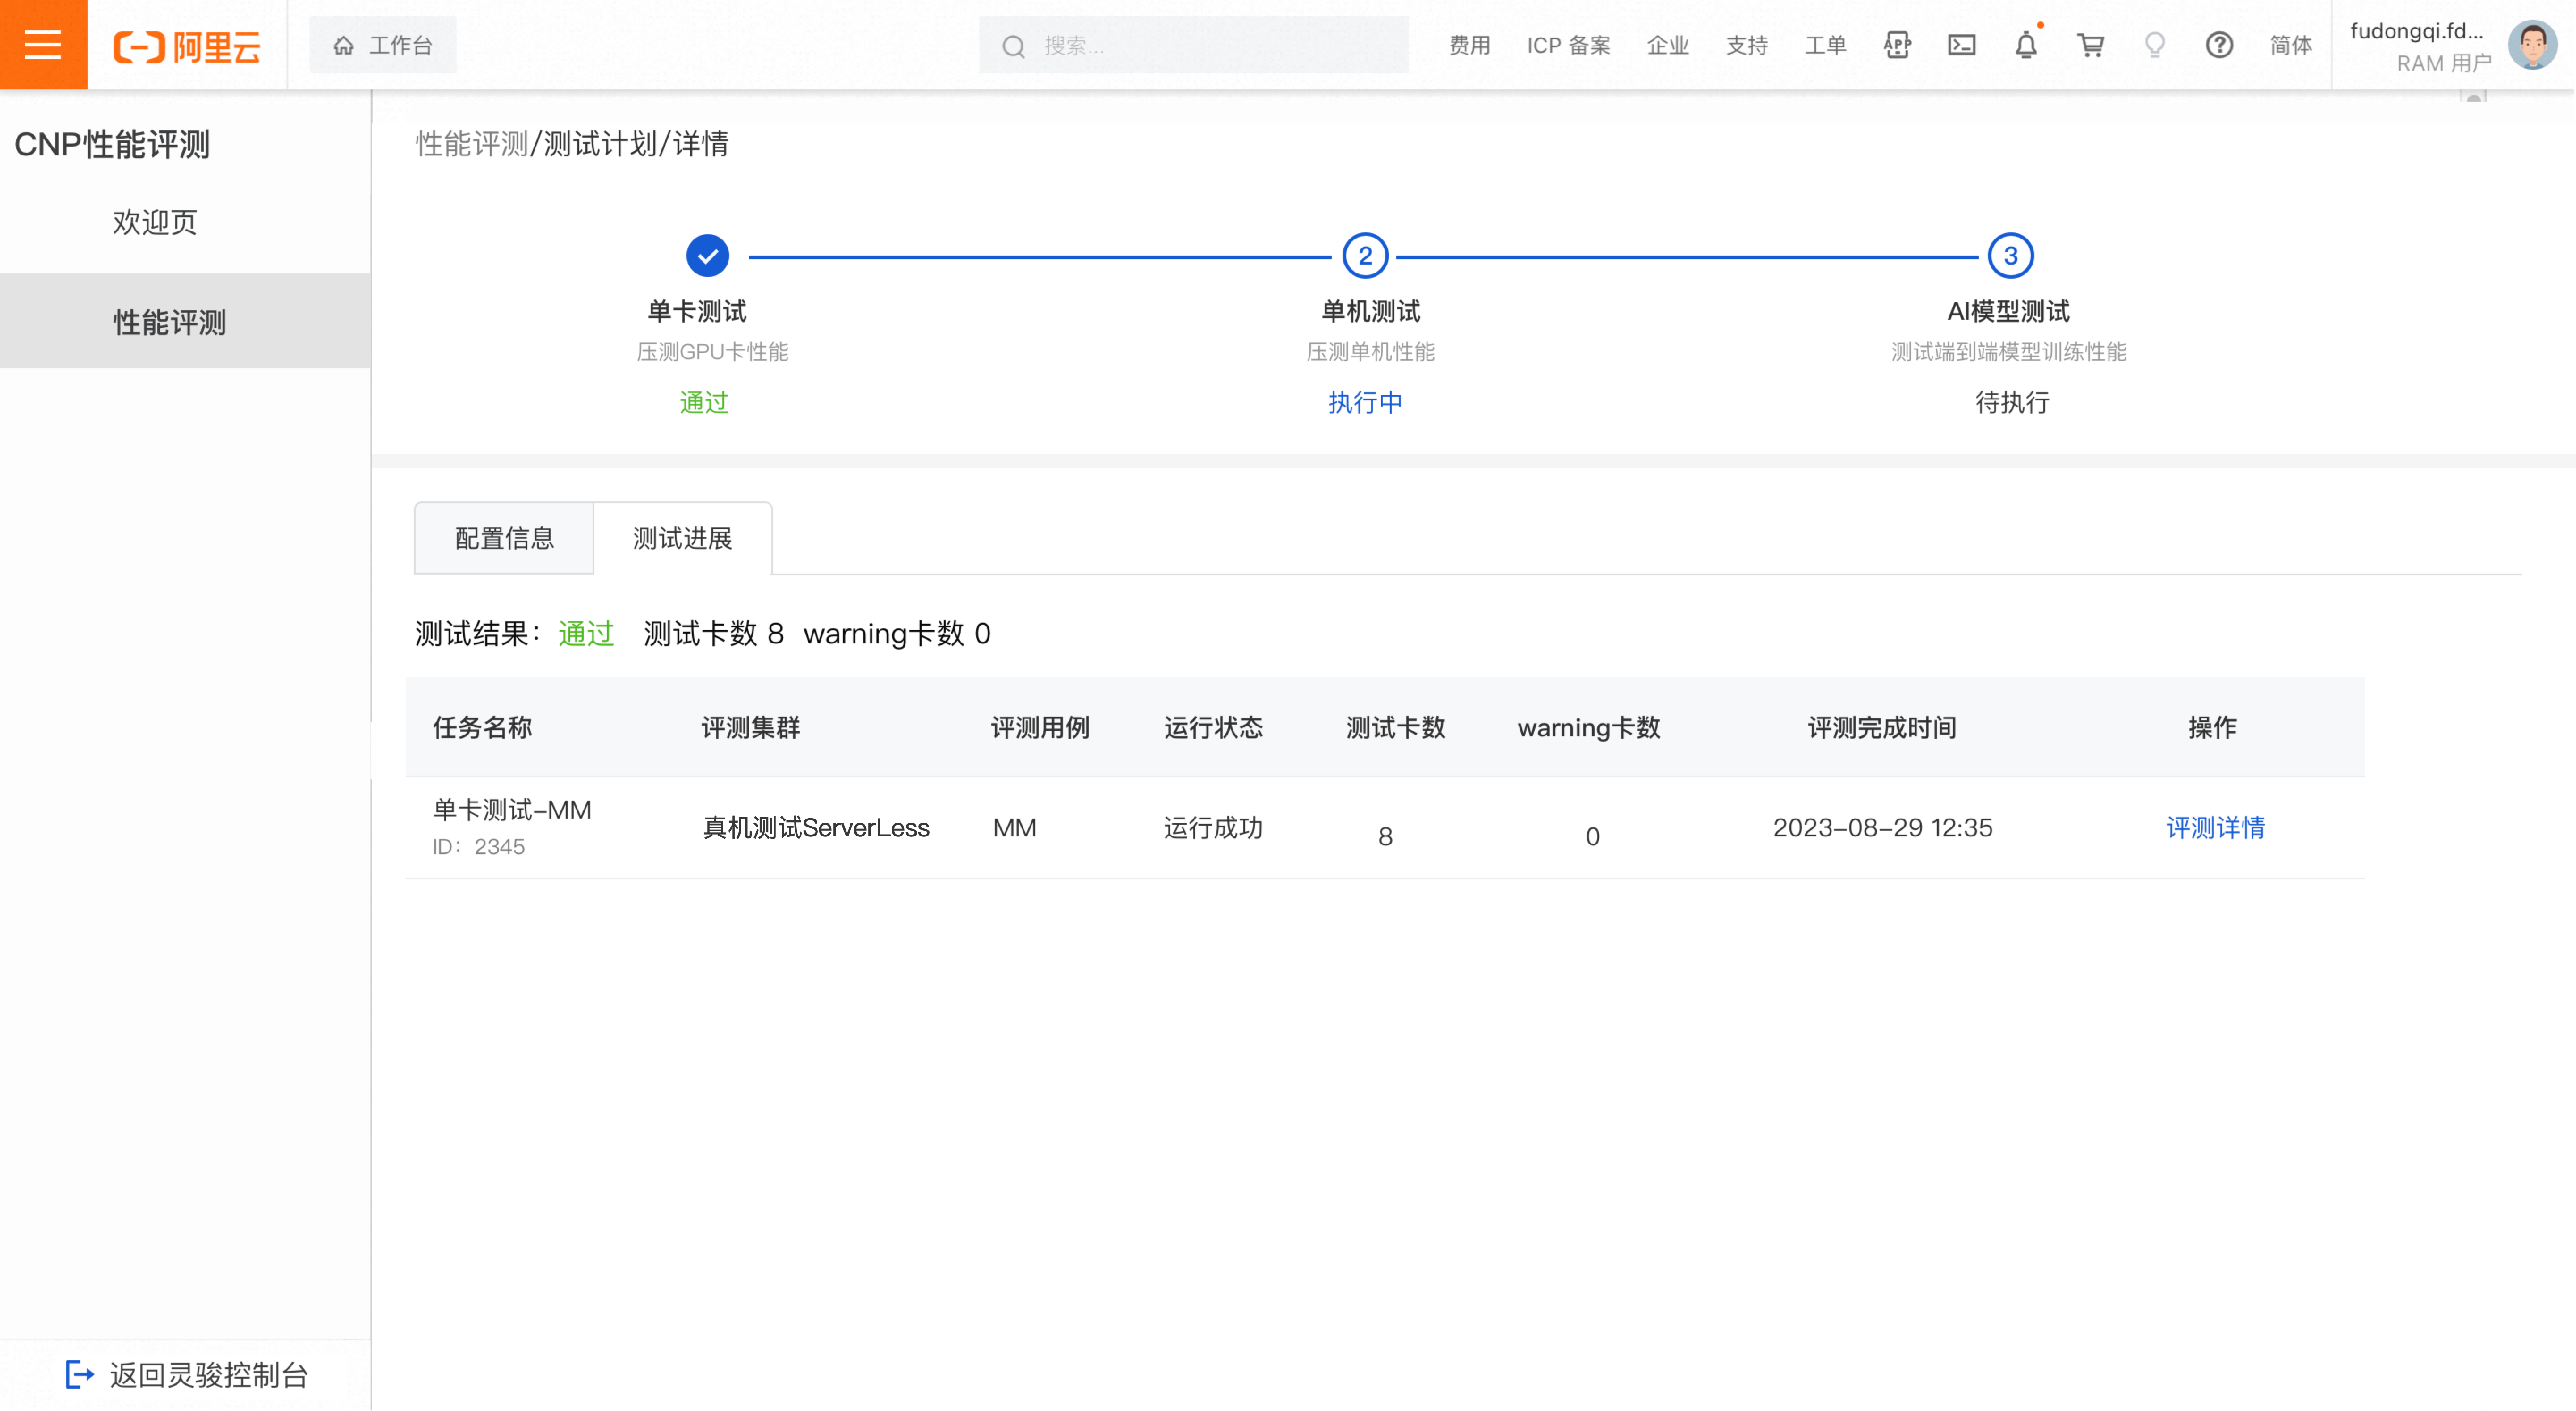
In the evaluation task list, click the plus icon to expand and view details of suspected faulty or warning GPUs. Report abnormal nodes to the O&M team for investigation. Click Evaluation Details to view detailed results.
Single machine test progress
-
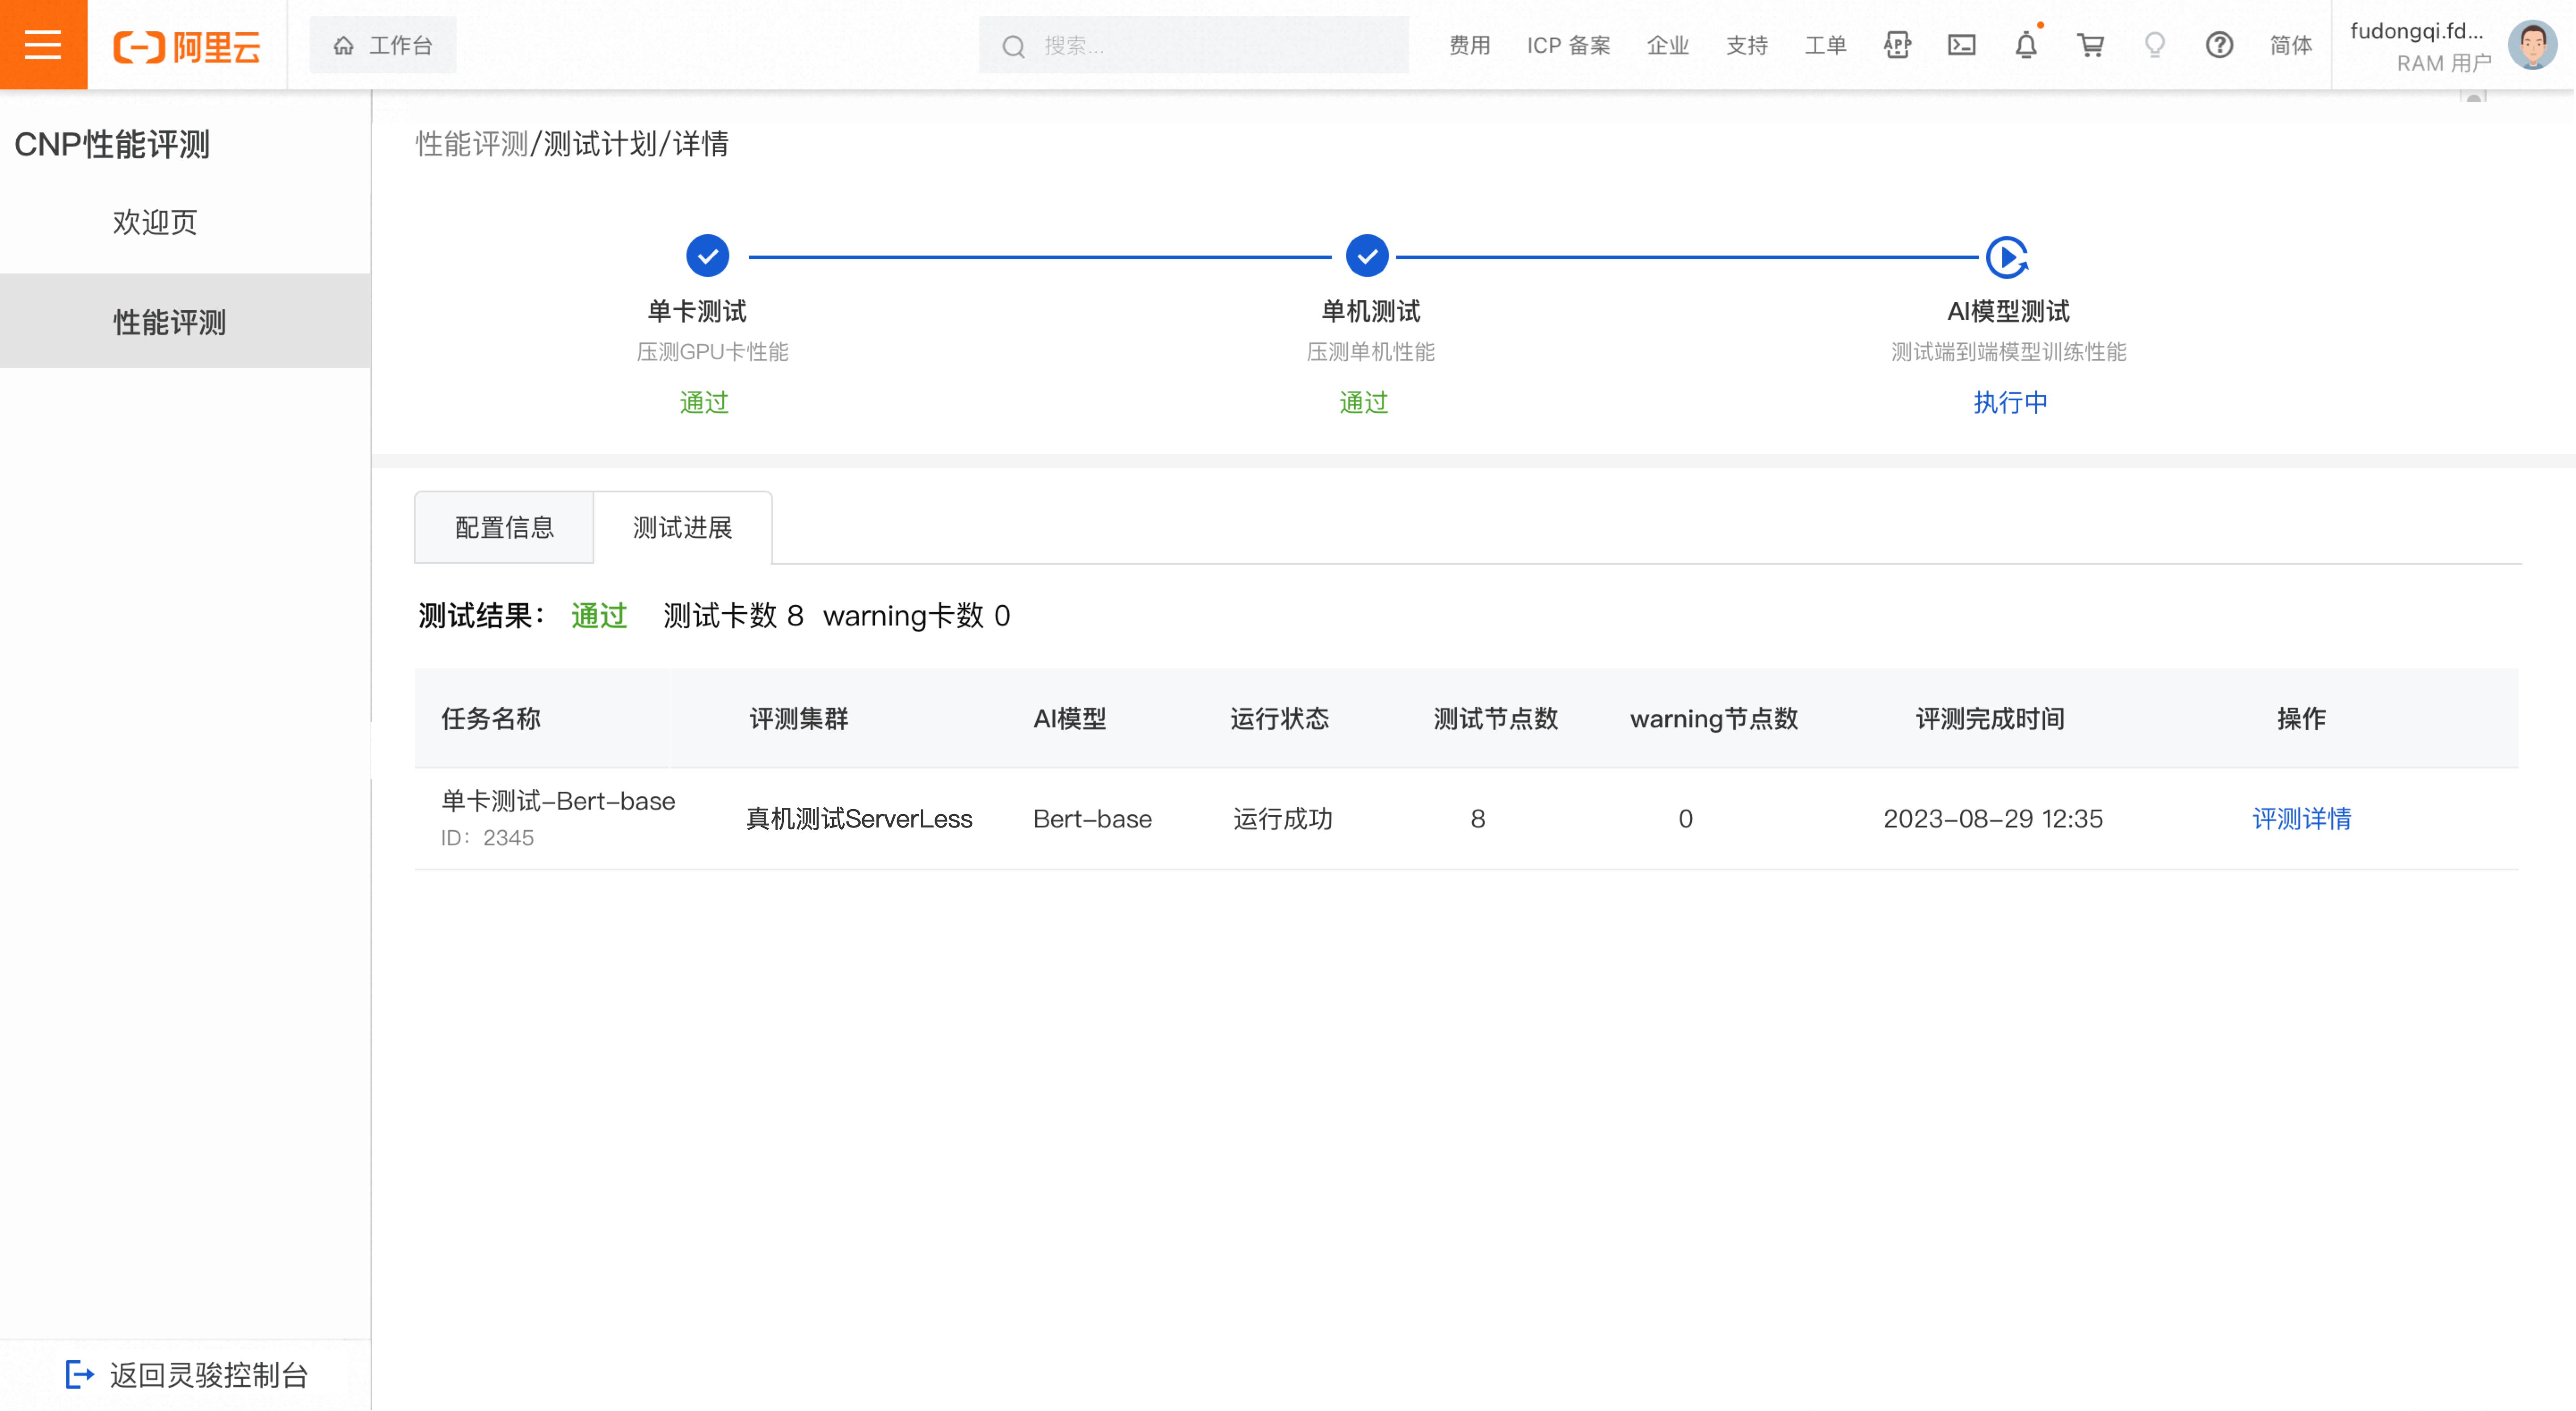
Test passed
The single machine test passes if no suspected faulty nodes or warning nodes are found.
Note-
Suspected faulty node: The DLC job on this node failed, which suggests that the node may be faulty.
-
Warning node: The throughput of this node was outside the normal threshold range for more than 5% of the iterations.
-
Calculation logic for the normal threshold: The median throughput of all nodes in each iteration is used as the baseline. The system compares the baseline ±3% with 4 × sigma (4 × standard deviation). The larger of the two values is used as the normal threshold range.
-
-
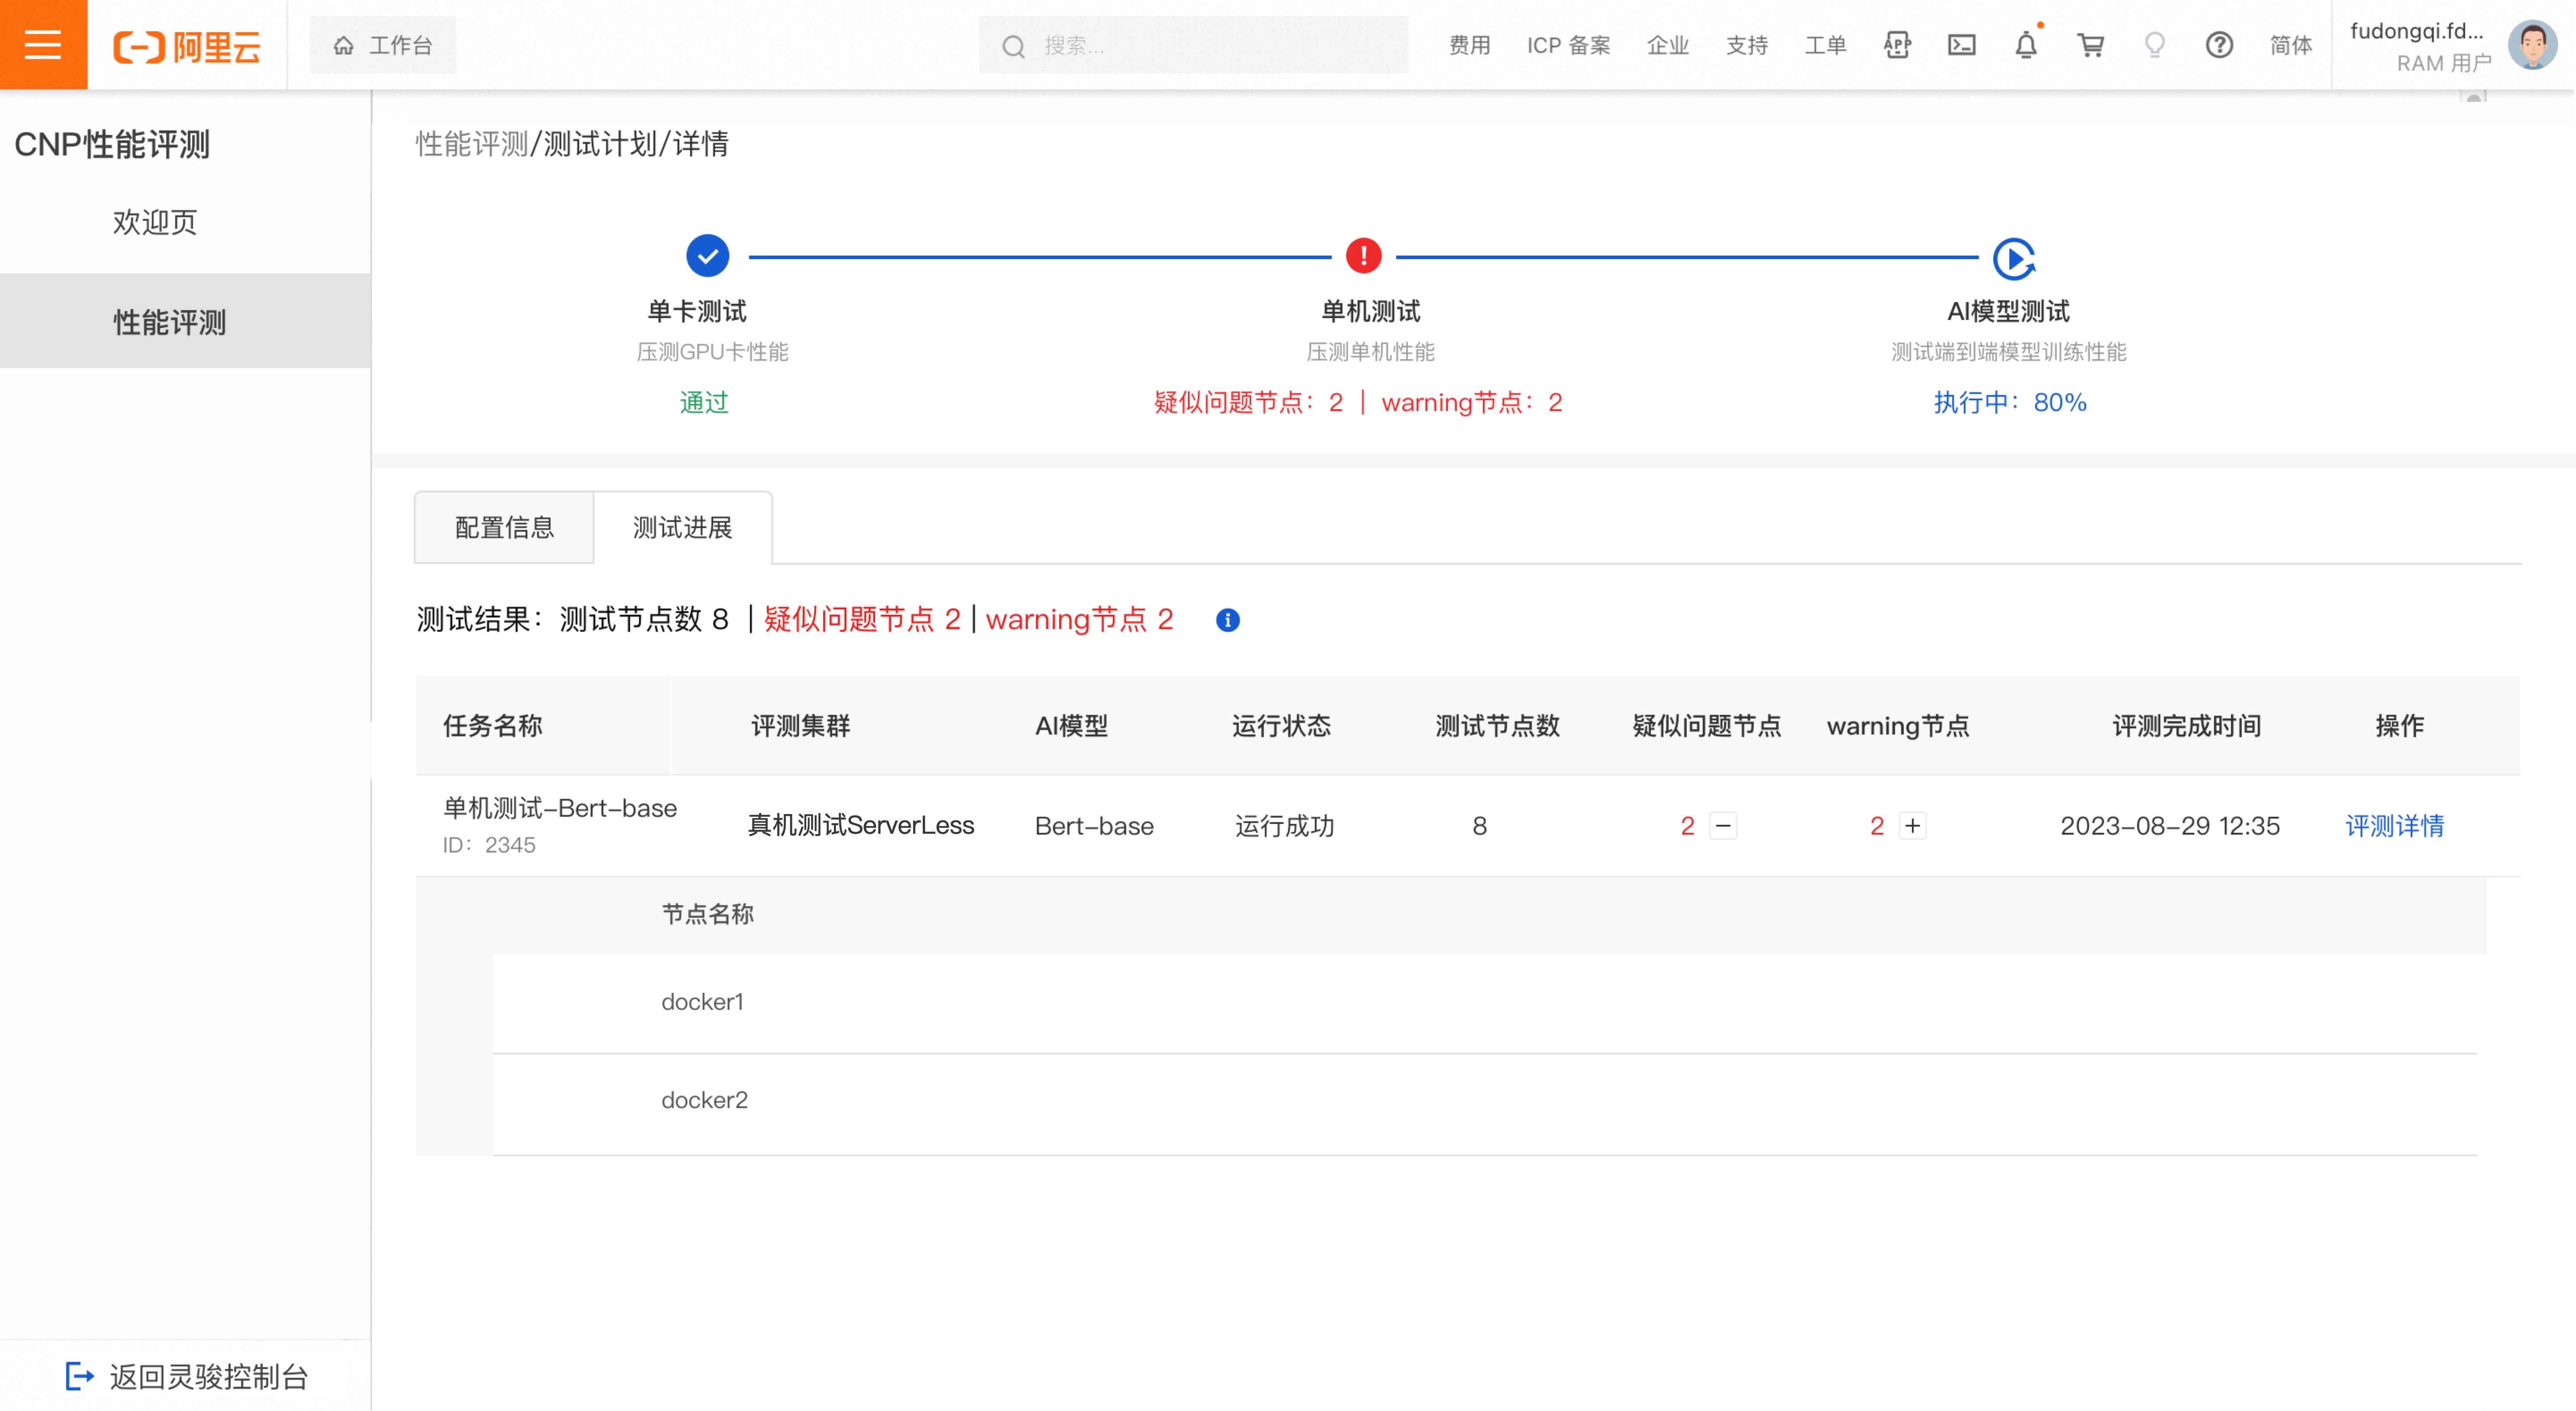
Abnormal test results
The single machine test result is abnormal if a suspected faulty node or a warning node is found.
In the evaluation task list, click the plus icon to expand and view details of suspected faulty or warning nodes. Report abnormal nodes to the O&M team for investigation. Click Evaluation Details to view detailed results.
AI model test
-
Test progress
Pending: All tasks are waiting to be executed.
Completed: All tasks have succeeded, failed, or been stopped.
Stopped: All tasks have been stopped.
Running: Some tasks are completed, and others are pending or running.
-
Test task list
Lists all tasks in the AI model test stage of the current plan. To terminate a running task, click Stop. All tasks can be deleted.
WarningData from deleted or failed tasks is not included in the performance dashboard. Delete tasks with caution.

View the performance dashboard
Access the dashboard
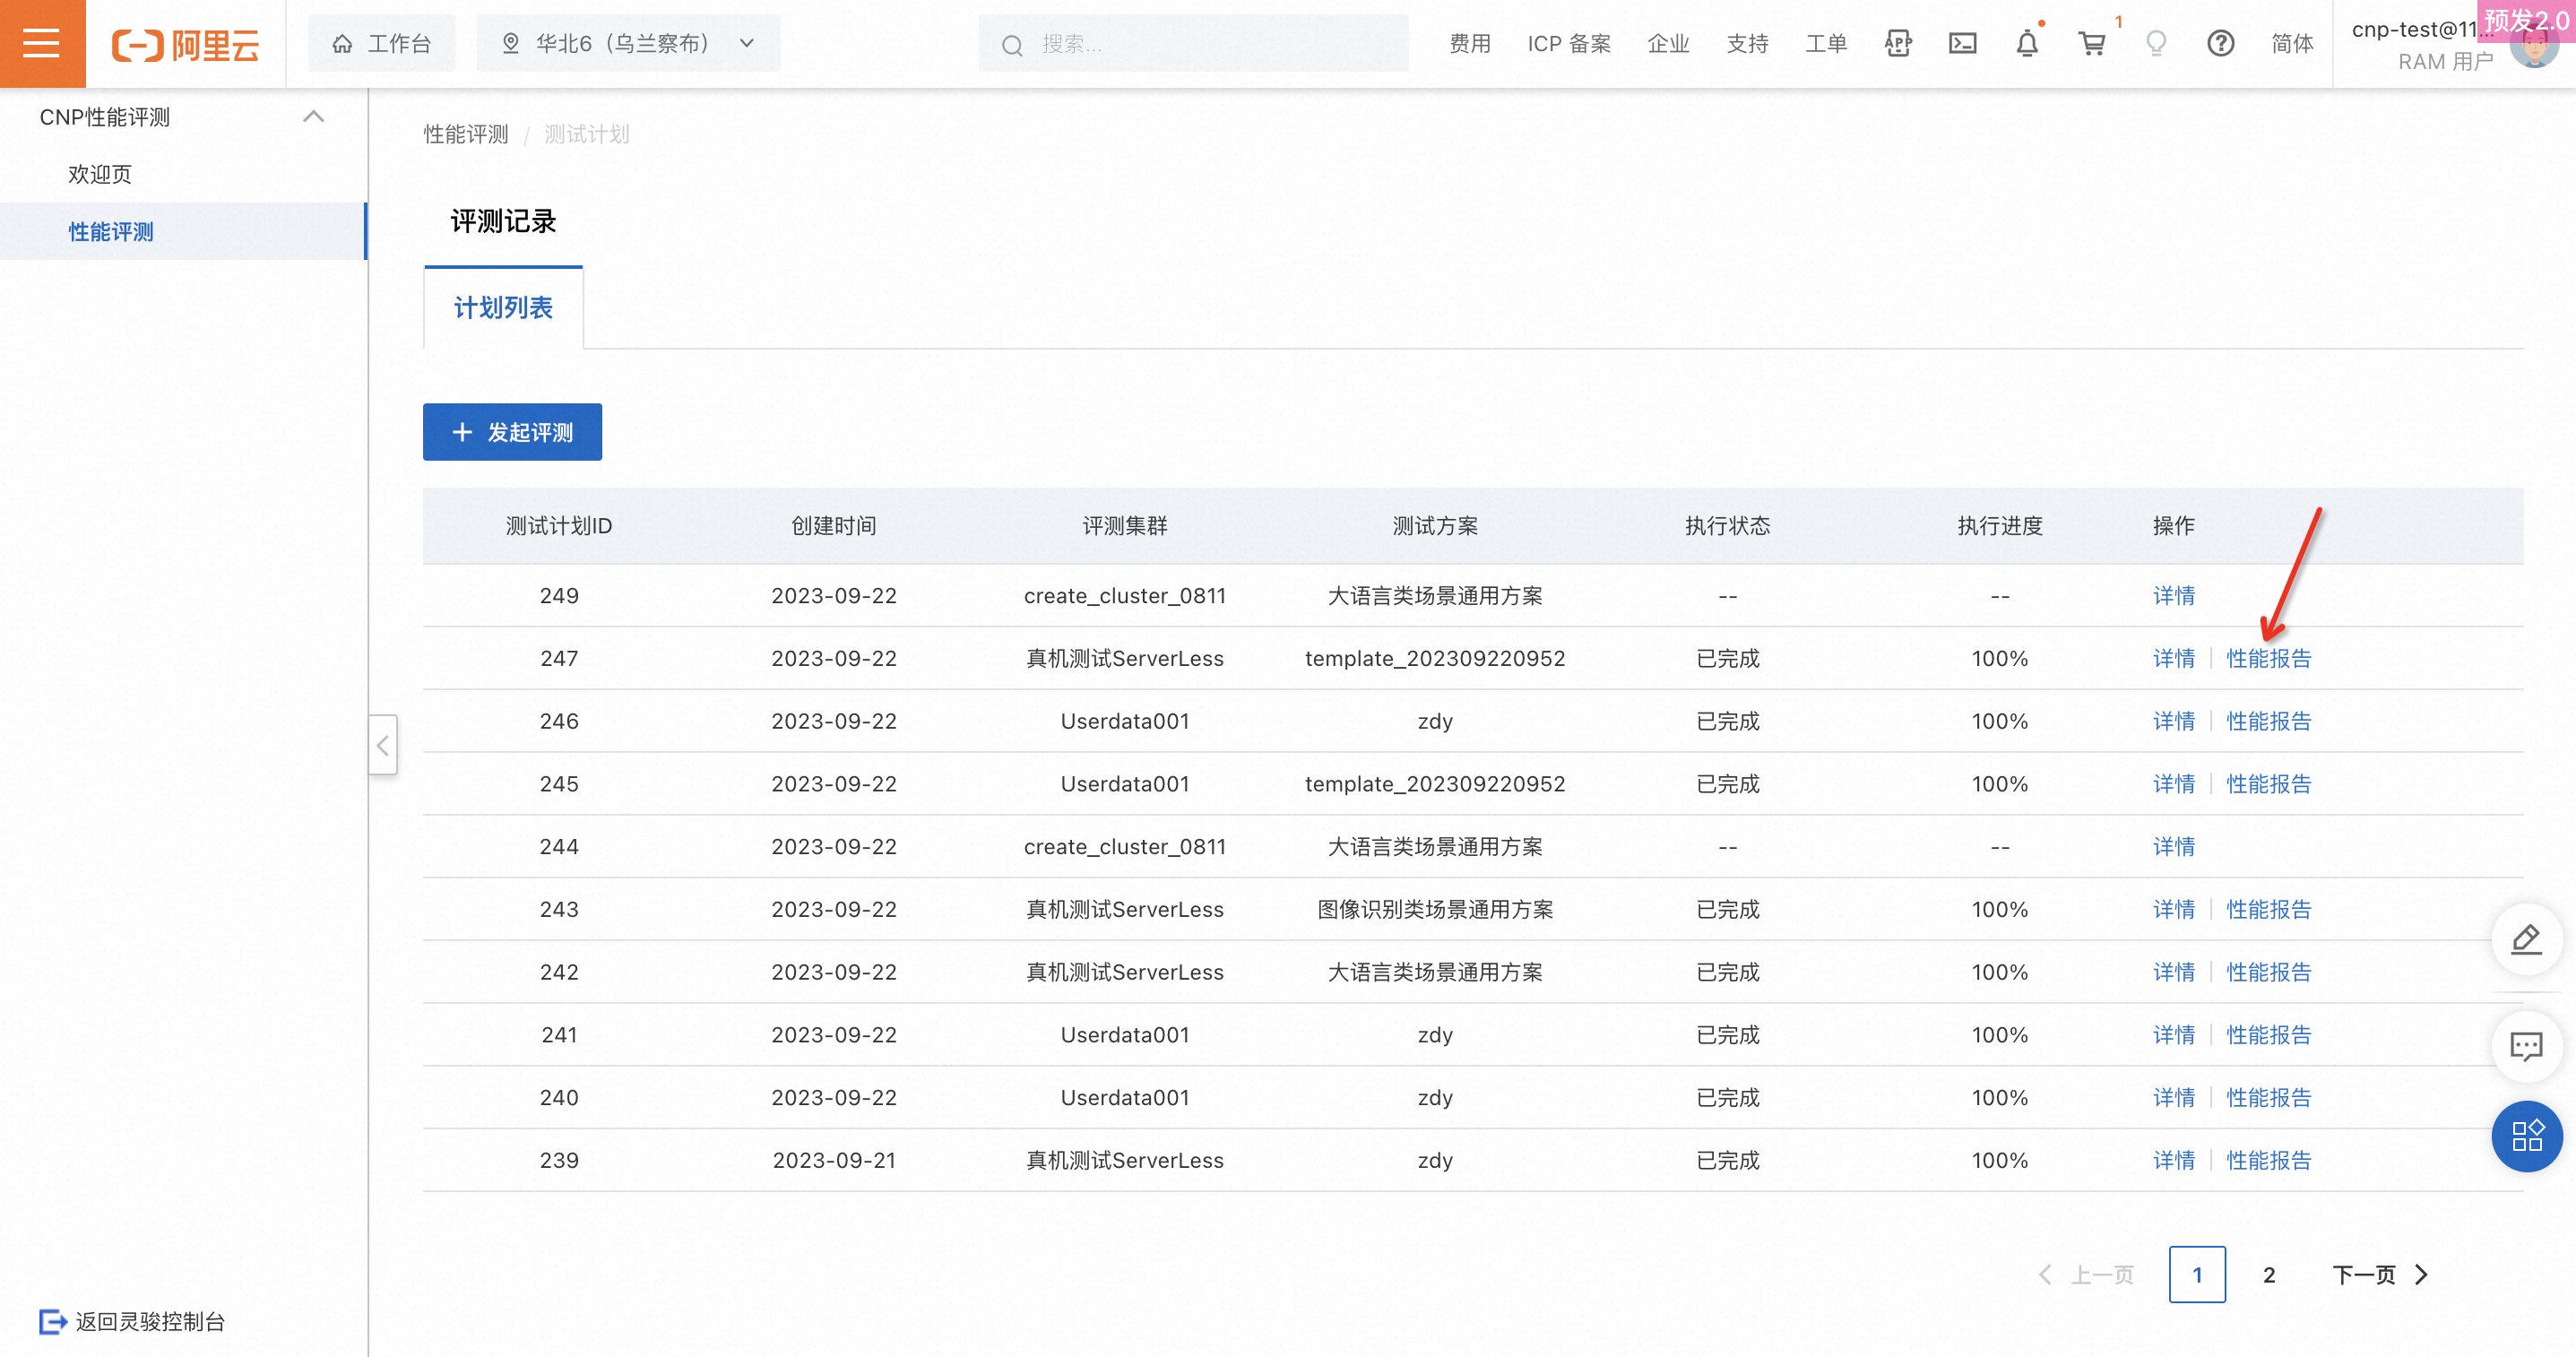
For test plans with a status of Completed, view the performance dashboard. It displays data from successfully completed evaluation tasks in the AI model test stage.
Dashboard content
Scalability of Test Model
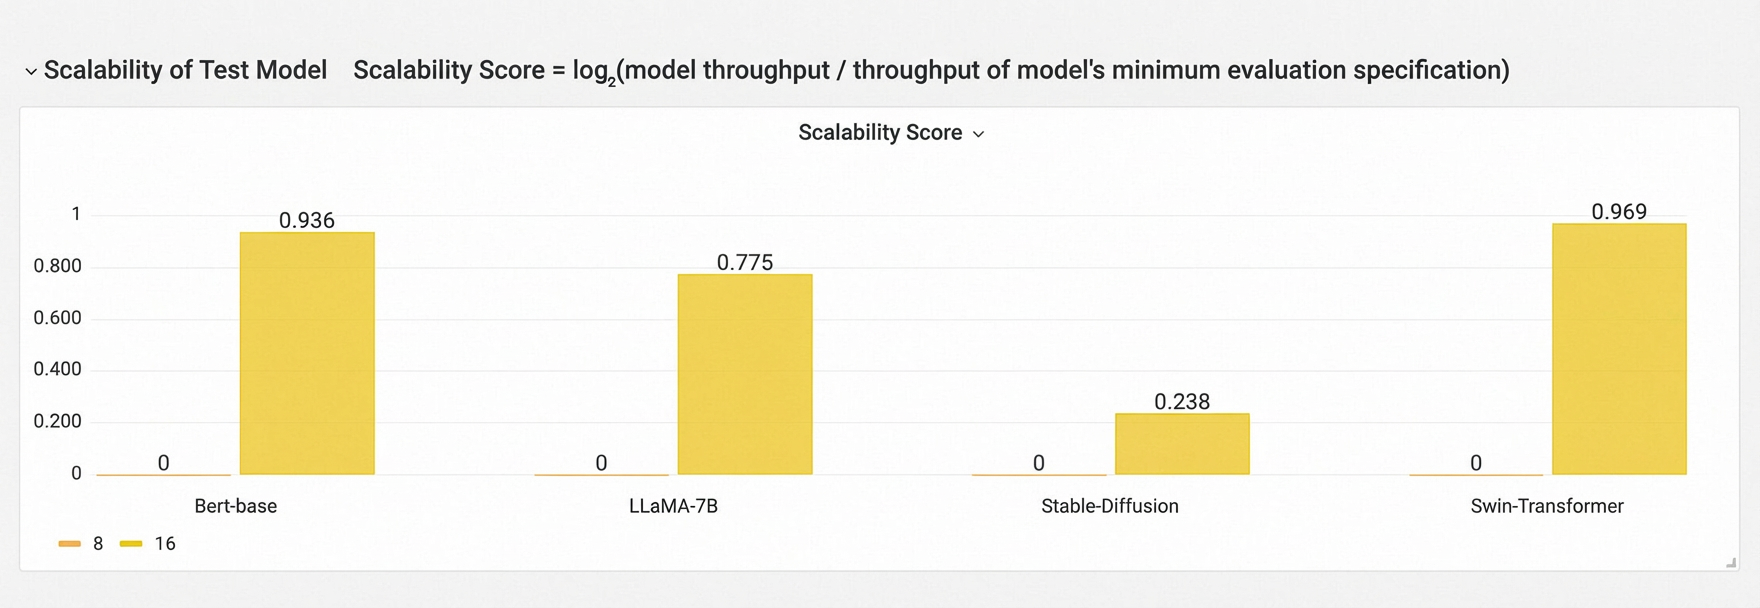
This chart shows the throughput trend for each model as the GPU count increases, reflecting the model's scalability on the cluster. Results of different models are not compared.
Formula: Scalability Score = log₂(Model Throughput / Throughput of the Smallest Evaluated Configuration)
Example: The following example uses the GPT3-175B model with mock data for illustrative purposes only.
|
GPUs |
Throughput |
Scalability Score |
Theoretical Scalability Score |
|
64 |
10 |
||
|
128 |
18 |
log₂(18 / 10) |
log₂ 2 |
|
256 |
35 |
log₂(35 / 10) |
log₂ 4 |
|
512 |
69 |
log₂(69 / 10) |
log₂ 8 |
|
1024 |
137 |
log₂(137 / 10) |
log₂ 16 |
Note: The closer the Scalability Score is to the theoretical Scalability Score, the better the scalability.
Detailed evaluation results
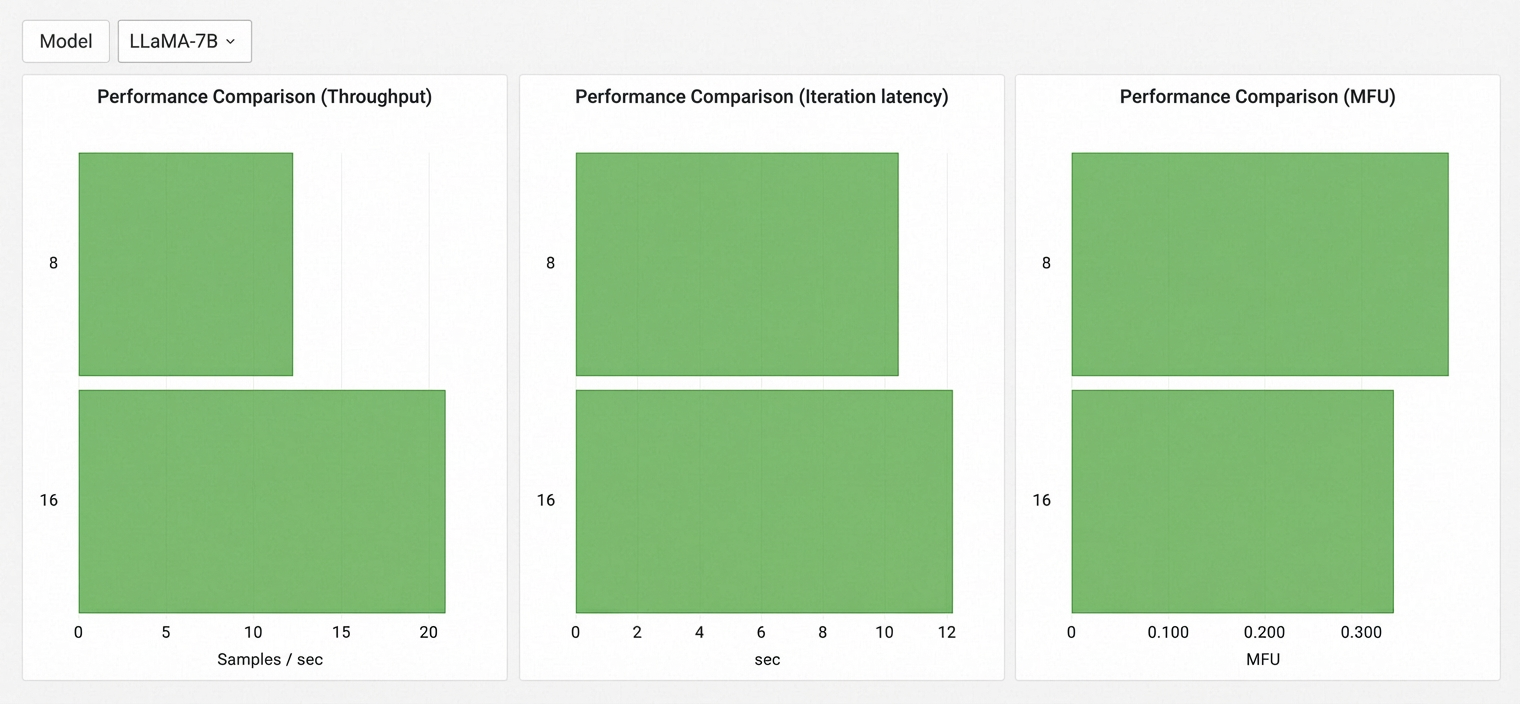
Displays the throughput, MFU, and iteration latency metrics for each model based on the GPU count evaluated. The y-axis represents GPU count, and the x-axis represents the metric value.