PerfTracker is an online performance analysis and diagnostics tool for large-scale model training. When a training job encounters performance issues, PerfTracker collects CUDA kernel and Python function execution records along with hardware monitoring data from every worker, and generates an analysis report that identifies slow nodes, pinpoints bottleneck functions, and detects hang issues.
Limitations
PerfTracker supports only training jobs that use the PyTorch framework.
Features
Key features
-
Online data collection: Collects execution records for all function types (such as CUDA kernel and Python functions) from every worker, along with hardware monitoring data for GPUs, NVLink, PCIe, and DRAM at 100-microsecond precision.
-
Function-level performance analysis: Generates per-function performance reports and automatically diagnoses root causes of performance degradation, including slow nodes and functions with abnormal execution times. Reports also support in-depth manual analysis to guide optimization.
Solution highlights
-
Fine-grained online profiling: Shifts data collection from offline reproduction to real-time, fine-grained capture, improving timeliness and accuracy.
-
Efficient multi-node analysis: Automates performance analysis by codifying expert knowledge into diagnostic algorithms, enabling efficient problem identification and localization.
How it works
PerfTracker has two components: Collector and PerfDisplay. The Collector runs inside the job container, independent of the training process. PerfDisplay provides a local, web-based interface for viewing analysis reports.
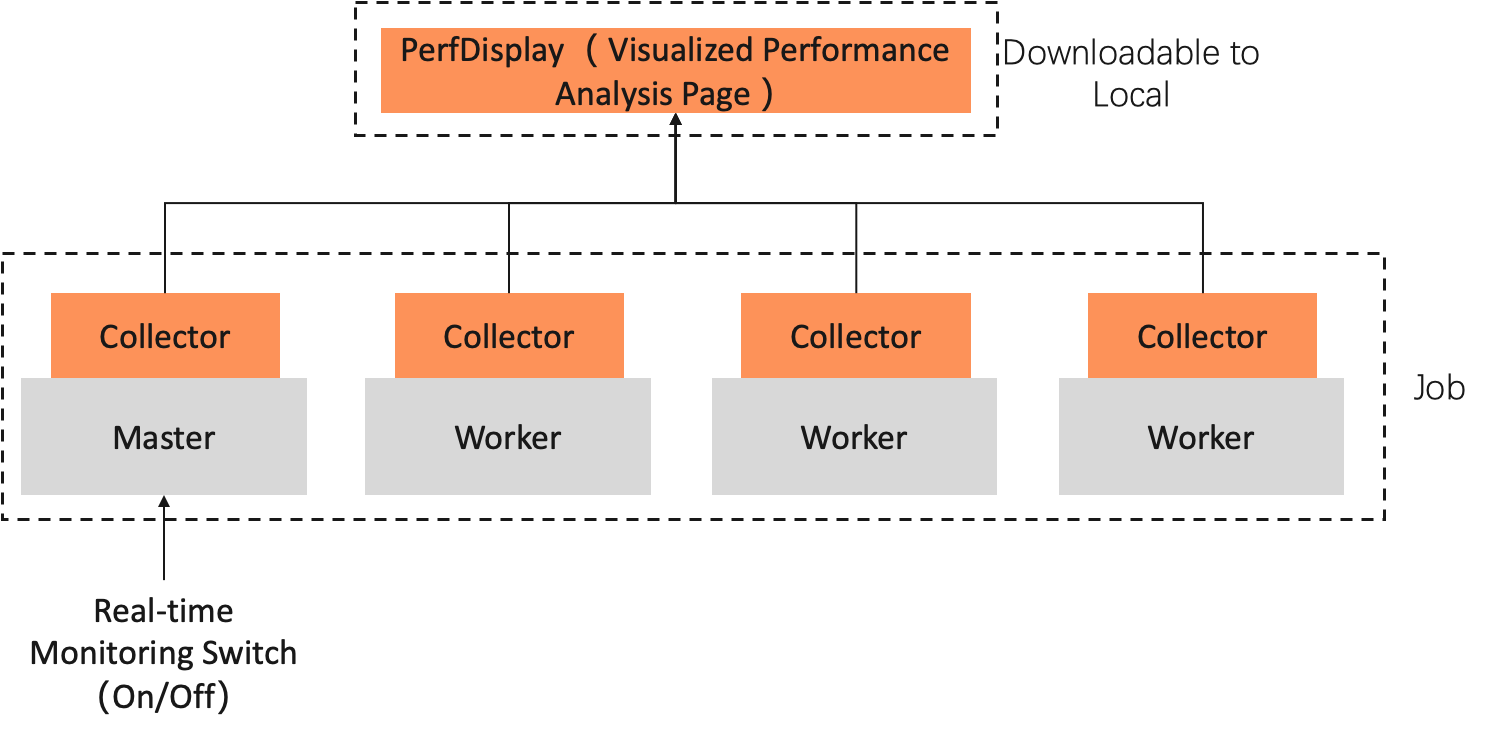
-
PerfTracker Collector: Performs high-precision, full-stack online monitoring by using the Torch profiler API and nsys to collect raw monitoring data, including:
-
Execution records of all runtime functions, including CUDA kernel functions (compute and communication kernels), GPU launch kernel functions, GPU memory operations, and Python functions, providing a 100% accurate record of program behavior for code-level performance analysis.
-
Monitoring data for various hardware metrics, such as GPUs, NVLink, PCIe, and DRAM, at 100-microsecond precision.
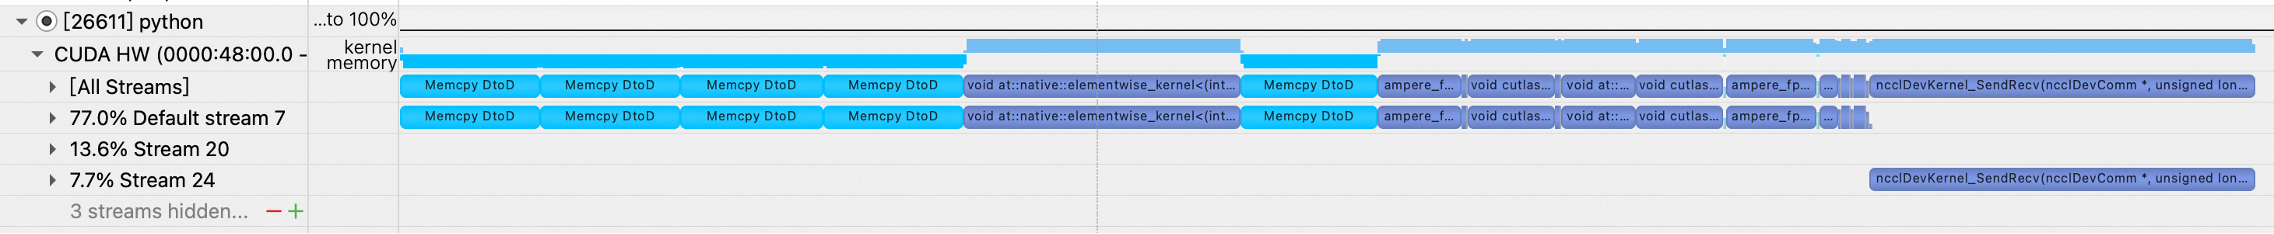
The following figures show examples of the collected data:
-
CUDA kernel functions and GPU memory operations
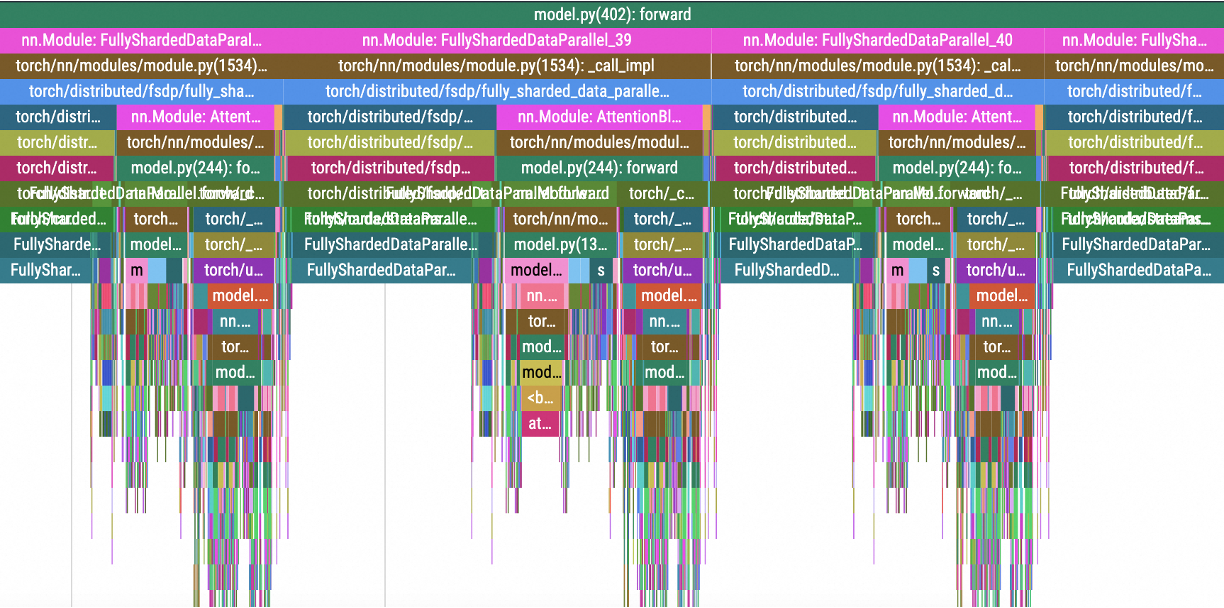
-
Python functions and GPU launch kernels
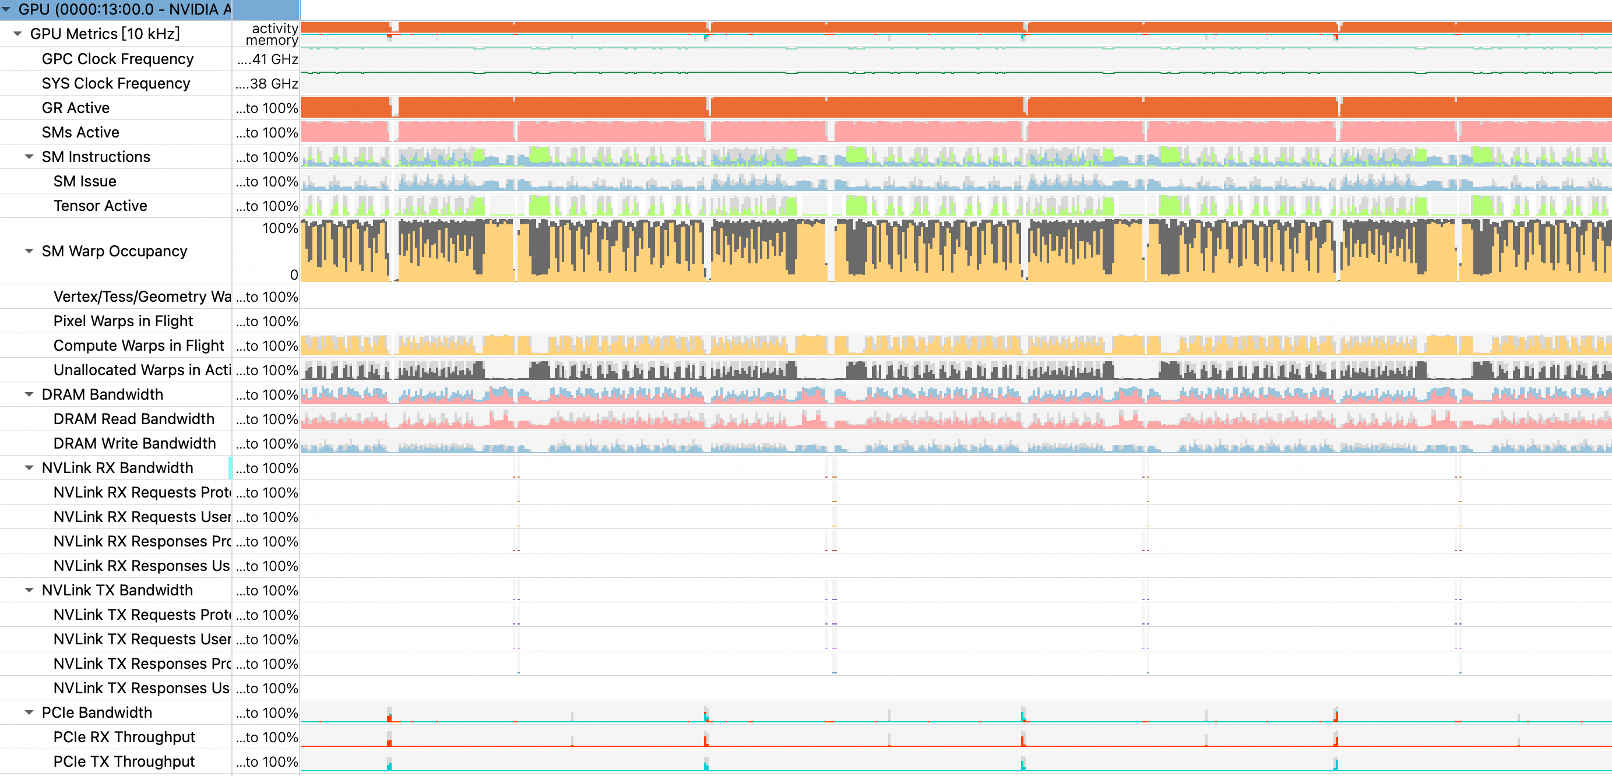
-
Hardware monitoring data
-
-
PerfDisplay: Aggregates and analyzes the collected data to generate performance analysis reports and visualizations.
Procedure
Prepare your training code
-
Modify your training script to import the PerfTracker module and mark each training step.
-
Import the PerfTracker module at the beginning of your training script. The following code provides an example:
try: from c4d_perftracker_collector.PerfTracker import PerfTracker my_tracer = PerfTracker() except: my_tracer = None -
Mark the steps in your training code.
To use PerfTracker, you must mark steps in your training code. Each time
tracer.step()runs, PerfTracker logs the event, allowing the backend to control how many iterations are profiled.while iteration < args.train_iters: ... # Training code if my_tracer is not None: my_tracer.step() # Mark a step
The following
training.pyscript is a simple example that includes the import statement and the step marker:import torch import time import torch.distributed as dist import argparse try: from c4d_perftracker_collector.PerfTracker import PerfTracker my_tracer = PerfTracker() except: my_tracer = None dist.init_process_group("nccl") torch.cuda.set_device(dist.get_rank()) # Check if CUDA is available. if torch.cuda.is_available(): print("CUDA is available!") device = torch.device('cuda') # Use the default CUDA device. else: print("CUDA is not available.") device = torch.device('cpu') # Use the CPU if CUDA is not available. def matmul(): matrix_a = torch.randn(1000, 1000) matrix_b = torch.randn(1000, 1000) # Move the matrices to the CUDA device. matrix_a = matrix_a.to(device) matrix_b = matrix_b.to(device) # Perform matrix multiplication. result = torch.matmul(matrix_a, matrix_b) result_cpu = result.to('cpu') print(result_cpu) del matrix_a, matrix_b, result torch.cuda.empty_cache() for i in range(1000): matmul() time.sleep(dist.get_rank()) print("Epoch:", i) if my_tracer is not None: my_tracer.step() dist.barrier() -
-
Upload your training script (for example, training.py) to a storage directory, such as an Object Storage Service (OSS) bucket.
Create a training job
-
When you create a training job, download and install PerfTracker in the startup command. The other configurations are the same as those for a typical job. After you complete the configuration, click OK to create the job. The following is an example:
Parameter
Description
Environment Information
Image Configuration
Select an image with PyTorch 2.0 or later. This example uses
easyanimate:1.1.5-pytorch2.2.0-gpu-py310-cu118-ubuntu22.04.Storage Mount
Click OSS, select the OSS directory where your training script is located, and set the Mount Path. This example uses
/mnt/data/.Start Command
# Download the PerfTracker installation package.
wget -t 5 -w 2 -P /mnt/data https://network-research-lingjun-open-oss.oss-cn-hangzhou.aliyuncs.com/files/c4d_perftracker_collector-1.4.0-py3-none-any.whl
# Install PerfTracker.
pip3 install /mnt/data/c4d_perftracker_collector-1.4.0-py3-none-any.whl
# Run the training script (for example, training.py).
CUDA_VISIBLE_DEVICES=0,1,2,3,4,5,6,7 torchrun --nproc_per_node=4 /mnt/data/training.py
Replace
/mnt/data/with your dataset mount path.NoteFor large-scale jobs, high-concurrency downloads at startup can be slow. We recommend that you download the PerfTracker package to your storage directory using the command line before you start the job.
Resource Information
Framework
Select PyTorch.
Task Resources
Select a resource specification. This example uses
ecs.gn6e-c12g1.12xlarge. -
While the job is running, click the name of the target job. On the Overview tab, find the master instance in the Instance section and click Access container in the Actions column.
-
Run one of the following commands to save the analysis results. You can use these results to diagnose the cause of performance issues.
-
Option 1: Save only the analysis results, without the raw trace.
c4d_perftracker --trigger-on --auto-analyze --output-dir /mnt/data/ -
Option 2: If you have sufficient storage, such as in Cloud Parallel File Storage (CPFS) or Object Storage Service (OSS), we recommend using the following command to save both the analysis results and the raw trace. This allows for manual confirmation after the initial diagnosis. Note that the trace for a single worker can be several hundred megabytes, so you can manually delete it after diagnosis.
c4d_perftracker --trigger-on --auto-analyze --output-dir /mnt/data/ --save-raw-trace allIn this command,
/mnt/data/specifies the directory where the raw trace is saved. You can set this to your dataset mount path to save the raw trace to your dataset.
After saving the analysis results, view the report in PerfDisplay (see the next section). PerfTracker also provides additional parameters (see the Appendix) to help pinpoint the root cause of performance issues.
-
View the analysis results
-
Refer to Analysis Mode to generate and save the analysis results. After the command runs successfully, the system generates a
<timestamp>/PerfDisplayfolder in the directory. After the analysis is complete, the PerfDisplay/ and raw_trace/ folders are generated in the file list of the OSS Bucket. -
Copy the PerfDisplay folder to the
/mnt/datamount directory of the data source. Refer to the ossutil 2.0 command-line tool to download thePerfDisplayfolder to your local machine. (You can compress the folder before you download it.)tar -cvf trace.tar PerfDisplay/ mv trace.tar /mnt/data -
On your local machine, navigate to the
PerfDisplayfolder and runsudo python3 app.py(you may not needsudoon Linux). Then, open http://127.0.0.1:5000/ in a web browser to view the performance report.
PerfTracker reports on functions that affect job performance and flags anomalies. Functions are organized into the following categories, and the web interface provides interactive options with detailed instructions.
GPU compute functions
GPU Compute:
[2025-03-04 06:04:00,046 PerfTracker] (compute_functions.py 131) INFO: {
    "min/median/max GPU utilization (in [0,1])": [
        0.27586059769318555,
        0.28605496203987174,
        0.2945494558115959
    ],
    "workers with abnormal GPU utilization": {},
    "major_kernel_executions": {
        "void multi_tensor_apply_kernel<TensorListMetadata<4>, AdamFunctor<float, float, int>, float, float, float, float, float, float, adamMode_t, float>(long, int volatile*, TensorListMetadata<4>, AdamFunctor<float, float, int>, float, float, float, float, float, float, adamMode_t, float)320_1_1|512_1_1": {
            "median cost per execution (ms)": 403.7,
            "bottleneck ratio (in [0,1])": 0.01608086667957405
        },
        "sm80_xmma_gemm_f16f16_f16f32_f32_nn_n_tilesize160x128x32_stage4_warpsize2x2x1_tensor16x8x16_kernel7_16_1|128_1_1": {
            "median cost per execution (ms)": 130.0,
            "bottleneck ratio (in [0,1])": 0.015779752711771233
        },
        "ampere_fp16_s16816gemm_fp16_128x128_ldg8_f2f_stages_32x5_nt16_32_1|128_1_1": {
            "median cost per execution (ms)": 132.60000000000002,
            "bottleneck ratio (in [0,1])": 0.013880912782219888
        },
        "void (anonymous namespace)::indexing_backward_kernel<c10::Half, 4>(long const*, long const*, c10::Half const*, c10::Half*, long, long, long, long, bool)256_16_1|32_4_1": {
            "median cost per execution (ms)": 1202.25,
            "bottleneck ratio (in [0,1])": 0.012148757934008617
        },
        "ampere_fp16_s16816gemm_fp16_128x128_ldg8_f2f_stages_32x5_nt16_24_1|128_1_1": {
            "median cost per execution (ms)": 105.6,
            "bottleneck ratio (in [0,1])": 0.005656117080836238
        }
    },
    "workers with potential GPU issues": [],
    "detailed report": {}
}
How to read the report:
-
"min/median/max GPU utilization (in [0,1])": Shows that across all workers, the maximum GPU utilization was 29.4%, the minimum was 27.5%, and the median was 28.6%. -
"workers with abnormal GPU utilization": If empty, no workers have significantly outlier GPU utilization. Otherwise, lists the outlier worker IDs and their GPU utilization. -
"major_kernel_executions": Lists the GPU kernel executions that consumed the most time, including the median cost per execution and the bottleneck ratio (percentage of end-to-end performance). -
"workers with potential GPU issues": Lists worker IDs with slower GPU kernel execution. If empty, all workers are performing normally. -
"detailed report": Appears when"workers with potential GPU issues"is not empty. Specifies which worker executed which kernel function more slowly than normal, and by how much.
GPU memory operations
GPU memory operations:
[2025-03-04 06:04:00,048 PerfTracker] (gpu_mem.py 37) INFO: {
    "Memcpy DtoD (Device -> Device)": {
        "avg bottleneck ratio (in [0,1])": 0.010486858246092,
        "abnormal_workers": {
            "job_x08j11173.cloud.sqa.na131_2_122482.json": 0.010614755325049817,
            "job_x08j11173.cloud.sqa.na131_8_122483.json": 0.0105935370201344,
            "job_x08j11173.cloud.sqa.na131_1_122484.json": 0.010571838319204434,
            "job_x08j11173.cloud.sqa.na131_0_122485.json": 0.010551186610995748,
            "job_x08j11173.cloud.sqa.na131_2_122487.json": 0.010408514784026183,
            "job_x08j11173.cloud.sqa.na131_5_122489.json": 0.010394903160689894,
            "job_x08j11173.cloud.sqa.na131_8_122486.json": 0.010387693451926115,
            "job_x08j11173.cloud.sqa.na131_9_122488.json": 0.010372437296709398
        }
    }
}
How to read the report:
-
"avg bottleneck ratio (in [0,1])": Shows that the average time spent on Memcpy DtoD operations during the monitoring period was 1.048% of end-to-end time. -
"abnormal_workers": Eight workers had abnormal Memcpy DtoD execution times. For GPU memory operations, a bottleneck ratio greater than 0.01 (1%) is considered abnormal.
Collective communication
Communication:
{
    "nvlink ring send": {
        "ncclDevKernel_AllReduce_Sum_f16_RING_LL(ncclDevComm*, unsigned long, ncclWork*)": {
            "example_of_normal_worker": {
                "worker": "job_x08j11173.cloud.sqa.na131_0_66930.json",
                "different from other workers": 0,
                "features": {
                    "bottleneck ratio (in [0,1])": 0.2743985289797289,
                    "avg throughput (%)": 73.75921390374332,
                    "throughput std (%)": 11.384679144385027
                }
            },
            "abnormal_workers": []
        }
    },
    "nvlink ring recv": {
        "ncclDevKernel_AllReduce_Sum_f16_RING_LL(ncclDevComm*, unsigned long, ncclWork*)": {
            "example_of_normal_worker": {
                "worker": "job_x08j11173.cloud.sqa.na131_3_66933.json",
                "different from other workers": 2,
                "features": {
                    "bottleneck ratio (in [0,1])": 0.27346865947352955,
                    "avg throughput (%)": 72.70337362637363,
                    "throughput std (%)": 12.658093406593407
                }
            },
            "abnormal_workers": []
        }
    },
    "pcie sendrecv send": {
        "ncclDevKernel_SendRecv(ncclDevComm*, unsigned long, ncclWork*)": {
            "example_of_normal_worker": {
                "worker": "job_x08j11173.cloud.sqa.na131_0_66930.json",
                "different from other workers": 3,
                "features": {
                    "bottleneck ratio (in [0,1])": 0.07248997985478658,
                    "avg throughput (%)": 46.667,
                    "throughput std (%)": 14.636000000000001
                }
            },
            "abnormal_workers": []
        }
    },
    "pcie sendrecv recv": {
        "ncclDevKernel_SendRecv(ncclDevComm*, unsigned long, ncclWork*)": {
            "example_of_normal_worker": {
                "worker": "job_x08j11173.cloud.sqa.na131_7_66936.json",
                "different from other workers": 1,
                "features": {
                    "bottleneck ratio (in [0,1])": 0.0643436909425455,
                    "avg throughput (%)": 54.833333333333336,
                    "throughput std (%)": 14.166666666666666
                }
            },
            "abnormal_workers": []
        }
    },
    "pcie ring send": {
        "ncclDevKernel_AllReduce_Sum_f16_RING_LL(ncclDevComm*, unsigned long, ncclWork*)": {
            "example_of_normal_worker": {
                "worker": "job_x08j11173.cloud.sqa.na131_0_66930.json",
                "different from other workers": 0,
                "features": {
                    "bottleneck ratio (in [0,1])": 0.2743985289797289,
                    "avg throughput (%)": 41.36698734177215,
                    "throughput std (%)": 14.653768987341774
                }
            },
            "abnormal_workers": []
        }
    },
    "pcie ring recv": {
        "ncclDevKernel_AllReduce_Sum_f16_RING_LL(ncclDevComm*, unsigned long, ncclWork*)": {
            "example_of_normal_worker": {
                "worker": "job_x08j11173.cloud.sqa.na131_0_66930.json",
                "different from other workers": 0,
                "features": {
                    "bottleneck ratio (in [0,1])": 0.2743985289797289,
                    "avg throughput (%)": 41.5311475409836,
                    "throughput std (%)": 15.282721311475411
                }
            },
            "abnormal_workers": []
        }
    }
}
This report categorizes collective communication functions by type and provides performance analysis for each.
-
"example_of_normal_worker"shows the normal performance parameters for the function, including its bottleneck ratio (share of end-to-end time excluding overlap with computation), average throughput, and throughput standard deviation. -
"abnormal_workers", if not empty, lists workers with abnormal performance for that communication function and their metrics.
CUDA runtime
CUDA Runtime:
[2025-03-04 06:04:00,047 PerfTracker] (cuda_runtimes.py 43) INFO: {
    "cudaLaunchKernel": {
        "avg bottleneck ratio (in [0,1])": 0.039727736621541394,
        "avg execution time / monitoring duration (in [0,1])": 0.06956947111288565,
        "abnormal_workers": {
            "job_x08j11173.cloud.sqa.na131_5_122489.json": 0.05342638907019616,
            "job_x08j11173.cloud.sqa.na131_8_122483.json": 0.05125160206973098,
            "job_x08j11173.cloud.sqa.na131_2_122487.json": 0.04770049253555521,
            "job_x08j11173.cloud.sqa.na131_8_122486.json": 0.04358845044879828,
            "job_x08j11173.cloud.sqa.na131_0_122485.json": 0.042635952262081556,
            "job_x08j11173.cloud.sqa.na131_9_122488.json": 0.0354174573296689,
            "job_x08j11173.cloud.sqa.na131_1_122484.json": 0.023585242093250733,
            "job_x08j11173.cloud.sqa.na131_2_122482.json": 0.02021630716304934
        }
    }
}
How to read the report:
-
"avg bottleneck ratio (in [0,1])": Shows that the average time spent on cudaLaunchKernel during the monitoring period was 3.97% (excluding overlap with computation). -
"avg execution time / monitoring duration (in [0,1])": Shows that the average time spent on cudaLaunchKernel was 6.95% of the total monitoring duration (including overlap with computation). -
"abnormal_workers": Eight workers had abnormal cudaLaunchKernel execution times. For CUDA runtime functions, a bottleneck ratio greater than 0.01 (1%) is considered abnormal.
Python functions
Python functions:
[2025-03-04 06:04:00,048 PerfTracker] (python_functions.py 43) INFO: {
    "pretrain_gpt.py: <module>|megatron/training.py: pretrain|megatron/training.py: train|megatron/training.py: train_step|megatron/core/pipeline_parallel/schedules.py: forward_backward_pipelining_without_interleaving|megatron/core/pipeline_parallel/schedules.py: backward_step|megatron/core/pipeline_parallel/schedules.py: custom_backward|<built-in method run_backward of torch._C._EngineBase object at 0x>": {
        "job_x08j11173.cloud.sqa.na131_2_122487.json": 0.16970858578301054,
        "job_x08j11173.cloud.sqa.na131_5_122489.json": 0.16821543761561655,
        "job_x08j11173.cloud.sqa.na131_0_122485.json": 0.16787961852913025,
        "job_x08j11173.cloud.sqa.na131_8_122483.json": 0.16769273336153187,
        "job_x08j11173.cloud.sqa.na131_8_122486.json": 0.14482595694389258,
        "job_x08j11173.cloud.sqa.na131_9_122488.json": 0.10359829140378449,
        "job_x08j11173.cloud.sqa.na131_1_122484.json": 0.06543764774209325,
        "job_x08j11173.cloud.sqa.na131_2_122482.json": 0.06217541348063737
    },
    "pretrain_gpt.py: <module>|megatron/training.py: pretrain|megatron/training.py: train|megatron/training.py: train_step|megatron/core/pipeline_parallel/schedules.py: forward_backward_pipelining_without_interleaving|megatron/core/pipeline_parallel/schedules.py: forward_step|pretrain_gpt.py: forward_step|nn.Module: DistributedDataParallel_0|torch/nn/modules/module.py: _call_impl|megatron/core/distributed/distributed_data_parallel.py: forward|nn.Module: Float16Module_0|torch/nn/modules/module.py: _call_impl|megatron/model/module.py: forward|nn.Module: GPTModel_0|torch/nn/modules/module.py: _call_impl|megatron/model/gpt_model.py: forward|nn.Module: TransformerLanguageModel_0|torch/nn/modules/module.py: _call_impl|megatron/model/language_model.py: forward|nn.Module: ParallelTransformer_0|torch/nn/modules/module.py: _call_impl|megatron/model/transformer.py: forward": {
        "job_x08j11173.cloud.sqa.na131_9_122488.json": 0.02471835416438489,
        "job_x08j11173.cloud.sqa.na131_0_122485.json": 0.02022024568555683,
        "job_x08j11173.cloud.sqa.na131_2_122482.json": 0.015394834126935101,
        "job_x08j11173.cloud.sqa.na131_2_122487.json": 0.011625367332189284
    },
    "pretrain_gpt.py: <module>|megatron/training.py: pretrain|megatron/training.py: train|megatron/training.py: train_step": {
        "job_x08j11173.cloud.sqa.na131_0_122485.json": 0.012272193902698852
    },
    "autograd::engine::evaluate_function: LinearWithGradAccumulationAndAsyncCommunicationBackward|LinearWithGradAccumulationAndAsyncCommunicationBackward|torch/autograd/function.py: apply|torch/cuda/amp/autocast_mode.py: decorate_bwd|megatron/core/tensor_parallel/layers.py: backward|<built-in method matmul of Tensor object at 0x>|aten::matmul|aten::mm": {
        "job_x08j11173.cloud.sqa.na131_2_122487.json": 0.014066713574814782,
        "job_x08j11173.cloud.sqa.na131_0_122485.json": 0.013168949365116213,
        "job_x08j11173.cloud.sqa.na131_8_122483.json": 0.013000378454189552,
        "job_x08j11173.cloud.sqa.na131_5_122489.json": 0.012500119397472594,
        "job_x08j11173.cloud.sqa.na131_8_122486.json": 0.012470581043494208
    },
    "autograd::engine::evaluate_function: FastLayerNormFNBackward|FastLayerNormFNBackward|torch/autograd/function.py: apply|apex/contrib/layer_norm/layer_norm.py: backward|<built-in method ln_bwd of PyCapsule object at 0x>": {
        "job_x08j11173.cloud.sqa.na131_0_122485.json": 0.010127612754279463
    },
    "pretrain_gpt.py: <module>|megatron/training.py: pretrain|megatron/training.py: train|megatron/training.py: train_step|megatron/core/pipeline_parallel/schedules.py: forward_backward_pipelining_without_interleaving": {
        "job_x08j11173.cloud.sqa.na131_2_122487.json": 0.01041679269251709
    },
    "autograd::engine::evaluate_function: torch::autograd::AccumulateGrad": {
        "job_x08j11173.cloud.sqa.na131_8_122486.json": 0.013633967050768714
    }
}
This report lists Python functions that consume more than 1% of the total runtime, excluding time that overlaps with GPU computation, communication, and other operations. Functions are clustered by name, and for each cluster, all workers exceeding the 1% threshold are listed with their time percentages.
Appendix
PerfTracker CLI parameters
References
For a detailed explanation of PerfTracker's methodology, see PerfTracker: Online Performance Troubleshooting for Large-scale Model Training in Production.