Random Forest Feature Importance Evaluation is a method for analyzing the contribution of each feature to the prediction results in a random forest model. It determines feature importance by calculating the mean decrease in impurity for each feature across all decision trees or using permutation importance. This process helps identify features with the greatest impact on model performance.
Component configuration
Method 1: GUI method
In Machine Learning Designer, add the Random Forest Feature Importance Evaluation component to your pipeline and configure its parameters in the right-side pane:
|
Tab |
Parameter |
Description |
|
Field Settings |
Feature Columns |
The feature columns to use from the input table. This parameter is optional. By default, all columns except the label column are selected. |
|
Target Column |
Required. |
|
|
Parameter Settings |
Parallel Computing Cores |
The number of cores for parallel computing. |
|
Memory Size per Core |
The memory size per core, in MB. |
Method 2: PAI command
You can configure the Random Forest Feature Importance Evaluation component by running a PAI command in the SQL Script component. For more information, see Scenario 4: Execute PAI commands in the SQL Script component.
pai -name feature_importance -project algo_public
    -DinputTableName=pai_dense_10_10
    -DmodelName=xlab_m_random_forests_1_20318_v0
    -DoutputTableName=erkang_test_dev.pai_temp_2252_20319_1
    -DlabelColName=y
    -DfeatureColNames="pdays,previous,emp_var_rate,cons_price_idx,cons_conf_idx,euribor3m,nr_employed,age,campaign,poutcome"
-Dlifecycle=28 ;|
Parameter |
Required |
Default |
Description |
|
inputTableName |
Yes |
None |
The name of the input table. |
|
outputTableName |
Yes |
None |
The name of the output table. |
|
labelColName |
Yes |
None |
The name of the label column in the input table. |
|
modelName |
Yes |
None |
The name of the input model. |
|
featureColNames |
No |
All columns except the label column |
The feature columns to use from the input table. |
|
inputTablePartitions |
No |
The entire table |
The partitions to use from the input table. |
|
lifecycle |
No |
Not specified |
The lifecycle of the output table. |
|
coreNum |
No |
Calculated automatically |
The number of cores. |
|
memSizePerCore |
No |
Calculated automatically |
The memory size per core, in MB. |
Example
-
Use an SQL statement to generate training data.
This example creates a table named
pai_dense_10_10by selecting specific columns and the first 10 rows from thebank_datatable. You can create a table based on your actual business needs.drop table if exists pai_dense_10_10; create table pai_dense_10_10 as select age,campaign,pdays, previous, poutcome, emp_var_rate, cons_price_idx, cons_conf_idx, euribor3m, nr_employed, y from bank_data limit 10; -
Build the pipeline. For more information, see Custom pipelines.
Set
yas the label column, and all other columns as feature columns. For the Columns Forced to Convert parameter, selectageandcampaignto process them as enumerated features. Use the default values for all other parameters.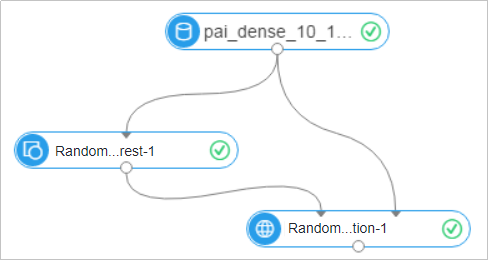
-
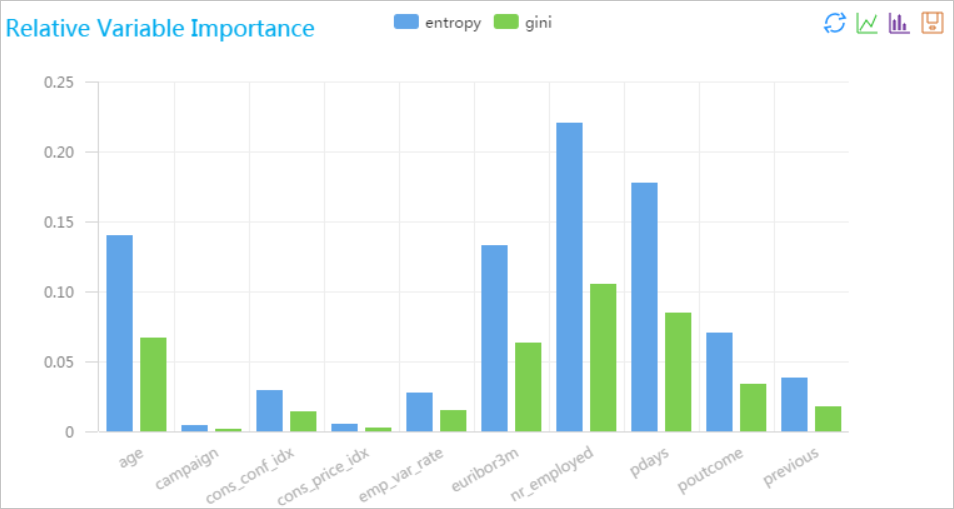
Run the pipeline and view the results. The following output shows the feature importance values generated by the Random Forest Feature Importance Evaluation component.
colname gini entropy age 0.06625000000000003 0.13978726292803723 campaign 0.00175000000000003 0.00434851554559677 cons_conf_idx 0.01399999999999999 0.0290840949701885 cons_price_idx 0.002 0.00498044991346125 emp_var_rate 0.01470000000000003 0.0267863068026093 euribor3m 0.06300000000000003 0.132193634884603 nr_employed 0.10499999999999998 0.220322724807673 pdays 0.0845 0.177503292343975 poutcome 0.03360000000000001 0.070503271938455 previous 0.01770000000000004 0.038103810058015 -
After the run completes, right-click the Random Forest Feature Importance Evaluation component and select View Analytics Report.