Feature engineering
This tutorial uses feature engineering tailored to recommendation algorithms to process original datasets (including user, item, and behavior tables) and generate new feature tables for subsequent recall and ranking.
Prerequisites
-
PAI (Designer) is activated and a default workspace is created. For more information, see Activate PAI and create a default workspace.
-
MaxCompute compute resources are bound to your workspace. For more information, see Manage compute resources for a workspace.
-
A MaxCompute data source is created and bound as the engine for the workspace. For more information, see Create a MaxCompute data source.
Datasets
The user, item, and behavior tables used in this tutorial are generated by a script for demonstration purposes and do not contain real data.
User table
|
Parameter |
Type |
Description |
|
user_id |
bigint |
The unique ID of the user. |
|
gender |
string |
The gender of the user. |
|
age |
bigint |
The age of the user. |
|
city |
string |
The city where the user resides. |
|
item_cnt |
bigint |
The number of items created by the user. |
|
follow_cnt |
bigint |
The number of users that this user follows. |
|
follower_cnt |
bigint |
The number of followers. |
|
register_time |
bigint |
The registration time. |
|
tags |
string |
The user tags. |
|
ds |
string |
The partition key of the table. |
Item table
|
Parameter |
Type |
Description |
|
item_id |
bigint |
The unique ID of the item. |
|
duration |
double |
The video duration. |
|
title |
string |
The title. |
|
category |
string |
The primary category. |
|
author |
bigint |
The author. |
|
click_count |
bigint |
The total number of clicks. |
|
praise_count |
bigint |
The total number of likes. |
|
pub_time |
bigint |
The publication time. |
|
ds |
string |
The partition key of the table. |
Behavior table
|
Parameter |
Type |
Description |
|
request_id |
bigint |
The request ID or tracking ID. |
|
user_id |
bigint |
The unique ID of the user. |
|
exp_id |
string |
The experiment ID. |
|
page |
string |
The page. |
|
net_type |
string |
The network type. |
|
event_time |
bigint |
The time when the event occurred. |
|
item_id |
bigint |
The item ID. |
|
event |
string |
The event type. |
|
playtime |
double |
The playback or reading duration. |
|
ds |
string |
The partition key of the table. |
Procedure
Step 1: Go to the Designer page
-
Log on to the PAI console.
-
In the left-side navigation pane, click Workspaces. On the Workspaces page, click the name of the workspace that you want to manage.
-
In the left-side navigation pane of the workspace, choose Model Development and Training > Visualized Modeling (Designer).
Step 2: Build the pipeline
-
On the Designer page, click the Preset Templates tab.
-
In the Recommended solution-feature engineering section, click Create.
-
In the Create pipeline dialog box, configure the parameters. You can use the default settings.
The Pipeline data storage parameter specifies an OSS bucket path to store temporary data and models that are generated during the pipeline run.
-
Click OK.
The pipeline is created in about 10 seconds.
-
In the pipeline list, double-click the Recommended solution-feature engineering pipeline to open it.
-
The system automatically builds the pipeline based on the template, as shown in the following figure.
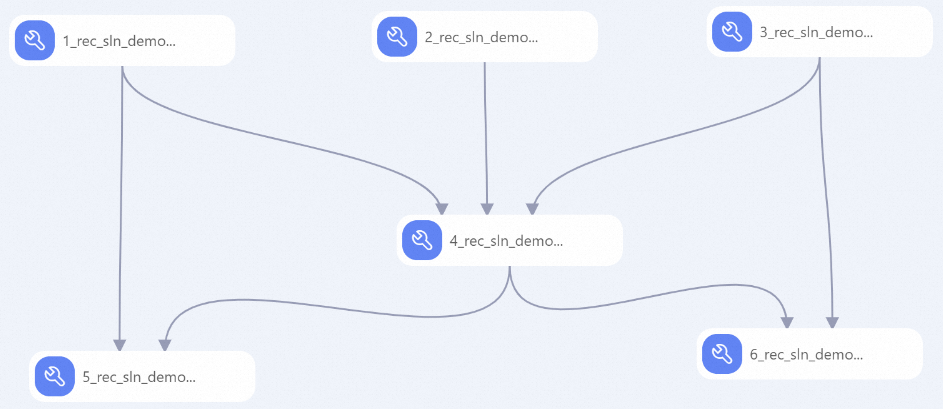
Component
Description
1
Preprocesses the item table:
-
Replaces the tag feature separator with
chr(29)for the feature generation (FG) step. -
Generates a feature that indicates whether an item is new.
2
Preprocesses the behavior table: Generates time-derived features, such as day_h and week_day, from the event time.
3
Preprocesses the user table:
-
Generates a feature that indicates whether a user is new.
-
Replaces the tag feature separator with
chr(29)for the feature generation (FG) step.
4
Joins the behavior, user, and item tables to create a wide behavior log table with statistical attributes.
5
Generates the item feature table, which contains statistical features for items over a specific period:
-
item__{event}_cnt_{N}d: The number of times a specific event occurred on an item within N days. This indicates the item's popularity. -
item__{event}_{itemid}_dcnt_{N}d: The number of unique users who interacted with the item for a specific event within N days. This indicates the item's popularity. -
item__{min|max|avg|sum}_{field}_{N}d: The statistical distribution (min, max, avg, or sum) of a user's numeric attribute for positive interactions with an item within N days. This indicates the preferences of users with specific numeric attributes. -
item__kv_{cate}_{event}_{N}d: The statistics of a user's categorical attribute for a specific event on an item within N days. This indicates the preferences of users with specific categorical attributes.
6
Generates the user feature table, which contains statistical features for users over a specific period.
-
Step 3: Add a custom function
-
Create a workflow. For more information, see Create a workflow.
-
Right-click MaxCompute under the created workflow and choose New Resource > Python to create a Python script resource named count_cates_kvs.py. For more information, see Create and use MaxCompute resources.
-
Right-click MaxCompute under the created workflow and choose New Function. Create a MaxCompute function named COUNT_CATES_KVS. Set Class name to
count_cates_kvs.CountCatesKVSand Resource list tocount_cates_kvs.py. For more information, see Create and use custom functions.
Step 4: Run the pipeline and view the results
By default, this pipeline processes 45 days of data, which can take a long time to run. To complete the run faster, you can reduce the amount of data processed as follows:
-
Update the execution time window parameters to use data from a shorter period.
-
Click each of the following components, and on the Parameters tab on the right, change the Execution Time Window parameter from the default
(-45,0]to(-9,0]:-
1_rec_sln_demo_item_table_preprocess_v2 -
2_rec_sln_demo_behavior_table_preprocess_v2 -
3_rec_sln_demo_user_table_preprocess_v2 -
4_rec_sln_demo_behavior_table_preprocess_wide_v2
-
-
Click each of the following components, and on the Parameters tab on the right, change the Execution Time Window parameter from
(-31,0]to(-8,0]:-
5_rec_sln_demo_item_table_preprocess_all_feature_v2 -
6_rec_sln_demo_user_table_preprocess_all_feature_v2
-
-
-
Modify the SQL script to select a smaller sample of users.
-
Click the node
2_rec_sln_demo_behavior_table_preprocess_ v2, and on the Parameters tab on the right, change line 32 of the code for the SQL Script parameter fromWHERE ds = '${pai.system.cycledate}'toWHERE ds = '${pai.system.cycledate}' and user_id %10=1. -
Click the component
3_rec_sln_demo_user_table_preprocess_v2, and on the Parameters tab on the right, change line 38 in the SQL Script parameter fromWHERE ds = '${pai.system.cycledate}'toWHERE ds = '${pai.system.cycledate}' and user_id %10=1.
-
-
Click the Run icon
 on the toolbar above the Designer canvas.
 -
After the pipeline finishes running, verify that the following MaxCompute tables contain nine days of data:
-
Item feature table:
rec_sln_demo_item_table_preprocess_all_feature_v2 -
Wide behavior log table:
rec_sln_demo_behavior_table_preprocess_v2 -
User feature table:
rec_sln_demo_user_table_preprocess_all_feature_v2
You can query the data in these tables on the SQL query page. For more information, see Connect using DataWorks.
NoteThe project to which these tables belong prohibits full table scans on partitioned tables. You must specify a partition condition in your query. If a full table scan is required, add the
set odps.sql.allow.fullscan=true;statement before your SQL statement and run them together. A full table scan processes more data, which may increase your costs. -